

Key Insights
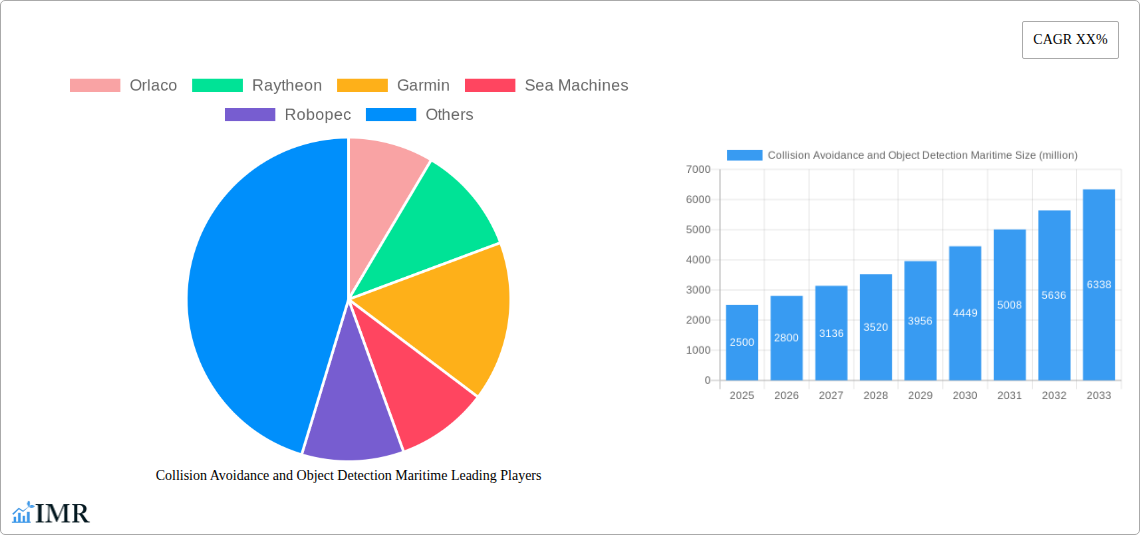
The maritime collision avoidance and object detection market is experiencing robust growth, driven by increasing maritime traffic, stringent safety regulations, and advancements in sensor technology. The market, estimated at $2.5 billion in 2025, is projected to expand at a Compound Annual Growth Rate (CAGR) of 12% from 2025 to 2033, reaching approximately $7.8 billion by 2033. This expansion is fueled by the rising adoption of autonomous vessels and the need for enhanced situational awareness to prevent accidents and protect marine ecosystems. Key technological drivers include the integration of advanced radar, lidar, cameras, and AI-powered algorithms for precise object detection and real-time threat assessment. Further accelerating market growth are government initiatives promoting maritime safety and the increasing demand for improved operational efficiency in shipping and offshore operations.
Despite this positive outlook, market growth faces some challenges. High initial investment costs associated with implementing collision avoidance systems can be a barrier for smaller vessel operators. Furthermore, ensuring interoperability between different systems from various manufacturers requires standardization efforts and robust communication protocols. The market is segmented by technology type (radar, lidar, camera, etc.), vessel type (cargo ships, tankers, cruise ships, etc.), and application (coastal navigation, offshore operations, etc.). Major players like Orlaco, Raytheon, Garmin, Sea Machines, Robopec, Velodyne, Teledyne, Furuno, and Benewake (Beijing) Co. are actively competing through innovation and strategic partnerships to capture market share. The increasing focus on eco-friendly technologies and the integration of data analytics for predictive maintenance are emerging trends influencing the market's trajectory.
Collision Avoidance and Object Detection Maritime Market Report: 2019-2033
This comprehensive report provides an in-depth analysis of the Collision Avoidance and Object Detection Maritime market, encompassing market dynamics, growth trends, regional analysis, competitive landscape, and future outlook. The study period covers 2019-2033, with a base year of 2025 and a forecast period of 2025-2033. The report is crucial for industry professionals, investors, and stakeholders seeking to understand and capitalize on opportunities within this rapidly evolving sector of the maritime parent market and its associated sub-segments.
Collision Avoidance and Object Detection Maritime Market Dynamics & Structure
The Collision Avoidance and Object Detection Maritime market is experiencing significant growth driven by increasing maritime traffic, stringent safety regulations, and technological advancements. Market concentration is moderate, with several key players holding substantial shares, but also with many smaller niche players. Technological innovation, particularly in sensor technologies (LiDAR, radar, camera systems), is a primary driver, leading to more accurate and reliable systems. Regulatory frameworks, such as those mandated by the IMO, are pushing adoption, while the lack of standardized interoperability remains a challenge. Competitive substitutes, like traditional visual observation, are gradually being replaced by automated systems. The market is witnessing a rise in M&A activity, with larger companies acquiring smaller specialized technology firms.
- Market Concentration: Moderate, with the top 5 players holding approximately xx% of the market share in 2025.
- Technological Innovation: Rapid advancements in AI, machine learning, and sensor fusion are key drivers.
- Regulatory Framework: Stringent IMO regulations are driving demand.
- Competitive Substitutes: Traditional methods are being phased out in favor of automated solutions.
- M&A Activity: An increasing number of mergers and acquisitions are reshaping the competitive landscape, with approximately xx deals recorded between 2019 and 2024.
- Innovation Barriers: High R&D costs, integration complexities, and cybersecurity concerns.
Collision Avoidance and Object Detection Maritime Growth Trends & Insights
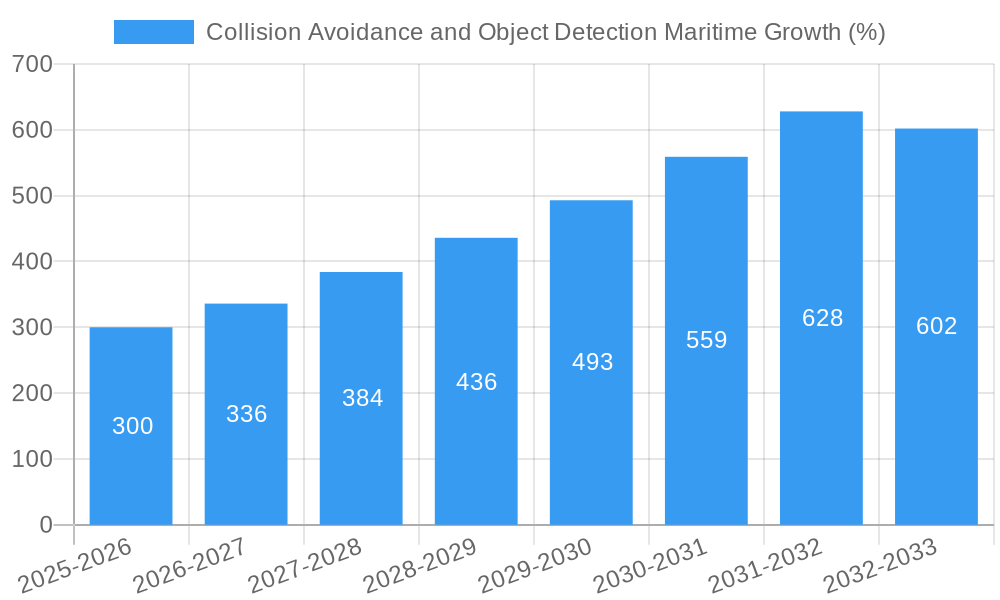
The Collision Avoidance and Object Detection Maritime market is exhibiting robust growth, driven by increasing demand from commercial shipping, fishing, and offshore energy sectors. The market size reached $xx million in 2025 and is projected to reach $xx million by 2033, registering a CAGR of xx% during the forecast period. Adoption rates are increasing significantly across all segments, particularly in larger vessels and high-traffic areas. Technological disruptions, such as the integration of AI and autonomous navigation systems, are further accelerating market growth. Shifting consumer behavior, with a growing preference for safer and more efficient maritime operations, also contributes to market expansion.
- Market Size (2025): $xx million
- Market Size (2033): $xx million
- CAGR (2025-2033): xx%
- Market Penetration (2025): xx%
Dominant Regions, Countries, or Segments in Collision Avoidance and Object Detection Maritime
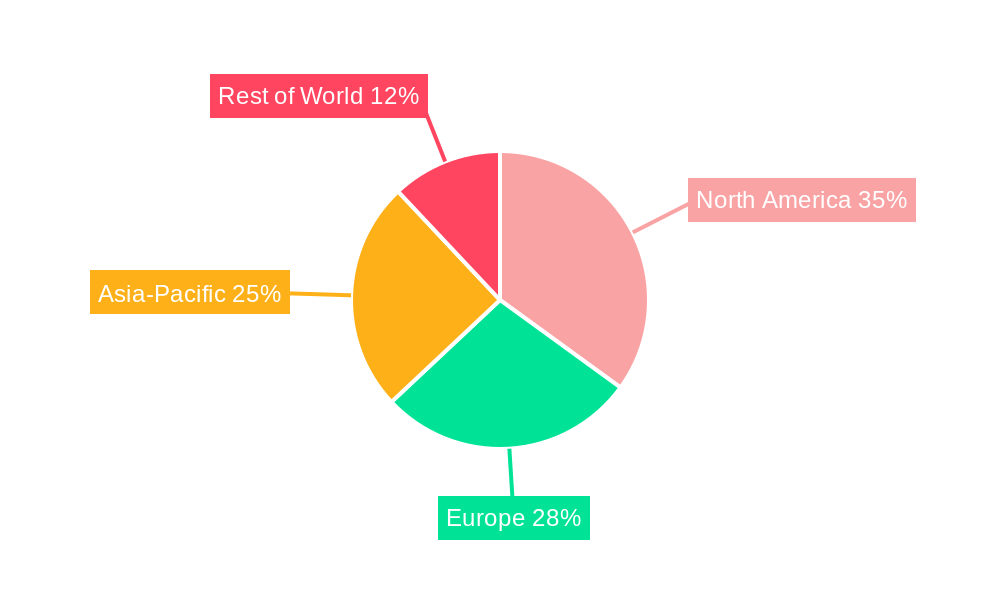
The Asia-Pacific region is currently the dominant market for Collision Avoidance and Object Detection Maritime systems, driven by rapid economic growth, increasing maritime activities, and significant investments in port infrastructure. North America and Europe are also important markets with substantial growth potential. Within segments, the commercial shipping sector holds the largest share, followed by the offshore energy and fishing industries.
- Key Drivers in Asia-Pacific: High maritime traffic, government initiatives to enhance maritime safety, and favorable economic conditions.
- Key Drivers in North America: Stricter safety regulations, technological advancements, and increased investments in maritime infrastructure.
- Key Drivers in Europe: Growing adoption of autonomous systems and investments in smart ports.
- Market Share (Asia-Pacific, 2025): xx%
- Growth Potential (Europe, 2025-2033): xx%
Collision Avoidance and Object Detection Maritime Product Landscape
The market offers a wide array of products, including radar systems, AIS transponders, camera-based systems, LiDAR sensors, and integrated solutions. These systems vary in their range, accuracy, and functionalities. Recent innovations focus on improving sensor fusion, AI-powered object recognition, and the development of compact and cost-effective systems. Unique selling propositions include enhanced accuracy, reduced false alarms, and seamless integration with existing navigational systems. Technological advancements are constantly enhancing the performance metrics, such as detection range and accuracy in challenging weather conditions.
Key Drivers, Barriers & Challenges in Collision Avoidance and Object Detection Maritime
Key Drivers: Increased maritime traffic, stricter safety regulations (IMO), advancements in sensor technologies (LiDAR, radar, AI), and growing demand for autonomous navigation systems.
Key Challenges: High initial investment costs, complexity of integration with existing systems, cybersecurity vulnerabilities, lack of standardization, and the need for skilled personnel for system operation and maintenance. Supply chain disruptions can impact availability and cost, creating an estimated xx% increase in system prices during peak periods.
Emerging Opportunities in Collision Avoidance and Object Detection Maritime
Emerging opportunities lie in the integration of IoT technologies, the development of advanced analytics for predictive maintenance, and the expansion into new markets such as inland waterways and smaller vessels. The increasing adoption of autonomous ships presents significant opportunities for advanced collision avoidance systems. Furthermore, there’s significant potential in developing robust and cost-effective systems for smaller fishing vessels and recreational boats.
Growth Accelerators in the Collision Avoidance and Object Detection Maritime Industry
Technological advancements, particularly in AI and sensor fusion, are driving rapid growth. Strategic partnerships between technology providers and shipbuilders are accelerating market penetration. Furthermore, government initiatives promoting maritime safety and the expansion of smart ports are creating favourable conditions for market growth.
Key Players Shaping the Collision Avoidance and Object Detection Maritime Market
Notable Milestones in Collision Avoidance and Object Detection Maritime Sector
- 2020: IMO adopts new regulations for autonomous ships, driving demand for advanced collision avoidance systems.
- 2021: Several major players launch new integrated solutions combining various sensor technologies.
- 2022: Significant investments in R&D to develop AI-powered object recognition capabilities.
- 2023: Increased M&A activity amongst key players, leading to consolidation in the market.
In-Depth Collision Avoidance and Object Detection Maritime Market Outlook
The Collision Avoidance and Object Detection Maritime market is poised for continued strong growth, driven by technological innovations, stringent regulations, and increasing maritime activities. Strategic partnerships and investments in R&D will shape the competitive landscape. The focus on developing highly accurate, cost-effective, and easily integrable systems will remain a key factor in market success. The long-term outlook is positive, with significant growth potential across various segments and geographic regions.
Collision Avoidance and Object Detection Maritime Segmentation
-
1. Application
- 1.1. Military
- 1.2. Civil
-
2. Types
- 2.1. Lidar
- 2.2. Radar
- 2.3. Others
Collision Avoidance and Object Detection Maritime Segmentation By Geography
-
1. North America
- 1.1. United States
- 1.2. Canada
- 1.3. Mexico
-
2. South America
- 2.1. Brazil
- 2.2. Argentina
- 2.3. Rest of South America
-
3. Europe
- 3.1. United Kingdom
- 3.2. Germany
- 3.3. France
- 3.4. Italy
- 3.5. Spain
- 3.6. Russia
- 3.7. Benelux
- 3.8. Nordics
- 3.9. Rest of Europe
-
4. Middle East & Africa
- 4.1. Turkey
- 4.2. Israel
- 4.3. GCC
- 4.4. North Africa
- 4.5. South Africa
- 4.6. Rest of Middle East & Africa
-
5. Asia Pacific
- 5.1. China
- 5.2. India
- 5.3. Japan
- 5.4. South Korea
- 5.5. ASEAN
- 5.6. Oceania
- 5.7. Rest of Asia Pacific
Collision Avoidance and Object Detection Maritime REPORT HIGHLIGHTS
| Aspects | Details |
|---|---|
| Study Period | 2019-2033 |
| Base Year | 2024 |
| Estimated Year | 2025 |
| Forecast Period | 2025-2033 |
| Historical Period | 2019-2024 |
| Growth Rate | CAGR of XX% from 2019-2033 |
| Segmentation |
|
Table of Contents
- 1. Introduction
- 1.1. Research Scope
- 1.2. Market Segmentation
- 1.3. Research Methodology
- 1.4. Definitions and Assumptions
- 2. Executive Summary
- 2.1. Introduction
- 3. Market Dynamics
- 3.1. Introduction
- 3.2. Market Drivers
- 3.3. Market Restrains
- 3.4. Market Trends
- 4. Market Factor Analysis
- 4.1. Porters Five Forces
- 4.2. Supply/Value Chain
- 4.3. PESTEL analysis
- 4.4. Market Entropy
- 4.5. Patent/Trademark Analysis
- 5. Global Collision Avoidance and Object Detection Maritime Analysis, Insights and Forecast, 2019-2031
- 5.1. Market Analysis, Insights and Forecast - by Application
- 5.1.1. Military
- 5.1.2. Civil
- 5.2. Market Analysis, Insights and Forecast - by Types
- 5.2.1. Lidar
- 5.2.2. Radar
- 5.2.3. Others
- 5.3. Market Analysis, Insights and Forecast - by Region
- 5.3.1. North America
- 5.3.2. South America
- 5.3.3. Europe
- 5.3.4. Middle East & Africa
- 5.3.5. Asia Pacific
- 5.1. Market Analysis, Insights and Forecast - by Application
- 6. North America Collision Avoidance and Object Detection Maritime Analysis, Insights and Forecast, 2019-2031
- 6.1. Market Analysis, Insights and Forecast - by Application
- 6.1.1. Military
- 6.1.2. Civil
- 6.2. Market Analysis, Insights and Forecast - by Types
- 6.2.1. Lidar
- 6.2.2. Radar
- 6.2.3. Others
- 6.1. Market Analysis, Insights and Forecast - by Application
- 7. South America Collision Avoidance and Object Detection Maritime Analysis, Insights and Forecast, 2019-2031
- 7.1. Market Analysis, Insights and Forecast - by Application
- 7.1.1. Military
- 7.1.2. Civil
- 7.2. Market Analysis, Insights and Forecast - by Types
- 7.2.1. Lidar
- 7.2.2. Radar
- 7.2.3. Others
- 7.1. Market Analysis, Insights and Forecast - by Application
- 8. Europe Collision Avoidance and Object Detection Maritime Analysis, Insights and Forecast, 2019-2031
- 8.1. Market Analysis, Insights and Forecast - by Application
- 8.1.1. Military
- 8.1.2. Civil
- 8.2. Market Analysis, Insights and Forecast - by Types
- 8.2.1. Lidar
- 8.2.2. Radar
- 8.2.3. Others
- 8.1. Market Analysis, Insights and Forecast - by Application
- 9. Middle East & Africa Collision Avoidance and Object Detection Maritime Analysis, Insights and Forecast, 2019-2031
- 9.1. Market Analysis, Insights and Forecast - by Application
- 9.1.1. Military
- 9.1.2. Civil
- 9.2. Market Analysis, Insights and Forecast - by Types
- 9.2.1. Lidar
- 9.2.2. Radar
- 9.2.3. Others
- 9.1. Market Analysis, Insights and Forecast - by Application
- 10. Asia Pacific Collision Avoidance and Object Detection Maritime Analysis, Insights and Forecast, 2019-2031
- 10.1. Market Analysis, Insights and Forecast - by Application
- 10.1.1. Military
- 10.1.2. Civil
- 10.2. Market Analysis, Insights and Forecast - by Types
- 10.2.1. Lidar
- 10.2.2. Radar
- 10.2.3. Others
- 10.1. Market Analysis, Insights and Forecast - by Application
- 11. Competitive Analysis
- 11.1. Global Market Share Analysis 2024
- 11.2. Company Profiles
- 11.2.1 Orlaco
- 11.2.1.1. Overview
- 11.2.1.2. Products
- 11.2.1.3. SWOT Analysis
- 11.2.1.4. Recent Developments
- 11.2.1.5. Financials (Based on Availability)
- 11.2.2 Raytheon
- 11.2.2.1. Overview
- 11.2.2.2. Products
- 11.2.2.3. SWOT Analysis
- 11.2.2.4. Recent Developments
- 11.2.2.5. Financials (Based on Availability)
- 11.2.3 Garmin
- 11.2.3.1. Overview
- 11.2.3.2. Products
- 11.2.3.3. SWOT Analysis
- 11.2.3.4. Recent Developments
- 11.2.3.5. Financials (Based on Availability)
- 11.2.4 Sea Machines
- 11.2.4.1. Overview
- 11.2.4.2. Products
- 11.2.4.3. SWOT Analysis
- 11.2.4.4. Recent Developments
- 11.2.4.5. Financials (Based on Availability)
- 11.2.5 Robopec
- 11.2.5.1. Overview
- 11.2.5.2. Products
- 11.2.5.3. SWOT Analysis
- 11.2.5.4. Recent Developments
- 11.2.5.5. Financials (Based on Availability)
- 11.2.6 Velodyne
- 11.2.6.1. Overview
- 11.2.6.2. Products
- 11.2.6.3. SWOT Analysis
- 11.2.6.4. Recent Developments
- 11.2.6.5. Financials (Based on Availability)
- 11.2.7 Teledyne
- 11.2.7.1. Overview
- 11.2.7.2. Products
- 11.2.7.3. SWOT Analysis
- 11.2.7.4. Recent Developments
- 11.2.7.5. Financials (Based on Availability)
- 11.2.8 Furuno
- 11.2.8.1. Overview
- 11.2.8.2. Products
- 11.2.8.3. SWOT Analysis
- 11.2.8.4. Recent Developments
- 11.2.8.5. Financials (Based on Availability)
- 11.2.9 Benewake (Beijing) Co
- 11.2.9.1. Overview
- 11.2.9.2. Products
- 11.2.9.3. SWOT Analysis
- 11.2.9.4. Recent Developments
- 11.2.9.5. Financials (Based on Availability)
- 11.2.1 Orlaco
List of Figures
- Figure 1: Global Collision Avoidance and Object Detection Maritime Revenue Breakdown (million, %) by Region 2024 & 2032
- Figure 2: North America Collision Avoidance and Object Detection Maritime Revenue (million), by Application 2024 & 2032
- Figure 3: North America Collision Avoidance and Object Detection Maritime Revenue Share (%), by Application 2024 & 2032
- Figure 4: North America Collision Avoidance and Object Detection Maritime Revenue (million), by Types 2024 & 2032
- Figure 5: North America Collision Avoidance and Object Detection Maritime Revenue Share (%), by Types 2024 & 2032
- Figure 6: North America Collision Avoidance and Object Detection Maritime Revenue (million), by Country 2024 & 2032
- Figure 7: North America Collision Avoidance and Object Detection Maritime Revenue Share (%), by Country 2024 & 2032
- Figure 8: South America Collision Avoidance and Object Detection Maritime Revenue (million), by Application 2024 & 2032
- Figure 9: South America Collision Avoidance and Object Detection Maritime Revenue Share (%), by Application 2024 & 2032
- Figure 10: South America Collision Avoidance and Object Detection Maritime Revenue (million), by Types 2024 & 2032
- Figure 11: South America Collision Avoidance and Object Detection Maritime Revenue Share (%), by Types 2024 & 2032
- Figure 12: South America Collision Avoidance and Object Detection Maritime Revenue (million), by Country 2024 & 2032
- Figure 13: South America Collision Avoidance and Object Detection Maritime Revenue Share (%), by Country 2024 & 2032
- Figure 14: Europe Collision Avoidance and Object Detection Maritime Revenue (million), by Application 2024 & 2032
- Figure 15: Europe Collision Avoidance and Object Detection Maritime Revenue Share (%), by Application 2024 & 2032
- Figure 16: Europe Collision Avoidance and Object Detection Maritime Revenue (million), by Types 2024 & 2032
- Figure 17: Europe Collision Avoidance and Object Detection Maritime Revenue Share (%), by Types 2024 & 2032
- Figure 18: Europe Collision Avoidance and Object Detection Maritime Revenue (million), by Country 2024 & 2032
- Figure 19: Europe Collision Avoidance and Object Detection Maritime Revenue Share (%), by Country 2024 & 2032
- Figure 20: Middle East & Africa Collision Avoidance and Object Detection Maritime Revenue (million), by Application 2024 & 2032
- Figure 21: Middle East & Africa Collision Avoidance and Object Detection Maritime Revenue Share (%), by Application 2024 & 2032
- Figure 22: Middle East & Africa Collision Avoidance and Object Detection Maritime Revenue (million), by Types 2024 & 2032
- Figure 23: Middle East & Africa Collision Avoidance and Object Detection Maritime Revenue Share (%), by Types 2024 & 2032
- Figure 24: Middle East & Africa Collision Avoidance and Object Detection Maritime Revenue (million), by Country 2024 & 2032
- Figure 25: Middle East & Africa Collision Avoidance and Object Detection Maritime Revenue Share (%), by Country 2024 & 2032
- Figure 26: Asia Pacific Collision Avoidance and Object Detection Maritime Revenue (million), by Application 2024 & 2032
- Figure 27: Asia Pacific Collision Avoidance and Object Detection Maritime Revenue Share (%), by Application 2024 & 2032
- Figure 28: Asia Pacific Collision Avoidance and Object Detection Maritime Revenue (million), by Types 2024 & 2032
- Figure 29: Asia Pacific Collision Avoidance and Object Detection Maritime Revenue Share (%), by Types 2024 & 2032
- Figure 30: Asia Pacific Collision Avoidance and Object Detection Maritime Revenue (million), by Country 2024 & 2032
- Figure 31: Asia Pacific Collision Avoidance and Object Detection Maritime Revenue Share (%), by Country 2024 & 2032
List of Tables
- Table 1: Global Collision Avoidance and Object Detection Maritime Revenue million Forecast, by Region 2019 & 2032
- Table 2: Global Collision Avoidance and Object Detection Maritime Revenue million Forecast, by Application 2019 & 2032
- Table 3: Global Collision Avoidance and Object Detection Maritime Revenue million Forecast, by Types 2019 & 2032
- Table 4: Global Collision Avoidance and Object Detection Maritime Revenue million Forecast, by Region 2019 & 2032
- Table 5: Global Collision Avoidance and Object Detection Maritime Revenue million Forecast, by Application 2019 & 2032
- Table 6: Global Collision Avoidance and Object Detection Maritime Revenue million Forecast, by Types 2019 & 2032
- Table 7: Global Collision Avoidance and Object Detection Maritime Revenue million Forecast, by Country 2019 & 2032
- Table 8: United States Collision Avoidance and Object Detection Maritime Revenue (million) Forecast, by Application 2019 & 2032
- Table 9: Canada Collision Avoidance and Object Detection Maritime Revenue (million) Forecast, by Application 2019 & 2032
- Table 10: Mexico Collision Avoidance and Object Detection Maritime Revenue (million) Forecast, by Application 2019 & 2032
- Table 11: Global Collision Avoidance and Object Detection Maritime Revenue million Forecast, by Application 2019 & 2032
- Table 12: Global Collision Avoidance and Object Detection Maritime Revenue million Forecast, by Types 2019 & 2032
- Table 13: Global Collision Avoidance and Object Detection Maritime Revenue million Forecast, by Country 2019 & 2032
- Table 14: Brazil Collision Avoidance and Object Detection Maritime Revenue (million) Forecast, by Application 2019 & 2032
- Table 15: Argentina Collision Avoidance and Object Detection Maritime Revenue (million) Forecast, by Application 2019 & 2032
- Table 16: Rest of South America Collision Avoidance and Object Detection Maritime Revenue (million) Forecast, by Application 2019 & 2032
- Table 17: Global Collision Avoidance and Object Detection Maritime Revenue million Forecast, by Application 2019 & 2032
- Table 18: Global Collision Avoidance and Object Detection Maritime Revenue million Forecast, by Types 2019 & 2032
- Table 19: Global Collision Avoidance and Object Detection Maritime Revenue million Forecast, by Country 2019 & 2032
- Table 20: United Kingdom Collision Avoidance and Object Detection Maritime Revenue (million) Forecast, by Application 2019 & 2032
- Table 21: Germany Collision Avoidance and Object Detection Maritime Revenue (million) Forecast, by Application 2019 & 2032
- Table 22: France Collision Avoidance and Object Detection Maritime Revenue (million) Forecast, by Application 2019 & 2032
- Table 23: Italy Collision Avoidance and Object Detection Maritime Revenue (million) Forecast, by Application 2019 & 2032
- Table 24: Spain Collision Avoidance and Object Detection Maritime Revenue (million) Forecast, by Application 2019 & 2032
- Table 25: Russia Collision Avoidance and Object Detection Maritime Revenue (million) Forecast, by Application 2019 & 2032
- Table 26: Benelux Collision Avoidance and Object Detection Maritime Revenue (million) Forecast, by Application 2019 & 2032
- Table 27: Nordics Collision Avoidance and Object Detection Maritime Revenue (million) Forecast, by Application 2019 & 2032
- Table 28: Rest of Europe Collision Avoidance and Object Detection Maritime Revenue (million) Forecast, by Application 2019 & 2032
- Table 29: Global Collision Avoidance and Object Detection Maritime Revenue million Forecast, by Application 2019 & 2032
- Table 30: Global Collision Avoidance and Object Detection Maritime Revenue million Forecast, by Types 2019 & 2032
- Table 31: Global Collision Avoidance and Object Detection Maritime Revenue million Forecast, by Country 2019 & 2032
- Table 32: Turkey Collision Avoidance and Object Detection Maritime Revenue (million) Forecast, by Application 2019 & 2032
- Table 33: Israel Collision Avoidance and Object Detection Maritime Revenue (million) Forecast, by Application 2019 & 2032
- Table 34: GCC Collision Avoidance and Object Detection Maritime Revenue (million) Forecast, by Application 2019 & 2032
- Table 35: North Africa Collision Avoidance and Object Detection Maritime Revenue (million) Forecast, by Application 2019 & 2032
- Table 36: South Africa Collision Avoidance and Object Detection Maritime Revenue (million) Forecast, by Application 2019 & 2032
- Table 37: Rest of Middle East & Africa Collision Avoidance and Object Detection Maritime Revenue (million) Forecast, by Application 2019 & 2032
- Table 38: Global Collision Avoidance and Object Detection Maritime Revenue million Forecast, by Application 2019 & 2032
- Table 39: Global Collision Avoidance and Object Detection Maritime Revenue million Forecast, by Types 2019 & 2032
- Table 40: Global Collision Avoidance and Object Detection Maritime Revenue million Forecast, by Country 2019 & 2032
- Table 41: China Collision Avoidance and Object Detection Maritime Revenue (million) Forecast, by Application 2019 & 2032
- Table 42: India Collision Avoidance and Object Detection Maritime Revenue (million) Forecast, by Application 2019 & 2032
- Table 43: Japan Collision Avoidance and Object Detection Maritime Revenue (million) Forecast, by Application 2019 & 2032
- Table 44: South Korea Collision Avoidance and Object Detection Maritime Revenue (million) Forecast, by Application 2019 & 2032
- Table 45: ASEAN Collision Avoidance and Object Detection Maritime Revenue (million) Forecast, by Application 2019 & 2032
- Table 46: Oceania Collision Avoidance and Object Detection Maritime Revenue (million) Forecast, by Application 2019 & 2032
- Table 47: Rest of Asia Pacific Collision Avoidance and Object Detection Maritime Revenue (million) Forecast, by Application 2019 & 2032
Frequently Asked Questions
1. What is the projected Compound Annual Growth Rate (CAGR) of the Collision Avoidance and Object Detection Maritime?
The projected CAGR is approximately XX%.
2. Which companies are prominent players in the Collision Avoidance and Object Detection Maritime?
Key companies in the market include Orlaco, Raytheon, Garmin, Sea Machines, Robopec, Velodyne, Teledyne, Furuno, Benewake (Beijing) Co.
3. What are the main segments of the Collision Avoidance and Object Detection Maritime?
The market segments include Application, Types.
4. Can you provide details about the market size?
The market size is estimated to be USD XXX million as of 2022.
5. What are some drivers contributing to market growth?
N/A
6. What are the notable trends driving market growth?
N/A
7. Are there any restraints impacting market growth?
N/A
8. Can you provide examples of recent developments in the market?
N/A
9. What pricing options are available for accessing the report?
Pricing options include single-user, multi-user, and enterprise licenses priced at USD 2900.00, USD 4350.00, and USD 5800.00 respectively.
10. Is the market size provided in terms of value or volume?
The market size is provided in terms of value, measured in million.
11. Are there any specific market keywords associated with the report?
Yes, the market keyword associated with the report is "Collision Avoidance and Object Detection Maritime," which aids in identifying and referencing the specific market segment covered.
12. How do I determine which pricing option suits my needs best?
The pricing options vary based on user requirements and access needs. Individual users may opt for single-user licenses, while businesses requiring broader access may choose multi-user or enterprise licenses for cost-effective access to the report.
13. Are there any additional resources or data provided in the Collision Avoidance and Object Detection Maritime report?
While the report offers comprehensive insights, it's advisable to review the specific contents or supplementary materials provided to ascertain if additional resources or data are available.
14. How can I stay updated on further developments or reports in the Collision Avoidance and Object Detection Maritime?
To stay informed about further developments, trends, and reports in the Collision Avoidance and Object Detection Maritime, consider subscribing to industry newsletters, following relevant companies and organizations, or regularly checking reputable industry news sources and publications.
Methodology
Step 1 - Identification of Relevant Samples Size from Population Database


Step 2 - Approaches for Defining Global Market Size (Value, Volume* & Price*)

Note*: In applicable scenarios
Step 3 - Data Sources
Primary Research
- Web Analytics
- Survey Reports
- Research Institute
- Latest Research Reports
- Opinion Leaders
Secondary Research
- Annual Reports
- White Paper
- Latest Press Release
- Industry Association
- Paid Database
- Investor Presentations

Step 4 - Data Triangulation
Involves using different sources of information in order to increase the validity of a study
These sources are likely to be stakeholders in a program - participants, other researchers, program staff, other community members, and so on.
Then we put all data in single framework & apply various statistical tools to find out the dynamic on the market.
During the analysis stage, feedback from the stakeholder groups would be compared to determine areas of agreement as well as areas of divergence
