

Key Insights
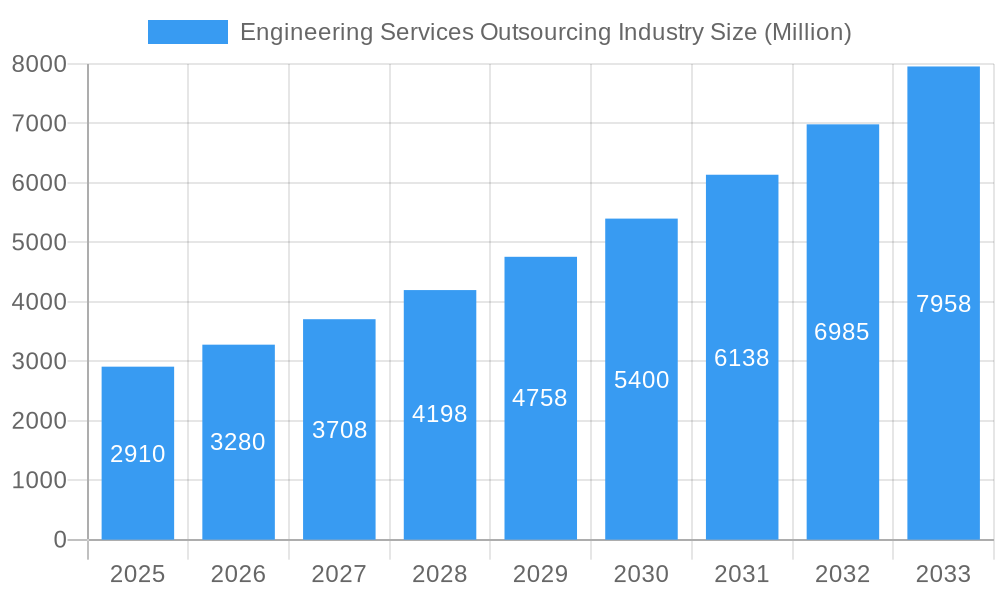
The Engineering Services Outsourcing (ESO) market is experiencing robust growth, projected to reach $2.91 billion in 2025 and exhibiting a Compound Annual Growth Rate (CAGR) of 12.89% from 2025 to 2033. This expansion is driven by several key factors. Firstly, the increasing complexity of engineering projects across various industries, coupled with rising labor costs in developed nations, necessitates cost-effective and efficient outsourcing solutions. Secondly, the adoption of advanced technologies like Artificial Intelligence (AI), Machine Learning (ML), and the Internet of Things (IoT) within engineering processes fuels demand for specialized ESO services. Finally, the global push for digital transformation across sectors further accelerates the need for skilled engineering expertise readily available through outsourcing. Leading players like Tech Mahindra, TCS, Infosys, and HCL Technologies are leveraging their expertise and global presence to capitalize on this growth, driving intense competition and innovation within the market.
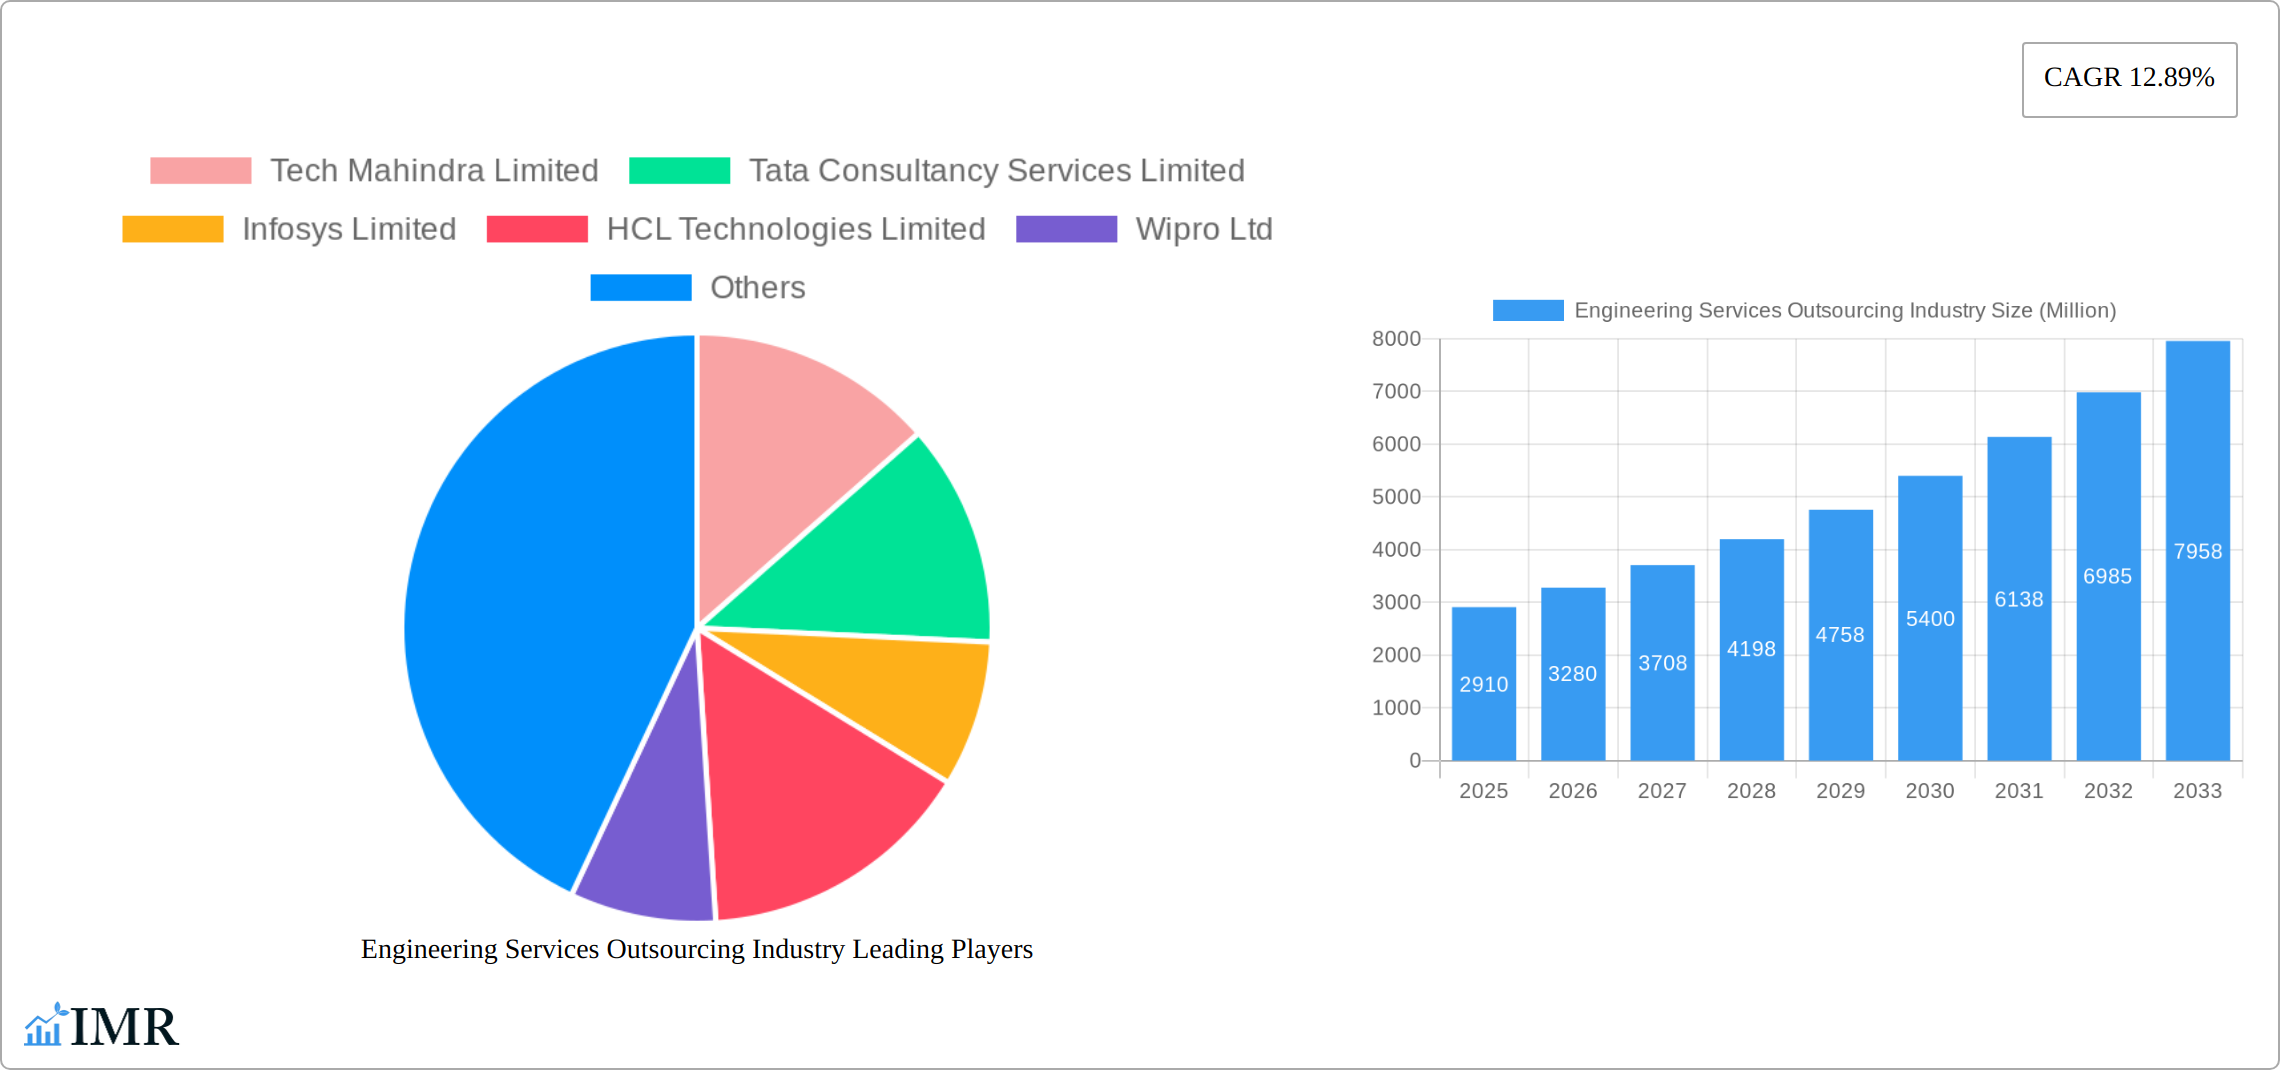
Engineering Services Outsourcing Industry Market Size (In Billion)
The continued growth in the ESO market is anticipated to be influenced by several dynamic trends. The rising adoption of cloud-based engineering solutions enhances scalability and accessibility, while the increasing emphasis on sustainability and green technologies within engineering design drives demand for specialized ESO services in this area. However, potential restraints include geopolitical instability, fluctuations in currency exchange rates, and the risk of data security breaches, particularly when sensitive project information is outsourced. While the provided data doesn't segment the market explicitly, it's reasonable to assume significant segmentation exists across various engineering disciplines (mechanical, electrical, software, etc.) and industry verticals (automotive, aerospace, manufacturing, etc.). Successfully navigating these challenges and capitalizing on emerging trends will be critical for ESO providers to maintain their competitive edge and sustain their impressive growth trajectory over the forecast period.
Engineering Services Outsourcing Industry Company Market Share
Engineering Services Outsourcing Industry: A Comprehensive Market Report (2019-2033)
This in-depth report provides a comprehensive analysis of the Engineering Services Outsourcing (ESO) industry, covering market dynamics, growth trends, key players, and future opportunities. With a study period spanning 2019-2033, a base year of 2025, and a forecast period of 2025-2033, this report is an essential resource for industry professionals, investors, and strategic decision-makers. The report analyzes the parent market of IT Outsourcing and the child market of Engineering Services Outsourcing, providing a granular view of the market segmentation and dynamics. The total market size is estimated at xx Million in 2025 and is projected to reach xx Million by 2033.
Engineering Services Outsourcing Industry Market Dynamics & Structure
The Engineering Services Outsourcing (ESO) industry is characterized by a dynamic and evolving market structure, exhibiting moderate concentration with several prominent global players commanding substantial market share. Leading entities such as Tech Mahindra Limited, Tata Consultancy Services Limited, Infosys Limited, HCL Technologies Limited, and Wipro Ltd consistently shape the competitive landscape. The industry's trajectory is significantly propelled by rapid technological advancements, including the widespread integration of Artificial Intelligence (AI), the Internet of Things (IoT), and robust cloud computing solutions. These innovations are fundamentally transforming traditional engineering processes and fostering a burgeoning demand for highly specialized outsourcing services. Furthermore, stringent regulatory frameworks, particularly those addressing data privacy and cybersecurity, exert a considerable influence on operational strategies and compliance mandates. The persistent presence of competitive product substitutes, notably in-house engineering departments, compels ESO providers to continuously emphasize innovation, deliver exceptional value, and maintain competitive pricing strategies. The end-user demographic is remarkably diverse, spanning critical sectors such as manufacturing, automotive, aerospace, and energy. Mergers and Acquisitions (M&A) remain a prevalent activity, driven by organizations aiming to strategically broaden their service portfolios, enhance their technological capabilities, and expand their global operational footprint.
- Market Concentration: The top 5 players are projected to account for approximately 50-60% of the market share in 2025, indicating a moderately concentrated landscape.
- Technological Innovation: Key disruptive technologies driving growth include AI and Machine Learning for enhanced automation and predictive analytics, Digital Twins for advanced simulation and design, and edge computing for real-time data processing.
- Regulatory Frameworks: Strict adherence to global data protection regulations like GDPR, CCPA, and emerging cybersecurity standards is paramount for operational integrity and client trust.
- Competitive Substitutes: The continuous development of in-house engineering capabilities and the increasing accessibility of open-source engineering tools present ongoing competitive pressure.
- End-User Demographics: The manufacturing, automotive, and aerospace sectors represent the largest and most significant end-user segments, with growing contributions from telecommunications and healthcare.
- M&A Trends: An estimated 15-20 significant M&A deals were recorded in the historical period (2019-2024), reflecting strategic consolidations and acquisitions to gain market access and specialized expertise.
Engineering Services Outsourcing Industry Growth Trends & Insights
The Engineering Services Outsourcing market has demonstrated robust growth, evidenced by a Compound Annual Growth Rate (CAGR) of approximately 10-12% during the historical period spanning from 2019 to 2024. This market expansion is primarily fueled by a confluence of factors, including the escalating global demand for specialized and niche engineering expertise, the accelerating adoption of digital transformation initiatives across industries, and the persistent pursuit of cost optimization and efficiency gains by businesses worldwide. Technological disruptions, notably the pervasive influence of automation and the sophisticated capabilities of AI-powered tools, are fundamentally reshaping the industry's operational paradigms and service delivery models. Concurrently, evolving consumer preferences and business demands for more agile, flexible, and outcome-driven outsourcing engagements are further influencing and accelerating market growth. While market penetration remains high in well-established, mature economies, there are substantial and largely untapped growth opportunities within burgeoning emerging economies, offering significant potential for expansion and diversification.
- CAGR (2019-2024): Approximately 10-12%
- Market Penetration (2024): Estimated at 40-50% in developed markets, with significant room for growth in emerging economies.
- Market Size (2024): Estimated to be in the range of $350-$400 Billion.
- Projected Market Size (2033): Forecasted to reach between $800-$950 Billion.
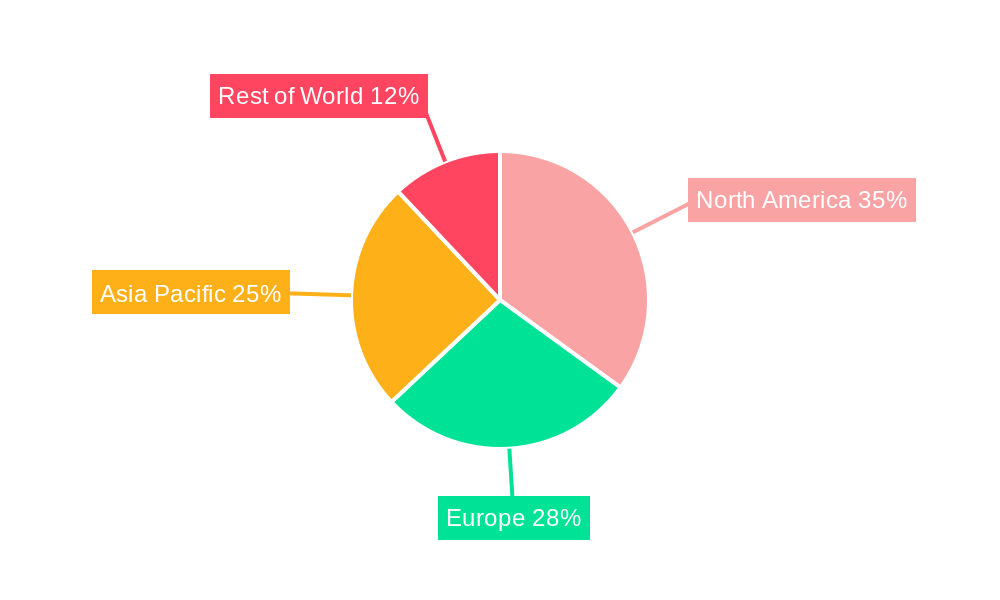
Dominant Regions, Countries, or Segments in Engineering Services Outsourcing Industry
North America and Europe currently dominate the Engineering Services Outsourcing market, accounting for xx% of the global market share in 2025. However, Asia-Pacific is witnessing rapid growth, driven by increasing technological adoption and a large pool of skilled engineers. Specific countries like India, China, and the US are key contributors to this growth.
- Key Drivers in North America: Strong R&D investment, high technological adoption rates, and a well-established outsourcing ecosystem.
- Key Drivers in Asia-Pacific: Favorable government policies, cost-effective labor, and a growing pool of skilled engineers.
- Key Drivers in Europe: Focus on innovation, high demand for specialized engineering services, and supportive regulatory environment.
Engineering Services Outsourcing Industry Product Landscape
The ESO market encompasses a wide range of services, including product design and development, testing and quality assurance, and manufacturing process optimization. Innovation focuses on developing AI-powered tools for design automation, simulation, and predictive maintenance. Key performance metrics include design cycle time, product quality, and cost efficiency. Unique selling propositions often center on specialized expertise, rapid prototyping capabilities, and cost-effective solutions.
Key Drivers, Barriers & Challenges in Engineering Services Outsourcing Industry
Key Drivers:
- Increasing global demand for highly specialized and niche engineering expertise to augment in-house capabilities and address skill gaps.
- Accelerated adoption of digital transformation technologies such as AI, IoT, cloud, and big data analytics, driving the need for integrated engineering solutions.
- Persistent focus on cost optimization strategies and operational efficiency by businesses seeking to reduce overheads and improve profitability.
- Growing emphasis on rapid innovation, accelerated product development cycles, and the deployment of advanced engineering solutions to maintain competitive advantage.
- The need to access specialized talent and cutting-edge technologies that may not be readily available internally.
Challenges & Restraints:
- Heightened concerns surrounding data security, intellectual property protection, and the potential for breaches in an increasingly connected environment.
- Complexities in effective communication, seamless collaboration, and maintaining cultural alignment across geographically dispersed teams and diverse stakeholders.
- Intense competition from a growing number of established players, specialized niche providers, and new market entrants, leading to price pressures. This competition contributes to an estimated 5-8% reduction in average profit margins annually for many providers.
- Navigating diverse and evolving regulatory landscapes across different regions and industries.
- The risk of vendor lock-in and the challenges associated with managing vendor relationships effectively.
Emerging Opportunities in Engineering Services Outsourcing Industry
Significant emerging opportunities are being carved out in the rapidly expanding domains of AI-driven engineering solutions, the pervasive integration of IoT devices, and the critical development of sustainable and green technologies. Untapped and rapidly growing markets in developing economies present substantial avenues for expansion and market penetration. The increasing widespread adoption of advanced cloud-based platforms and sophisticated remote collaboration tools is not only enhancing operational efficiency but also creating entirely new possibilities for scalable, flexible, and cost-effective outsourcing solutions, particularly for distributed global teams.
Growth Accelerators in the Engineering Services Outsourcing Industry
Technological breakthroughs, particularly in AI and automation, are accelerating market growth. Strategic partnerships between ESO providers and technology companies are enhancing service capabilities. Market expansion strategies targeting new industries and geographies are fueling further growth.
Key Players Shaping the Engineering Services Outsourcing Industry Market
- Tech Mahindra Limited
- Tata Consultancy Services Limited
- Infosys Limited
- HCL Technologies Limited
- Wipro Ltd
- Capgemini Technology Services India Limited
- Globallogic Inc
- Accenture
- RLE International Inc
- ASAP Holding GmbH
- Tata Technologies
Notable Milestones in Engineering Services Outsourcing Industry Sector
- April 2023: Marks & Spencer PLC solidified its long-term partnership with Tata Consultancy Services (TCS) by extending their engagement for a critical technology modernization program aimed at enhancing their digital infrastructure and customer experience.
- February 2023: Tech Mahindra proactively signed a Memorandum of Understanding (MoU) with the Saudi Arabian Ministry of Communication and Information Technology to jointly establish a state-of-the-art Data & AI and Cloud Centre of Excellence, underscoring a strategic commitment to fostering digital innovation in the region.
- January 2023: Infosys announced a strategic collaboration with a major automotive OEM to accelerate their digital transformation journey, focusing on leveraging IoT and cloud technologies for enhanced vehicle connectivity and data analytics.
- November 2022: Wipro acquired a specialized engineering firm focused on advanced automotive electronics, aiming to bolster its capabilities in the rapidly growing connected and autonomous vehicle segment.
In-Depth Engineering Services Outsourcing Industry Market Outlook
The Engineering Services Outsourcing market is poised for sustained growth, driven by the continued adoption of digital technologies and the increasing demand for specialized engineering expertise across various industries. Strategic partnerships, technological innovations, and expansion into new markets will be key factors shaping future market dynamics. The market presents significant opportunities for companies that can adapt to evolving technologies and client needs, providing innovative and cost-effective solutions.
Engineering Services Outsourcing Industry Segmentation
-
1. Services
- 1.1. Designing
- 1.2. Prototyping
- 1.3. System Integration
- 1.4. Testing
- 1.5. Others
-
2. End User
- 2.1. Automotive
- 2.2. Industrial
- 2.3. Consumer Electronics And Semiconductors
- 2.4. Telecom
- 2.5. Others
Engineering Services Outsourcing Industry Segmentation By Geography
-
1. North America
- 1.1. United States
- 1.2. Canada
- 1.3. Mexico
-
2. Europe
- 2.1. United Kingdom
- 2.2. Germany
- 2.3. France
- 2.4. Italy
- 2.5. Spain
- 2.6. Rest of Europe
-
3. Asia Pacific
- 3.1. China
- 3.2. India
- 3.3. Japan
- 3.4. South Korea
- 3.5. Thailand
- 3.6. Indonesia
- 3.7. Rest of Asia pacific
- 4. Rest of the World
Engineering Services Outsourcing Industry Regional Market Share
Geographic Coverage of Engineering Services Outsourcing Industry
Engineering Services Outsourcing Industry REPORT HIGHLIGHTS
| Aspects | Details |
|---|---|
| Study Period | 2020-2034 |
| Base Year | 2025 |
| Estimated Year | 2026 |
| Forecast Period | 2026-2034 |
| Historical Period | 2020-2025 |
| Growth Rate | CAGR of 12.89% from 2020-2034 |
| Segmentation |
|
Table of Contents
- 1. Introduction
- 1.1. Research Scope
- 1.2. Market Segmentation
- 1.3. Research Objective
- 1.4. Definitions and Assumptions
- 2. Executive Summary
- 2.1. Market Snapshot
- 3. Market Dynamics
- 3.1. Market Drivers
- 3.2. Market Restrains
- 3.3. Market Trends
- 3.4. Market Opportunities
- 4. Market Factor Analysis
- 4.1. Porters Five Forces
- 4.1.1. Bargaining Power of Suppliers
- 4.1.2. Bargaining Power of Buyers
- 4.1.3. Threat of New Entrants
- 4.1.4. Threat of Substitutes
- 4.1.5. Competitive Rivalry
- 4.2. PESTEL analysis
- 4.3. BCG Analysis
- 4.3.1. Stars (High Growth, High Market Share)
- 4.3.2. Cash Cows (Low Growth, High Market Share)
- 4.3.3. Question Mark (High Growth, Low Market Share)
- 4.3.4. Dogs (Low Growth, Low Market Share)
- 4.4. Ansoff Matrix Analysis
- 4.5. Supply Chain Analysis
- 4.6. Regulatory Landscape
- 4.7. Current Market Potential and Opportunity Assessment (TAM–SAM–SOM Framework)
- 4.8. IMR Analyst Note
- 4.1. Porters Five Forces
- 5. Market Analysis, Insights and Forecast 2021-2033
- 5.1. Market Analysis, Insights and Forecast - by Services
- 5.1.1. Designing
- 5.1.2. Prototyping
- 5.1.3. System Integration
- 5.1.4. Testing
- 5.1.5. Others
- 5.2. Market Analysis, Insights and Forecast - by End User
- 5.2.1. Automotive
- 5.2.2. Industrial
- 5.2.3. Consumer Electronics And Semiconductors
- 5.2.4. Telecom
- 5.2.5. Others
- 5.3. Market Analysis, Insights and Forecast - by Region
- 5.3.1. North America
- 5.3.2. Europe
- 5.3.3. Asia Pacific
- 5.3.4. Rest of the World
- 5.1. Market Analysis, Insights and Forecast - by Services
- 6. Global Engineering Services Outsourcing Industry Analysis, Insights and Forecast, 2021-2033
- 6.1. Market Analysis, Insights and Forecast - by Services
- 6.1.1. Designing
- 6.1.2. Prototyping
- 6.1.3. System Integration
- 6.1.4. Testing
- 6.1.5. Others
- 6.2. Market Analysis, Insights and Forecast - by End User
- 6.2.1. Automotive
- 6.2.2. Industrial
- 6.2.3. Consumer Electronics And Semiconductors
- 6.2.4. Telecom
- 6.2.5. Others
- 6.1. Market Analysis, Insights and Forecast - by Services
- 7. North America Engineering Services Outsourcing Industry Analysis, Insights and Forecast, 2020-2032
- 7.1. Market Analysis, Insights and Forecast - by Services
- 7.1.1. Designing
- 7.1.2. Prototyping
- 7.1.3. System Integration
- 7.1.4. Testing
- 7.1.5. Others
- 7.2. Market Analysis, Insights and Forecast - by End User
- 7.2.1. Automotive
- 7.2.2. Industrial
- 7.2.3. Consumer Electronics And Semiconductors
- 7.2.4. Telecom
- 7.2.5. Others
- 7.1. Market Analysis, Insights and Forecast - by Services
- 8. Europe Engineering Services Outsourcing Industry Analysis, Insights and Forecast, 2020-2032
- 8.1. Market Analysis, Insights and Forecast - by Services
- 8.1.1. Designing
- 8.1.2. Prototyping
- 8.1.3. System Integration
- 8.1.4. Testing
- 8.1.5. Others
- 8.2. Market Analysis, Insights and Forecast - by End User
- 8.2.1. Automotive
- 8.2.2. Industrial
- 8.2.3. Consumer Electronics And Semiconductors
- 8.2.4. Telecom
- 8.2.5. Others
- 8.1. Market Analysis, Insights and Forecast - by Services
- 9. Asia Pacific Engineering Services Outsourcing Industry Analysis, Insights and Forecast, 2020-2032
- 9.1. Market Analysis, Insights and Forecast - by Services
- 9.1.1. Designing
- 9.1.2. Prototyping
- 9.1.3. System Integration
- 9.1.4. Testing
- 9.1.5. Others
- 9.2. Market Analysis, Insights and Forecast - by End User
- 9.2.1. Automotive
- 9.2.2. Industrial
- 9.2.3. Consumer Electronics And Semiconductors
- 9.2.4. Telecom
- 9.2.5. Others
- 9.1. Market Analysis, Insights and Forecast - by Services
- 10. Rest of the World Engineering Services Outsourcing Industry Analysis, Insights and Forecast, 2020-2032
- 10.1. Market Analysis, Insights and Forecast - by Services
- 10.1.1. Designing
- 10.1.2. Prototyping
- 10.1.3. System Integration
- 10.1.4. Testing
- 10.1.5. Others
- 10.2. Market Analysis, Insights and Forecast - by End User
- 10.2.1. Automotive
- 10.2.2. Industrial
- 10.2.3. Consumer Electronics And Semiconductors
- 10.2.4. Telecom
- 10.2.5. Others
- 10.1. Market Analysis, Insights and Forecast - by Services
- 11. Competitive Analysis
- 11.1. Company Profiles
- 11.1.1 Tech Mahindra Limited
- 11.1.1.1. Company Overview
- 11.1.1.2. Products
- 11.1.1.3. Company Financials
- 11.1.1.4. SWOT Analysis
- 11.1.2 Tata Consultancy Services Limited
- 11.1.2.1. Company Overview
- 11.1.2.2. Products
- 11.1.2.3. Company Financials
- 11.1.2.4. SWOT Analysis
- 11.1.3 Infosys Limited
- 11.1.3.1. Company Overview
- 11.1.3.2. Products
- 11.1.3.3. Company Financials
- 11.1.3.4. SWOT Analysis
- 11.1.4 HCL Technologies Limited
- 11.1.4.1. Company Overview
- 11.1.4.2. Products
- 11.1.4.3. Company Financials
- 11.1.4.4. SWOT Analysis
- 11.1.5 Wipro Ltd
- 11.1.5.1. Company Overview
- 11.1.5.2. Products
- 11.1.5.3. Company Financials
- 11.1.5.4. SWOT Analysis
- 11.1.6 Capgemini Technology Services India Limited
- 11.1.6.1. Company Overview
- 11.1.6.2. Products
- 11.1.6.3. Company Financials
- 11.1.6.4. SWOT Analysis
- 11.1.7 Globallogic Inc
- 11.1.7.1. Company Overview
- 11.1.7.2. Products
- 11.1.7.3. Company Financials
- 11.1.7.4. SWOT Analysis
- 11.1.8 Accenture
- 11.1.8.1. Company Overview
- 11.1.8.2. Products
- 11.1.8.3. Company Financials
- 11.1.8.4. SWOT Analysis
- 11.1.9 RLE International Inc
- 11.1.9.1. Company Overview
- 11.1.9.2. Products
- 11.1.9.3. Company Financials
- 11.1.9.4. SWOT Analysis
- 11.1.10 ASAP Holding GmbH
- 11.1.10.1. Company Overview
- 11.1.10.2. Products
- 11.1.10.3. Company Financials
- 11.1.10.4. SWOT Analysis
- 11.1.11 Tata Technologies**List Not Exhaustive
- 11.1.11.1. Company Overview
- 11.1.11.2. Products
- 11.1.11.3. Company Financials
- 11.1.11.4. SWOT Analysis
- 11.1.1 Tech Mahindra Limited
- 11.2. Market Entropy
- 11.2.1 Company's Key Areas Served
- 11.2.2 Recent Developments
- 11.3. Company Market Share Analysis 2025
- 11.3.1 Top 5 Companies Market Share Analysis
- 11.3.2 Top 3 Companies Market Share Analysis
- 11.4. List of Potential Customers
- 12. Research Methodology
List of Figures
- Figure 1: Global Engineering Services Outsourcing Industry Revenue Breakdown (Million, %) by Region 2025 & 2033
- Figure 2: Global Engineering Services Outsourcing Industry Volume Breakdown (Trillion, %) by Region 2025 & 2033
- Figure 3: North America Engineering Services Outsourcing Industry Revenue (Million), by Services 2025 & 2033
- Figure 4: North America Engineering Services Outsourcing Industry Volume (Trillion), by Services 2025 & 2033
- Figure 5: North America Engineering Services Outsourcing Industry Revenue Share (%), by Services 2025 & 2033
- Figure 6: North America Engineering Services Outsourcing Industry Volume Share (%), by Services 2025 & 2033
- Figure 7: North America Engineering Services Outsourcing Industry Revenue (Million), by End User 2025 & 2033
- Figure 8: North America Engineering Services Outsourcing Industry Volume (Trillion), by End User 2025 & 2033
- Figure 9: North America Engineering Services Outsourcing Industry Revenue Share (%), by End User 2025 & 2033
- Figure 10: North America Engineering Services Outsourcing Industry Volume Share (%), by End User 2025 & 2033
- Figure 11: North America Engineering Services Outsourcing Industry Revenue (Million), by Country 2025 & 2033
- Figure 12: North America Engineering Services Outsourcing Industry Volume (Trillion), by Country 2025 & 2033
- Figure 13: North America Engineering Services Outsourcing Industry Revenue Share (%), by Country 2025 & 2033
- Figure 14: North America Engineering Services Outsourcing Industry Volume Share (%), by Country 2025 & 2033
- Figure 15: Europe Engineering Services Outsourcing Industry Revenue (Million), by Services 2025 & 2033
- Figure 16: Europe Engineering Services Outsourcing Industry Volume (Trillion), by Services 2025 & 2033
- Figure 17: Europe Engineering Services Outsourcing Industry Revenue Share (%), by Services 2025 & 2033
- Figure 18: Europe Engineering Services Outsourcing Industry Volume Share (%), by Services 2025 & 2033
- Figure 19: Europe Engineering Services Outsourcing Industry Revenue (Million), by End User 2025 & 2033
- Figure 20: Europe Engineering Services Outsourcing Industry Volume (Trillion), by End User 2025 & 2033
- Figure 21: Europe Engineering Services Outsourcing Industry Revenue Share (%), by End User 2025 & 2033
- Figure 22: Europe Engineering Services Outsourcing Industry Volume Share (%), by End User 2025 & 2033
- Figure 23: Europe Engineering Services Outsourcing Industry Revenue (Million), by Country 2025 & 2033
- Figure 24: Europe Engineering Services Outsourcing Industry Volume (Trillion), by Country 2025 & 2033
- Figure 25: Europe Engineering Services Outsourcing Industry Revenue Share (%), by Country 2025 & 2033
- Figure 26: Europe Engineering Services Outsourcing Industry Volume Share (%), by Country 2025 & 2033
- Figure 27: Asia Pacific Engineering Services Outsourcing Industry Revenue (Million), by Services 2025 & 2033
- Figure 28: Asia Pacific Engineering Services Outsourcing Industry Volume (Trillion), by Services 2025 & 2033
- Figure 29: Asia Pacific Engineering Services Outsourcing Industry Revenue Share (%), by Services 2025 & 2033
- Figure 30: Asia Pacific Engineering Services Outsourcing Industry Volume Share (%), by Services 2025 & 2033
- Figure 31: Asia Pacific Engineering Services Outsourcing Industry Revenue (Million), by End User 2025 & 2033
- Figure 32: Asia Pacific Engineering Services Outsourcing Industry Volume (Trillion), by End User 2025 & 2033
- Figure 33: Asia Pacific Engineering Services Outsourcing Industry Revenue Share (%), by End User 2025 & 2033
- Figure 34: Asia Pacific Engineering Services Outsourcing Industry Volume Share (%), by End User 2025 & 2033
- Figure 35: Asia Pacific Engineering Services Outsourcing Industry Revenue (Million), by Country 2025 & 2033
- Figure 36: Asia Pacific Engineering Services Outsourcing Industry Volume (Trillion), by Country 2025 & 2033
- Figure 37: Asia Pacific Engineering Services Outsourcing Industry Revenue Share (%), by Country 2025 & 2033
- Figure 38: Asia Pacific Engineering Services Outsourcing Industry Volume Share (%), by Country 2025 & 2033
- Figure 39: Rest of the World Engineering Services Outsourcing Industry Revenue (Million), by Services 2025 & 2033
- Figure 40: Rest of the World Engineering Services Outsourcing Industry Volume (Trillion), by Services 2025 & 2033
- Figure 41: Rest of the World Engineering Services Outsourcing Industry Revenue Share (%), by Services 2025 & 2033
- Figure 42: Rest of the World Engineering Services Outsourcing Industry Volume Share (%), by Services 2025 & 2033
- Figure 43: Rest of the World Engineering Services Outsourcing Industry Revenue (Million), by End User 2025 & 2033
- Figure 44: Rest of the World Engineering Services Outsourcing Industry Volume (Trillion), by End User 2025 & 2033
- Figure 45: Rest of the World Engineering Services Outsourcing Industry Revenue Share (%), by End User 2025 & 2033
- Figure 46: Rest of the World Engineering Services Outsourcing Industry Volume Share (%), by End User 2025 & 2033
- Figure 47: Rest of the World Engineering Services Outsourcing Industry Revenue (Million), by Country 2025 & 2033
- Figure 48: Rest of the World Engineering Services Outsourcing Industry Volume (Trillion), by Country 2025 & 2033
- Figure 49: Rest of the World Engineering Services Outsourcing Industry Revenue Share (%), by Country 2025 & 2033
- Figure 50: Rest of the World Engineering Services Outsourcing Industry Volume Share (%), by Country 2025 & 2033
List of Tables
- Table 1: Global Engineering Services Outsourcing Industry Revenue Million Forecast, by Services 2020 & 2033
- Table 2: Global Engineering Services Outsourcing Industry Volume Trillion Forecast, by Services 2020 & 2033
- Table 3: Global Engineering Services Outsourcing Industry Revenue Million Forecast, by End User 2020 & 2033
- Table 4: Global Engineering Services Outsourcing Industry Volume Trillion Forecast, by End User 2020 & 2033
- Table 5: Global Engineering Services Outsourcing Industry Revenue Million Forecast, by Region 2020 & 2033
- Table 6: Global Engineering Services Outsourcing Industry Volume Trillion Forecast, by Region 2020 & 2033
- Table 7: Global Engineering Services Outsourcing Industry Revenue Million Forecast, by Services 2020 & 2033
- Table 8: Global Engineering Services Outsourcing Industry Volume Trillion Forecast, by Services 2020 & 2033
- Table 9: Global Engineering Services Outsourcing Industry Revenue Million Forecast, by End User 2020 & 2033
- Table 10: Global Engineering Services Outsourcing Industry Volume Trillion Forecast, by End User 2020 & 2033
- Table 11: Global Engineering Services Outsourcing Industry Revenue Million Forecast, by Country 2020 & 2033
- Table 12: Global Engineering Services Outsourcing Industry Volume Trillion Forecast, by Country 2020 & 2033
- Table 13: United States Engineering Services Outsourcing Industry Revenue (Million) Forecast, by Application 2020 & 2033
- Table 14: United States Engineering Services Outsourcing Industry Volume (Trillion) Forecast, by Application 2020 & 2033
- Table 15: Canada Engineering Services Outsourcing Industry Revenue (Million) Forecast, by Application 2020 & 2033
- Table 16: Canada Engineering Services Outsourcing Industry Volume (Trillion) Forecast, by Application 2020 & 2033
- Table 17: Mexico Engineering Services Outsourcing Industry Revenue (Million) Forecast, by Application 2020 & 2033
- Table 18: Mexico Engineering Services Outsourcing Industry Volume (Trillion) Forecast, by Application 2020 & 2033
- Table 19: Global Engineering Services Outsourcing Industry Revenue Million Forecast, by Services 2020 & 2033
- Table 20: Global Engineering Services Outsourcing Industry Volume Trillion Forecast, by Services 2020 & 2033
- Table 21: Global Engineering Services Outsourcing Industry Revenue Million Forecast, by End User 2020 & 2033
- Table 22: Global Engineering Services Outsourcing Industry Volume Trillion Forecast, by End User 2020 & 2033
- Table 23: Global Engineering Services Outsourcing Industry Revenue Million Forecast, by Country 2020 & 2033
- Table 24: Global Engineering Services Outsourcing Industry Volume Trillion Forecast, by Country 2020 & 2033
- Table 25: United Kingdom Engineering Services Outsourcing Industry Revenue (Million) Forecast, by Application 2020 & 2033
- Table 26: United Kingdom Engineering Services Outsourcing Industry Volume (Trillion) Forecast, by Application 2020 & 2033
- Table 27: Germany Engineering Services Outsourcing Industry Revenue (Million) Forecast, by Application 2020 & 2033
- Table 28: Germany Engineering Services Outsourcing Industry Volume (Trillion) Forecast, by Application 2020 & 2033
- Table 29: France Engineering Services Outsourcing Industry Revenue (Million) Forecast, by Application 2020 & 2033
- Table 30: France Engineering Services Outsourcing Industry Volume (Trillion) Forecast, by Application 2020 & 2033
- Table 31: Italy Engineering Services Outsourcing Industry Revenue (Million) Forecast, by Application 2020 & 2033
- Table 32: Italy Engineering Services Outsourcing Industry Volume (Trillion) Forecast, by Application 2020 & 2033
- Table 33: Spain Engineering Services Outsourcing Industry Revenue (Million) Forecast, by Application 2020 & 2033
- Table 34: Spain Engineering Services Outsourcing Industry Volume (Trillion) Forecast, by Application 2020 & 2033
- Table 35: Rest of Europe Engineering Services Outsourcing Industry Revenue (Million) Forecast, by Application 2020 & 2033
- Table 36: Rest of Europe Engineering Services Outsourcing Industry Volume (Trillion) Forecast, by Application 2020 & 2033
- Table 37: Global Engineering Services Outsourcing Industry Revenue Million Forecast, by Services 2020 & 2033
- Table 38: Global Engineering Services Outsourcing Industry Volume Trillion Forecast, by Services 2020 & 2033
- Table 39: Global Engineering Services Outsourcing Industry Revenue Million Forecast, by End User 2020 & 2033
- Table 40: Global Engineering Services Outsourcing Industry Volume Trillion Forecast, by End User 2020 & 2033
- Table 41: Global Engineering Services Outsourcing Industry Revenue Million Forecast, by Country 2020 & 2033
- Table 42: Global Engineering Services Outsourcing Industry Volume Trillion Forecast, by Country 2020 & 2033
- Table 43: China Engineering Services Outsourcing Industry Revenue (Million) Forecast, by Application 2020 & 2033
- Table 44: China Engineering Services Outsourcing Industry Volume (Trillion) Forecast, by Application 2020 & 2033
- Table 45: India Engineering Services Outsourcing Industry Revenue (Million) Forecast, by Application 2020 & 2033
- Table 46: India Engineering Services Outsourcing Industry Volume (Trillion) Forecast, by Application 2020 & 2033
- Table 47: Japan Engineering Services Outsourcing Industry Revenue (Million) Forecast, by Application 2020 & 2033
- Table 48: Japan Engineering Services Outsourcing Industry Volume (Trillion) Forecast, by Application 2020 & 2033
- Table 49: South Korea Engineering Services Outsourcing Industry Revenue (Million) Forecast, by Application 2020 & 2033
- Table 50: South Korea Engineering Services Outsourcing Industry Volume (Trillion) Forecast, by Application 2020 & 2033
- Table 51: Thailand Engineering Services Outsourcing Industry Revenue (Million) Forecast, by Application 2020 & 2033
- Table 52: Thailand Engineering Services Outsourcing Industry Volume (Trillion) Forecast, by Application 2020 & 2033
- Table 53: Indonesia Engineering Services Outsourcing Industry Revenue (Million) Forecast, by Application 2020 & 2033
- Table 54: Indonesia Engineering Services Outsourcing Industry Volume (Trillion) Forecast, by Application 2020 & 2033
- Table 55: Rest of Asia pacific Engineering Services Outsourcing Industry Revenue (Million) Forecast, by Application 2020 & 2033
- Table 56: Rest of Asia pacific Engineering Services Outsourcing Industry Volume (Trillion) Forecast, by Application 2020 & 2033
- Table 57: Global Engineering Services Outsourcing Industry Revenue Million Forecast, by Services 2020 & 2033
- Table 58: Global Engineering Services Outsourcing Industry Volume Trillion Forecast, by Services 2020 & 2033
- Table 59: Global Engineering Services Outsourcing Industry Revenue Million Forecast, by End User 2020 & 2033
- Table 60: Global Engineering Services Outsourcing Industry Volume Trillion Forecast, by End User 2020 & 2033
- Table 61: Global Engineering Services Outsourcing Industry Revenue Million Forecast, by Country 2020 & 2033
- Table 62: Global Engineering Services Outsourcing Industry Volume Trillion Forecast, by Country 2020 & 2033
Frequently Asked Questions
1. What is the projected Compound Annual Growth Rate (CAGR) of the Engineering Services Outsourcing Industry?
The projected CAGR is approximately 12.89%.
2. Which companies are prominent players in the Engineering Services Outsourcing Industry?
Key companies in the market include Tech Mahindra Limited, Tata Consultancy Services Limited, Infosys Limited, HCL Technologies Limited, Wipro Ltd, Capgemini Technology Services India Limited, Globallogic Inc, Accenture, RLE International Inc, ASAP Holding GmbH, Tata Technologies**List Not Exhaustive.
3. What are the main segments of the Engineering Services Outsourcing Industry?
The market segments include Services, End User.
4. Can you provide details about the market size?
The market size is estimated to be USD 2.91 Million as of 2022.
5. What are some drivers contributing to market growth?
N/A
6. What are the notable trends driving market growth?
Rising Adoption of Integrated Solutions Driving the Growth of the Market.
7. Are there any restraints impacting market growth?
N/A
8. Can you provide examples of recent developments in the market?
April 2023: The relationship between Marks and Spencer PLC (M&S) and Tata Consultancy Services (TCS) has been extended to change M&S's core technology stack, increase innovation speed and resilience, and promote sustainable growth. The modernization program will enhance speed to market, lower technological debt, and boost operating model efficiency and effectiveness for M&S. M&S' strategic aims of providing better customer experience, driving online growth, leading in omnichannel and sustainability, modernizing its supply chain, increasing its worldwide reach will be expedited by the transformation into a simple, agile, data-led business.
9. What pricing options are available for accessing the report?
Pricing options include single-user, multi-user, and enterprise licenses priced at USD 4750, USD 5250, and USD 8750 respectively.
10. Is the market size provided in terms of value or volume?
The market size is provided in terms of value, measured in Million and volume, measured in Trillion.
11. Are there any specific market keywords associated with the report?
Yes, the market keyword associated with the report is "Engineering Services Outsourcing Industry," which aids in identifying and referencing the specific market segment covered.
12. How do I determine which pricing option suits my needs best?
The pricing options vary based on user requirements and access needs. Individual users may opt for single-user licenses, while businesses requiring broader access may choose multi-user or enterprise licenses for cost-effective access to the report.
13. Are there any additional resources or data provided in the Engineering Services Outsourcing Industry report?
While the report offers comprehensive insights, it's advisable to review the specific contents or supplementary materials provided to ascertain if additional resources or data are available.
14. How can I stay updated on further developments or reports in the Engineering Services Outsourcing Industry?
To stay informed about further developments, trends, and reports in the Engineering Services Outsourcing Industry, consider subscribing to industry newsletters, following relevant companies and organizations, or regularly checking reputable industry news sources and publications.
Methodology
Step 1 - Identification of Relevant Samples Size from Population Database


Step 2 - Approaches for Defining Global Market Size (Value, Volume* & Price*)

Note*: In applicable scenarios
Step 3 - Data Sources
Primary Research
- Web Analytics
- Survey Reports
- Research Institute
- Latest Research Reports
- Opinion Leaders
Secondary Research
- Annual Reports
- White Paper
- Latest Press Release
- Industry Association
- Paid Database
- Investor Presentations

Step 4 - Data Triangulation
Involves using different sources of information in order to increase the validity of a study
These sources are likely to be stakeholders in a program - participants, other researchers, program staff, other community members, and so on.
Then we put all data in single framework & apply various statistical tools to find out the dynamic on the market.
During the analysis stage, feedback from the stakeholder groups would be compared to determine areas of agreement as well as areas of divergence