

Key Insights
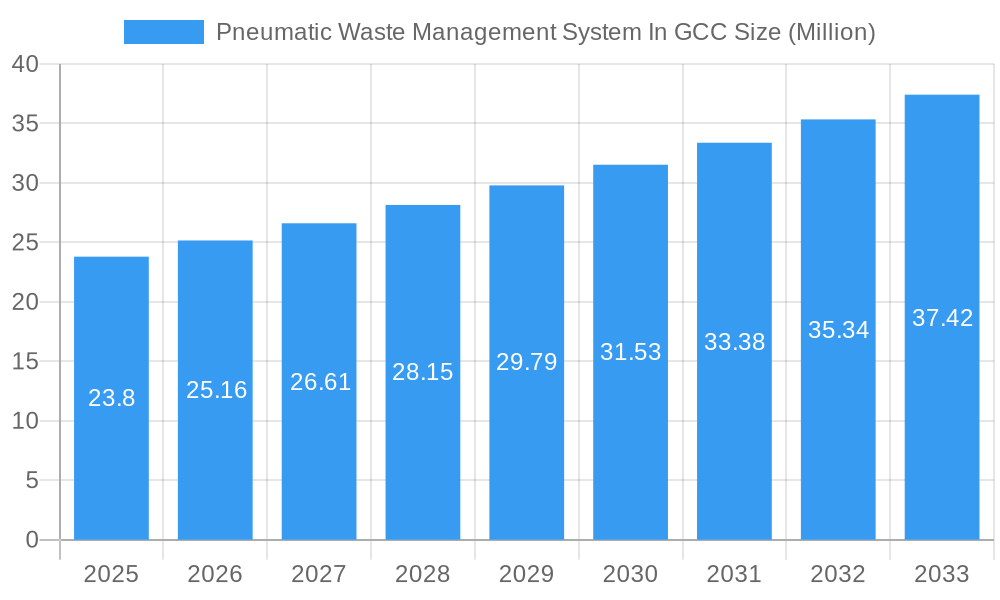
The Pneumatic Waste Management System (PWMS) market in the Gulf Cooperation Council (GCC) is experiencing robust growth, projected to reach \$23.80 million in 2025 and maintain a Compound Annual Growth Rate (CAGR) of 5.47% from 2025 to 2033. This expansion is driven by several factors. Increasing urbanization and population density within the GCC necessitate efficient and hygienic waste disposal solutions. PWMS offers a significant advantage by minimizing manual handling, reducing labor costs, and improving overall sanitation. Furthermore, the region's commitment to sustainable waste management practices and environmental protection fuels adoption of advanced technologies like PWMS, which reduces reliance on traditional, less efficient methods. Key players like Marimatic, ENVAC, and URD are capitalizing on these trends, contributing to market competitiveness and driving innovation. However, high initial investment costs and the need for specialized infrastructure might pose challenges to widespread adoption. Future growth will likely depend on government initiatives promoting sustainable infrastructure development and public-private partnerships that encourage investment in advanced waste management solutions. The segmentation of the market based on system type (e.g., centralized vs. decentralized), application (residential, commercial, industrial), and geographical distribution (specific GCC countries) will offer valuable insights into potential growth opportunities within the region.
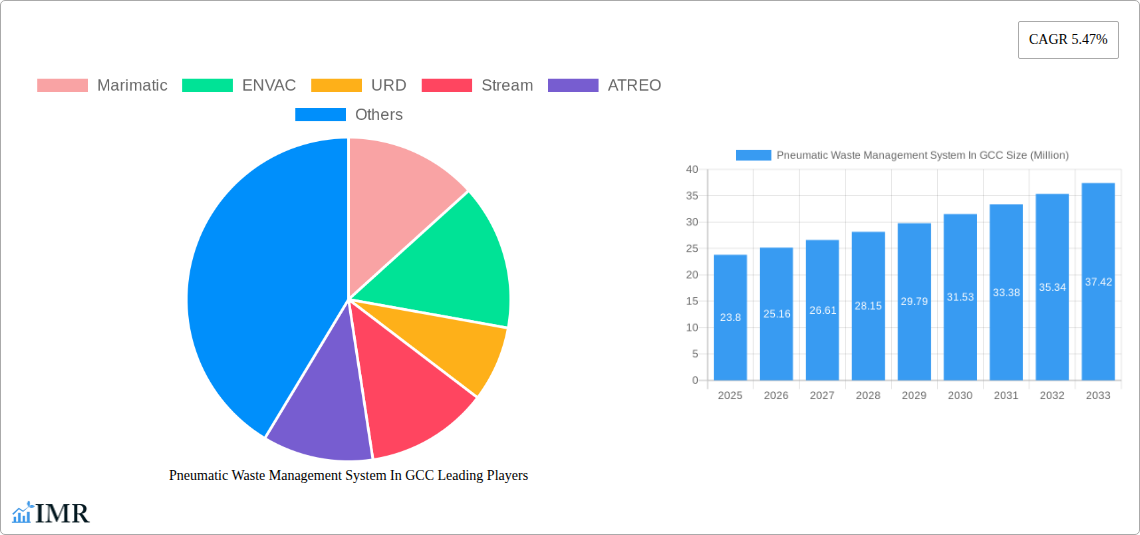
Pneumatic Waste Management System In GCC Market Size (In Million)
The competitive landscape is relatively fragmented, with several established players and smaller emerging companies vying for market share. The success of individual companies will largely depend on their ability to adapt to evolving technological advancements, offer competitive pricing strategies, and deliver reliable, high-quality PWMS solutions tailored to the specific needs of the GCC market. Ongoing research and development focusing on energy efficiency, system scalability, and integration with smart city initiatives are crucial for sustained growth in the coming years. The market is also likely to see increased consolidation as larger players acquire smaller companies to expand their market presence and service capabilities. This period of growth offers significant opportunities for both established and emerging players to tap into the growing demand for efficient and sustainable waste management solutions within the GCC.
Pneumatic Waste Management System In GCC Company Market Share
Pneumatic Waste Management System in GCC: A Comprehensive Market Report (2019-2033)
This in-depth report provides a comprehensive analysis of the Pneumatic Waste Management System market in the Gulf Cooperation Council (GCC) region, offering invaluable insights for industry professionals, investors, and strategic decision-makers. The report covers the period 2019-2033, with a focus on the forecast period 2025-2033, and a base year of 2025. The market is segmented by various factors, and key players like Marimatic, ENVAC, URD, Stream, ATREO, Ros Roca envirotec, Peakway Environmental Sci & Tech Co Ltd, Aerbin ApS, Urban Refuse Development, and Logiwaste AB are profiled. The total market size is projected to reach xx Million by 2033.
Pneumatic Waste Management System In GCC Market Dynamics & Structure
This section analyzes the GCC's pneumatic waste management system market structure, exploring market concentration, technological advancements, regulatory landscapes, competitive dynamics, and end-user demographics. We delve into M&A activities within the sector, providing both quantitative and qualitative data.
- Market Concentration: The market is characterized by a [Describe Market Concentration - e.g., moderately concentrated] structure, with the top 5 players holding an estimated xx% market share in 2025.
- Technological Innovation: Technological drivers such as automation, AI-powered sorting, and improved system efficiency are shaping the market. However, high initial investment costs represent a significant barrier to entry.
- Regulatory Landscape: GCC governments are increasingly implementing stricter regulations on waste management, driving demand for advanced pneumatic systems. The specific regulations vary across countries, creating both opportunities and challenges.
- Competitive Landscape: Competition is primarily driven by innovation, service offerings, and cost-effectiveness. The emergence of new players and technological advancements is intensifying competition.
- M&A Activity: The number of M&A deals in the GCC pneumatic waste management sector totaled xx in the historical period (2019-2024), with an average deal value of xx Million. This activity is expected to increase due to [State reasons - e.g., consolidation and expansion].
- End-User Demographics: The key end-users are municipalities, commercial establishments, and industrial facilities. Growth is particularly strong in rapidly urbanizing areas.
Pneumatic Waste Management System In GCC Growth Trends & Insights
This section analyzes the historical and projected growth trajectory of the GCC pneumatic waste management system market, focusing on factors driving market expansion and adoption rates. We also explore the impact of technological disruptions and evolving consumer behavior.
[Insert 600 words of analysis here using XXX data and focusing on market size evolution, adoption rates, technological disruptions, and consumer behavior shifts. Include specific metrics (e.g., CAGR, market penetration) for deeper insights.] This section should cover the market's CAGR during the historical and forecast periods, detailing the factors influencing the growth rate. It should also consider the impact of technological advancements, changing consumer preferences regarding waste management, and government initiatives promoting sustainable practices.
Dominant Regions, Countries, or Segments in Pneumatic Waste Management System In GCC
This section identifies the leading regions, countries, or segments within the GCC driving market growth. We examine the factors contributing to their dominance, including economic policies, infrastructure development, and market share.
[Insert 600 words of analysis here using bullet points to highlight key drivers and paragraphs to analyze dominance factors. Include market share and growth potential data for each region/country/segment. Consider factors like population density, economic growth, government regulations, and the availability of infrastructure.]
Pneumatic Waste Management System In GCC Product Landscape
The GCC pneumatic waste management system market showcases a range of products varying in size, capacity, and technological sophistication. These systems are designed for diverse applications, from residential complexes to large-scale industrial sites. Key performance indicators include efficiency, reliability, and environmental impact. Recent product innovations focus on improved automation, data analytics integration, and energy efficiency to optimize waste collection and processing. The unique selling propositions emphasize ease of use, reduced operational costs, and environmentally conscious practices.
Key Drivers, Barriers & Challenges in Pneumatic Waste Management System In GCC
Key Drivers:
- Growing urbanization and increasing waste generation
- Stringent environmental regulations and sustainability initiatives
- Technological advancements leading to improved system efficiency and cost-effectiveness.
- Government investments in infrastructure development.
Challenges & Restraints:
- High initial investment costs for pneumatic waste management systems.
- Lack of awareness regarding the benefits of pneumatic waste management among some stakeholders.
- Potential supply chain disruptions affecting the availability of components.
- Regulatory hurdles and bureaucratic processes in obtaining necessary permits and approvals.
- Competition from alternative waste management technologies.
Emerging Opportunities in Pneumatic Waste Management System In GCC
Emerging opportunities include expanding into untapped markets, particularly in smaller cities and towns. Innovative applications such as integrating smart sensors and AI for optimized waste collection and route planning present significant potential. Evolving consumer preferences toward sustainable waste management practices are driving demand for eco-friendly solutions.
Growth Accelerators in the Pneumatic Waste Management System In GCC Industry
Technological breakthroughs in automation, sensor technology, and data analytics are significant growth accelerators. Strategic partnerships between system providers and municipalities or private sector companies are fostering wider adoption. Market expansion strategies targeting underserved areas and exploring new applications, such as medical waste management, are key to sustaining long-term growth.
Key Players Shaping the Pneumatic Waste Management System In GCC Market
- Marimatic
- ENVAC
- URD
- Stream
- ATREO
- Ros Roca envirotec
- Peakway Environmental Sci & Tech Co Ltd
- Aerbin ApS
- Urban Refuse Development
- Logiwaste AB
- 73 Other Companies
Notable Milestones in Pneumatic Waste Management System In GCC Sector
- August 2023: Akam (SIRC Group subsidiary) partners with Alawalya Qatar to improve demolition and construction waste sorting, promoting recycled material reuse in Qatar and setting new standards.
- May 2023: EnviroServe opens a new facility in Richmond, Virginia, expanding its North American operations and waste management capabilities.
In-Depth Pneumatic Waste Management System In GCC Market Outlook
The GCC pneumatic waste management system market is poised for significant growth driven by increasing urbanization, stricter environmental regulations, and technological advancements. Strategic partnerships and market expansion initiatives will play a crucial role in unlocking the market's full potential. The market is expected to witness continued innovation and diversification of product offerings to meet the evolving needs of various end-users. Investment in research and development will further enhance system efficiency and sustainability, driving long-term growth and creating substantial opportunities for stakeholders.
Pneumatic Waste Management System In GCC Segmentation
-
1. End User
- 1.1. Residential
- 1.2. Commercial
- 1.3. Industrial
- 1.4. Other End Users
Pneumatic Waste Management System In GCC Segmentation By Geography
-
1. North America
- 1.1. United States
- 1.2. Canada
- 1.3. Mexico
-
2. South America
- 2.1. Brazil
- 2.2. Argentina
- 2.3. Rest of South America
-
3. Europe
- 3.1. United Kingdom
- 3.2. Germany
- 3.3. France
- 3.4. Italy
- 3.5. Spain
- 3.6. Russia
- 3.7. Benelux
- 3.8. Nordics
- 3.9. Rest of Europe
-
4. Middle East & Africa
- 4.1. Turkey
- 4.2. Israel
- 4.3. GCC
- 4.4. North Africa
- 4.5. South Africa
- 4.6. Rest of Middle East & Africa
-
5. Asia Pacific
- 5.1. China
- 5.2. India
- 5.3. Japan
- 5.4. South Korea
- 5.5. ASEAN
- 5.6. Oceania
- 5.7. Rest of Asia Pacific
Pneumatic Waste Management System In GCC Regional Market Share
Geographic Coverage of Pneumatic Waste Management System In GCC
Pneumatic Waste Management System In GCC REPORT HIGHLIGHTS
| Aspects | Details |
|---|---|
| Study Period | 2020-2034 |
| Base Year | 2025 |
| Estimated Year | 2026 |
| Forecast Period | 2026-2034 |
| Historical Period | 2020-2025 |
| Growth Rate | CAGR of 5.47% from 2020-2034 |
| Segmentation |
|
Table of Contents
- 1. Introduction
- 1.1. Research Scope
- 1.2. Market Segmentation
- 1.3. Research Objective
- 1.4. Definitions and Assumptions
- 2. Executive Summary
- 2.1. Market Snapshot
- 3. Market Dynamics
- 3.1. Market Drivers
- 3.2. Market Restrains
- 3.3. Market Trends
- 3.4. Market Opportunities
- 4. Market Factor Analysis
- 4.1. Porters Five Forces
- 4.1.1. Bargaining Power of Suppliers
- 4.1.2. Bargaining Power of Buyers
- 4.1.3. Threat of New Entrants
- 4.1.4. Threat of Substitutes
- 4.1.5. Competitive Rivalry
- 4.2. PESTEL analysis
- 4.3. BCG Analysis
- 4.3.1. Stars (High Growth, High Market Share)
- 4.3.2. Cash Cows (Low Growth, High Market Share)
- 4.3.3. Question Mark (High Growth, Low Market Share)
- 4.3.4. Dogs (Low Growth, Low Market Share)
- 4.4. Ansoff Matrix Analysis
- 4.5. Supply Chain Analysis
- 4.6. Regulatory Landscape
- 4.7. Current Market Potential and Opportunity Assessment (TAM–SAM–SOM Framework)
- 4.8. IMR Analyst Note
- 4.1. Porters Five Forces
- 5. Market Analysis, Insights and Forecast 2021-2033
- 5.1. Market Analysis, Insights and Forecast - by End User
- 5.1.1. Residential
- 5.1.2. Commercial
- 5.1.3. Industrial
- 5.1.4. Other End Users
- 5.2. Market Analysis, Insights and Forecast - by Region
- 5.2.1. North America
- 5.2.2. South America
- 5.2.3. Europe
- 5.2.4. Middle East & Africa
- 5.2.5. Asia Pacific
- 5.1. Market Analysis, Insights and Forecast - by End User
- 6. Global Pneumatic Waste Management System In GCC Analysis, Insights and Forecast, 2021-2033
- 6.1. Market Analysis, Insights and Forecast - by End User
- 6.1.1. Residential
- 6.1.2. Commercial
- 6.1.3. Industrial
- 6.1.4. Other End Users
- 6.1. Market Analysis, Insights and Forecast - by End User
- 7. North America Pneumatic Waste Management System In GCC Analysis, Insights and Forecast, 2020-2032
- 7.1. Market Analysis, Insights and Forecast - by End User
- 7.1.1. Residential
- 7.1.2. Commercial
- 7.1.3. Industrial
- 7.1.4. Other End Users
- 7.1. Market Analysis, Insights and Forecast - by End User
- 8. South America Pneumatic Waste Management System In GCC Analysis, Insights and Forecast, 2020-2032
- 8.1. Market Analysis, Insights and Forecast - by End User
- 8.1.1. Residential
- 8.1.2. Commercial
- 8.1.3. Industrial
- 8.1.4. Other End Users
- 8.1. Market Analysis, Insights and Forecast - by End User
- 9. Europe Pneumatic Waste Management System In GCC Analysis, Insights and Forecast, 2020-2032
- 9.1. Market Analysis, Insights and Forecast - by End User
- 9.1.1. Residential
- 9.1.2. Commercial
- 9.1.3. Industrial
- 9.1.4. Other End Users
- 9.1. Market Analysis, Insights and Forecast - by End User
- 10. Middle East & Africa Pneumatic Waste Management System In GCC Analysis, Insights and Forecast, 2020-2032
- 10.1. Market Analysis, Insights and Forecast - by End User
- 10.1.1. Residential
- 10.1.2. Commercial
- 10.1.3. Industrial
- 10.1.4. Other End Users
- 10.1. Market Analysis, Insights and Forecast - by End User
- 11. Asia Pacific Pneumatic Waste Management System In GCC Analysis, Insights and Forecast, 2020-2032
- 11.1. Market Analysis, Insights and Forecast - by End User
- 11.1.1. Residential
- 11.1.2. Commercial
- 11.1.3. Industrial
- 11.1.4. Other End Users
- 11.1. Market Analysis, Insights and Forecast - by End User
- 12. Competitive Analysis
- 12.1. Company Profiles
- 12.1.1 Marimatic
- 12.1.1.1. Company Overview
- 12.1.1.2. Products
- 12.1.1.3. Company Financials
- 12.1.1.4. SWOT Analysis
- 12.1.2 ENVAC
- 12.1.2.1. Company Overview
- 12.1.2.2. Products
- 12.1.2.3. Company Financials
- 12.1.2.4. SWOT Analysis
- 12.1.3 URD
- 12.1.3.1. Company Overview
- 12.1.3.2. Products
- 12.1.3.3. Company Financials
- 12.1.3.4. SWOT Analysis
- 12.1.4 Stream
- 12.1.4.1. Company Overview
- 12.1.4.2. Products
- 12.1.4.3. Company Financials
- 12.1.4.4. SWOT Analysis
- 12.1.5 ATREO
- 12.1.5.1. Company Overview
- 12.1.5.2. Products
- 12.1.5.3. Company Financials
- 12.1.5.4. SWOT Analysis
- 12.1.6 Ros Roca envirotec
- 12.1.6.1. Company Overview
- 12.1.6.2. Products
- 12.1.6.3. Company Financials
- 12.1.6.4. SWOT Analysis
- 12.1.7 Peakway Environmental Sci & Tech Co Ltd
- 12.1.7.1. Company Overview
- 12.1.7.2. Products
- 12.1.7.3. Company Financials
- 12.1.7.4. SWOT Analysis
- 12.1.8 Aerbin ApS
- 12.1.8.1. Company Overview
- 12.1.8.2. Products
- 12.1.8.3. Company Financials
- 12.1.8.4. SWOT Analysis
- 12.1.9 Urban Refuse Development
- 12.1.9.1. Company Overview
- 12.1.9.2. Products
- 12.1.9.3. Company Financials
- 12.1.9.4. SWOT Analysis
- 12.1.10 Logiwaste AB**List Not Exhaustive 7 3 Other Companie
- 12.1.10.1. Company Overview
- 12.1.10.2. Products
- 12.1.10.3. Company Financials
- 12.1.10.4. SWOT Analysis
- 12.1.1 Marimatic
- 12.2. Market Entropy
- 12.2.1 Company's Key Areas Served
- 12.2.2 Recent Developments
- 12.3. Company Market Share Analysis 2025
- 12.3.1 Top 5 Companies Market Share Analysis
- 12.3.2 Top 3 Companies Market Share Analysis
- 12.4. List of Potential Customers
- 13. Research Methodology
List of Figures
- Figure 1: Global Pneumatic Waste Management System In GCC Revenue Breakdown (Million, %) by Region 2025 & 2033
- Figure 2: Global Pneumatic Waste Management System In GCC Volume Breakdown (Million, %) by Region 2025 & 2033
- Figure 3: North America Pneumatic Waste Management System In GCC Revenue (Million), by End User 2025 & 2033
- Figure 4: North America Pneumatic Waste Management System In GCC Volume (Million), by End User 2025 & 2033
- Figure 5: North America Pneumatic Waste Management System In GCC Revenue Share (%), by End User 2025 & 2033
- Figure 6: North America Pneumatic Waste Management System In GCC Volume Share (%), by End User 2025 & 2033
- Figure 7: North America Pneumatic Waste Management System In GCC Revenue (Million), by Country 2025 & 2033
- Figure 8: North America Pneumatic Waste Management System In GCC Volume (Million), by Country 2025 & 2033
- Figure 9: North America Pneumatic Waste Management System In GCC Revenue Share (%), by Country 2025 & 2033
- Figure 10: North America Pneumatic Waste Management System In GCC Volume Share (%), by Country 2025 & 2033
- Figure 11: South America Pneumatic Waste Management System In GCC Revenue (Million), by End User 2025 & 2033
- Figure 12: South America Pneumatic Waste Management System In GCC Volume (Million), by End User 2025 & 2033
- Figure 13: South America Pneumatic Waste Management System In GCC Revenue Share (%), by End User 2025 & 2033
- Figure 14: South America Pneumatic Waste Management System In GCC Volume Share (%), by End User 2025 & 2033
- Figure 15: South America Pneumatic Waste Management System In GCC Revenue (Million), by Country 2025 & 2033
- Figure 16: South America Pneumatic Waste Management System In GCC Volume (Million), by Country 2025 & 2033
- Figure 17: South America Pneumatic Waste Management System In GCC Revenue Share (%), by Country 2025 & 2033
- Figure 18: South America Pneumatic Waste Management System In GCC Volume Share (%), by Country 2025 & 2033
- Figure 19: Europe Pneumatic Waste Management System In GCC Revenue (Million), by End User 2025 & 2033
- Figure 20: Europe Pneumatic Waste Management System In GCC Volume (Million), by End User 2025 & 2033
- Figure 21: Europe Pneumatic Waste Management System In GCC Revenue Share (%), by End User 2025 & 2033
- Figure 22: Europe Pneumatic Waste Management System In GCC Volume Share (%), by End User 2025 & 2033
- Figure 23: Europe Pneumatic Waste Management System In GCC Revenue (Million), by Country 2025 & 2033
- Figure 24: Europe Pneumatic Waste Management System In GCC Volume (Million), by Country 2025 & 2033
- Figure 25: Europe Pneumatic Waste Management System In GCC Revenue Share (%), by Country 2025 & 2033
- Figure 26: Europe Pneumatic Waste Management System In GCC Volume Share (%), by Country 2025 & 2033
- Figure 27: Middle East & Africa Pneumatic Waste Management System In GCC Revenue (Million), by End User 2025 & 2033
- Figure 28: Middle East & Africa Pneumatic Waste Management System In GCC Volume (Million), by End User 2025 & 2033
- Figure 29: Middle East & Africa Pneumatic Waste Management System In GCC Revenue Share (%), by End User 2025 & 2033
- Figure 30: Middle East & Africa Pneumatic Waste Management System In GCC Volume Share (%), by End User 2025 & 2033
- Figure 31: Middle East & Africa Pneumatic Waste Management System In GCC Revenue (Million), by Country 2025 & 2033
- Figure 32: Middle East & Africa Pneumatic Waste Management System In GCC Volume (Million), by Country 2025 & 2033
- Figure 33: Middle East & Africa Pneumatic Waste Management System In GCC Revenue Share (%), by Country 2025 & 2033
- Figure 34: Middle East & Africa Pneumatic Waste Management System In GCC Volume Share (%), by Country 2025 & 2033
- Figure 35: Asia Pacific Pneumatic Waste Management System In GCC Revenue (Million), by End User 2025 & 2033
- Figure 36: Asia Pacific Pneumatic Waste Management System In GCC Volume (Million), by End User 2025 & 2033
- Figure 37: Asia Pacific Pneumatic Waste Management System In GCC Revenue Share (%), by End User 2025 & 2033
- Figure 38: Asia Pacific Pneumatic Waste Management System In GCC Volume Share (%), by End User 2025 & 2033
- Figure 39: Asia Pacific Pneumatic Waste Management System In GCC Revenue (Million), by Country 2025 & 2033
- Figure 40: Asia Pacific Pneumatic Waste Management System In GCC Volume (Million), by Country 2025 & 2033
- Figure 41: Asia Pacific Pneumatic Waste Management System In GCC Revenue Share (%), by Country 2025 & 2033
- Figure 42: Asia Pacific Pneumatic Waste Management System In GCC Volume Share (%), by Country 2025 & 2033
List of Tables
- Table 1: Global Pneumatic Waste Management System In GCC Revenue Million Forecast, by End User 2020 & 2033
- Table 2: Global Pneumatic Waste Management System In GCC Volume Million Forecast, by End User 2020 & 2033
- Table 3: Global Pneumatic Waste Management System In GCC Revenue Million Forecast, by Region 2020 & 2033
- Table 4: Global Pneumatic Waste Management System In GCC Volume Million Forecast, by Region 2020 & 2033
- Table 5: Global Pneumatic Waste Management System In GCC Revenue Million Forecast, by End User 2020 & 2033
- Table 6: Global Pneumatic Waste Management System In GCC Volume Million Forecast, by End User 2020 & 2033
- Table 7: Global Pneumatic Waste Management System In GCC Revenue Million Forecast, by Country 2020 & 2033
- Table 8: Global Pneumatic Waste Management System In GCC Volume Million Forecast, by Country 2020 & 2033
- Table 9: United States Pneumatic Waste Management System In GCC Revenue (Million) Forecast, by Application 2020 & 2033
- Table 10: United States Pneumatic Waste Management System In GCC Volume (Million) Forecast, by Application 2020 & 2033
- Table 11: Canada Pneumatic Waste Management System In GCC Revenue (Million) Forecast, by Application 2020 & 2033
- Table 12: Canada Pneumatic Waste Management System In GCC Volume (Million) Forecast, by Application 2020 & 2033
- Table 13: Mexico Pneumatic Waste Management System In GCC Revenue (Million) Forecast, by Application 2020 & 2033
- Table 14: Mexico Pneumatic Waste Management System In GCC Volume (Million) Forecast, by Application 2020 & 2033
- Table 15: Global Pneumatic Waste Management System In GCC Revenue Million Forecast, by End User 2020 & 2033
- Table 16: Global Pneumatic Waste Management System In GCC Volume Million Forecast, by End User 2020 & 2033
- Table 17: Global Pneumatic Waste Management System In GCC Revenue Million Forecast, by Country 2020 & 2033
- Table 18: Global Pneumatic Waste Management System In GCC Volume Million Forecast, by Country 2020 & 2033
- Table 19: Brazil Pneumatic Waste Management System In GCC Revenue (Million) Forecast, by Application 2020 & 2033
- Table 20: Brazil Pneumatic Waste Management System In GCC Volume (Million) Forecast, by Application 2020 & 2033
- Table 21: Argentina Pneumatic Waste Management System In GCC Revenue (Million) Forecast, by Application 2020 & 2033
- Table 22: Argentina Pneumatic Waste Management System In GCC Volume (Million) Forecast, by Application 2020 & 2033
- Table 23: Rest of South America Pneumatic Waste Management System In GCC Revenue (Million) Forecast, by Application 2020 & 2033
- Table 24: Rest of South America Pneumatic Waste Management System In GCC Volume (Million) Forecast, by Application 2020 & 2033
- Table 25: Global Pneumatic Waste Management System In GCC Revenue Million Forecast, by End User 2020 & 2033
- Table 26: Global Pneumatic Waste Management System In GCC Volume Million Forecast, by End User 2020 & 2033
- Table 27: Global Pneumatic Waste Management System In GCC Revenue Million Forecast, by Country 2020 & 2033
- Table 28: Global Pneumatic Waste Management System In GCC Volume Million Forecast, by Country 2020 & 2033
- Table 29: United Kingdom Pneumatic Waste Management System In GCC Revenue (Million) Forecast, by Application 2020 & 2033
- Table 30: United Kingdom Pneumatic Waste Management System In GCC Volume (Million) Forecast, by Application 2020 & 2033
- Table 31: Germany Pneumatic Waste Management System In GCC Revenue (Million) Forecast, by Application 2020 & 2033
- Table 32: Germany Pneumatic Waste Management System In GCC Volume (Million) Forecast, by Application 2020 & 2033
- Table 33: France Pneumatic Waste Management System In GCC Revenue (Million) Forecast, by Application 2020 & 2033
- Table 34: France Pneumatic Waste Management System In GCC Volume (Million) Forecast, by Application 2020 & 2033
- Table 35: Italy Pneumatic Waste Management System In GCC Revenue (Million) Forecast, by Application 2020 & 2033
- Table 36: Italy Pneumatic Waste Management System In GCC Volume (Million) Forecast, by Application 2020 & 2033
- Table 37: Spain Pneumatic Waste Management System In GCC Revenue (Million) Forecast, by Application 2020 & 2033
- Table 38: Spain Pneumatic Waste Management System In GCC Volume (Million) Forecast, by Application 2020 & 2033
- Table 39: Russia Pneumatic Waste Management System In GCC Revenue (Million) Forecast, by Application 2020 & 2033
- Table 40: Russia Pneumatic Waste Management System In GCC Volume (Million) Forecast, by Application 2020 & 2033
- Table 41: Benelux Pneumatic Waste Management System In GCC Revenue (Million) Forecast, by Application 2020 & 2033
- Table 42: Benelux Pneumatic Waste Management System In GCC Volume (Million) Forecast, by Application 2020 & 2033
- Table 43: Nordics Pneumatic Waste Management System In GCC Revenue (Million) Forecast, by Application 2020 & 2033
- Table 44: Nordics Pneumatic Waste Management System In GCC Volume (Million) Forecast, by Application 2020 & 2033
- Table 45: Rest of Europe Pneumatic Waste Management System In GCC Revenue (Million) Forecast, by Application 2020 & 2033
- Table 46: Rest of Europe Pneumatic Waste Management System In GCC Volume (Million) Forecast, by Application 2020 & 2033
- Table 47: Global Pneumatic Waste Management System In GCC Revenue Million Forecast, by End User 2020 & 2033
- Table 48: Global Pneumatic Waste Management System In GCC Volume Million Forecast, by End User 2020 & 2033
- Table 49: Global Pneumatic Waste Management System In GCC Revenue Million Forecast, by Country 2020 & 2033
- Table 50: Global Pneumatic Waste Management System In GCC Volume Million Forecast, by Country 2020 & 2033
- Table 51: Turkey Pneumatic Waste Management System In GCC Revenue (Million) Forecast, by Application 2020 & 2033
- Table 52: Turkey Pneumatic Waste Management System In GCC Volume (Million) Forecast, by Application 2020 & 2033
- Table 53: Israel Pneumatic Waste Management System In GCC Revenue (Million) Forecast, by Application 2020 & 2033
- Table 54: Israel Pneumatic Waste Management System In GCC Volume (Million) Forecast, by Application 2020 & 2033
- Table 55: GCC Pneumatic Waste Management System In GCC Revenue (Million) Forecast, by Application 2020 & 2033
- Table 56: GCC Pneumatic Waste Management System In GCC Volume (Million) Forecast, by Application 2020 & 2033
- Table 57: North Africa Pneumatic Waste Management System In GCC Revenue (Million) Forecast, by Application 2020 & 2033
- Table 58: North Africa Pneumatic Waste Management System In GCC Volume (Million) Forecast, by Application 2020 & 2033
- Table 59: South Africa Pneumatic Waste Management System In GCC Revenue (Million) Forecast, by Application 2020 & 2033
- Table 60: South Africa Pneumatic Waste Management System In GCC Volume (Million) Forecast, by Application 2020 & 2033
- Table 61: Rest of Middle East & Africa Pneumatic Waste Management System In GCC Revenue (Million) Forecast, by Application 2020 & 2033
- Table 62: Rest of Middle East & Africa Pneumatic Waste Management System In GCC Volume (Million) Forecast, by Application 2020 & 2033
- Table 63: Global Pneumatic Waste Management System In GCC Revenue Million Forecast, by End User 2020 & 2033
- Table 64: Global Pneumatic Waste Management System In GCC Volume Million Forecast, by End User 2020 & 2033
- Table 65: Global Pneumatic Waste Management System In GCC Revenue Million Forecast, by Country 2020 & 2033
- Table 66: Global Pneumatic Waste Management System In GCC Volume Million Forecast, by Country 2020 & 2033
- Table 67: China Pneumatic Waste Management System In GCC Revenue (Million) Forecast, by Application 2020 & 2033
- Table 68: China Pneumatic Waste Management System In GCC Volume (Million) Forecast, by Application 2020 & 2033
- Table 69: India Pneumatic Waste Management System In GCC Revenue (Million) Forecast, by Application 2020 & 2033
- Table 70: India Pneumatic Waste Management System In GCC Volume (Million) Forecast, by Application 2020 & 2033
- Table 71: Japan Pneumatic Waste Management System In GCC Revenue (Million) Forecast, by Application 2020 & 2033
- Table 72: Japan Pneumatic Waste Management System In GCC Volume (Million) Forecast, by Application 2020 & 2033
- Table 73: South Korea Pneumatic Waste Management System In GCC Revenue (Million) Forecast, by Application 2020 & 2033
- Table 74: South Korea Pneumatic Waste Management System In GCC Volume (Million) Forecast, by Application 2020 & 2033
- Table 75: ASEAN Pneumatic Waste Management System In GCC Revenue (Million) Forecast, by Application 2020 & 2033
- Table 76: ASEAN Pneumatic Waste Management System In GCC Volume (Million) Forecast, by Application 2020 & 2033
- Table 77: Oceania Pneumatic Waste Management System In GCC Revenue (Million) Forecast, by Application 2020 & 2033
- Table 78: Oceania Pneumatic Waste Management System In GCC Volume (Million) Forecast, by Application 2020 & 2033
- Table 79: Rest of Asia Pacific Pneumatic Waste Management System In GCC Revenue (Million) Forecast, by Application 2020 & 2033
- Table 80: Rest of Asia Pacific Pneumatic Waste Management System In GCC Volume (Million) Forecast, by Application 2020 & 2033
Frequently Asked Questions
1. What is the projected Compound Annual Growth Rate (CAGR) of the Pneumatic Waste Management System In GCC?
The projected CAGR is approximately 5.47%.
2. Which companies are prominent players in the Pneumatic Waste Management System In GCC?
Key companies in the market include Marimatic, ENVAC, URD, Stream, ATREO, Ros Roca envirotec, Peakway Environmental Sci & Tech Co Ltd, Aerbin ApS, Urban Refuse Development, Logiwaste AB**List Not Exhaustive 7 3 Other Companie.
3. What are the main segments of the Pneumatic Waste Management System In GCC?
The market segments include End User.
4. Can you provide details about the market size?
The market size is estimated to be USD 23.80 Million as of 2022.
5. What are some drivers contributing to market growth?
Increase in Waste Generation; Government Initiatives in Waste Management; Increasing Construction of Smart Cities.
6. What are the notable trends driving market growth?
Increasing Demand for Pneumatic Waste Management Systems in Saudi Arabia is Driving the Market.
7. Are there any restraints impacting market growth?
Increase in Waste Generation; Government Initiatives in Waste Management; Increasing Construction of Smart Cities.
8. Can you provide examples of recent developments in the market?
August 2023: Akam, a subsidiary of the Saudi Investment Company for Recycling (SIRC Group), partnered with Alawalya Qatar for Primary Materials. This collaboration focuses on the technical aspects of demolition and construction waste sorting and reviews past contracts. It also includes analyzing recycled soil debris and powder for reuse in fertilization and road paving, exchanging scientific research, and setting Qatari standards for recycled materials. The partnership may extend to other waste sectors, such as metals and tires.
9. What pricing options are available for accessing the report?
Pricing options include single-user, multi-user, and enterprise licenses priced at USD 3800, USD 4500, and USD 5800 respectively.
10. Is the market size provided in terms of value or volume?
The market size is provided in terms of value, measured in Million and volume, measured in Million.
11. Are there any specific market keywords associated with the report?
Yes, the market keyword associated with the report is "Pneumatic Waste Management System In GCC," which aids in identifying and referencing the specific market segment covered.
12. How do I determine which pricing option suits my needs best?
The pricing options vary based on user requirements and access needs. Individual users may opt for single-user licenses, while businesses requiring broader access may choose multi-user or enterprise licenses for cost-effective access to the report.
13. Are there any additional resources or data provided in the Pneumatic Waste Management System In GCC report?
While the report offers comprehensive insights, it's advisable to review the specific contents or supplementary materials provided to ascertain if additional resources or data are available.
14. How can I stay updated on further developments or reports in the Pneumatic Waste Management System In GCC?
To stay informed about further developments, trends, and reports in the Pneumatic Waste Management System In GCC, consider subscribing to industry newsletters, following relevant companies and organizations, or regularly checking reputable industry news sources and publications.
Methodology
Step 1 - Identification of Relevant Samples Size from Population Database


Step 2 - Approaches for Defining Global Market Size (Value, Volume* & Price*)

Note*: In applicable scenarios
Step 3 - Data Sources
Primary Research
- Web Analytics
- Survey Reports
- Research Institute
- Latest Research Reports
- Opinion Leaders
Secondary Research
- Annual Reports
- White Paper
- Latest Press Release
- Industry Association
- Paid Database
- Investor Presentations

Step 4 - Data Triangulation
Involves using different sources of information in order to increase the validity of a study
These sources are likely to be stakeholders in a program - participants, other researchers, program staff, other community members, and so on.
Then we put all data in single framework & apply various statistical tools to find out the dynamic on the market.
During the analysis stage, feedback from the stakeholder groups would be compared to determine areas of agreement as well as areas of divergence