

Key Insights
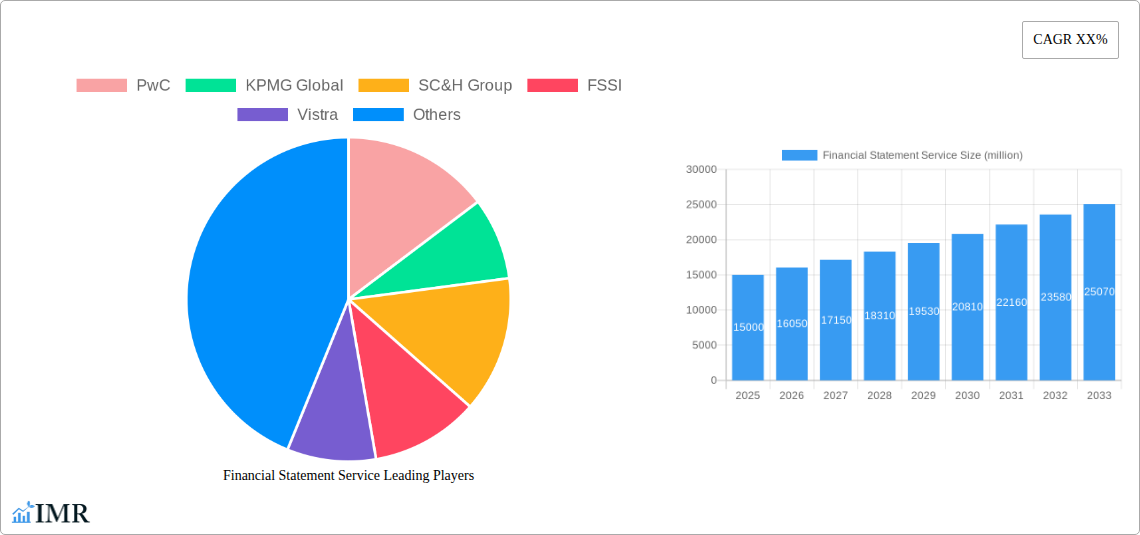
The global Financial Statement Services market is experiencing robust growth, driven by increasing regulatory complexities, the expanding need for accurate financial reporting, and the rising adoption of cloud-based accounting solutions. The market's compound annual growth rate (CAGR) is estimated at 7% for the period 2025-2033, indicating substantial market expansion. This growth is fueled by several key factors: a surge in demand for outsourcing services from small and medium-sized enterprises (SMEs) seeking cost efficiencies and expertise, increasing focus on data analytics and insights derived from financial statements, and the growing adoption of automation technologies that streamline financial reporting processes. Major players like PwC, KPMG, and others are leveraging strategic partnerships, acquisitions, and technological advancements to consolidate their market presence and meet the evolving needs of diverse clients.
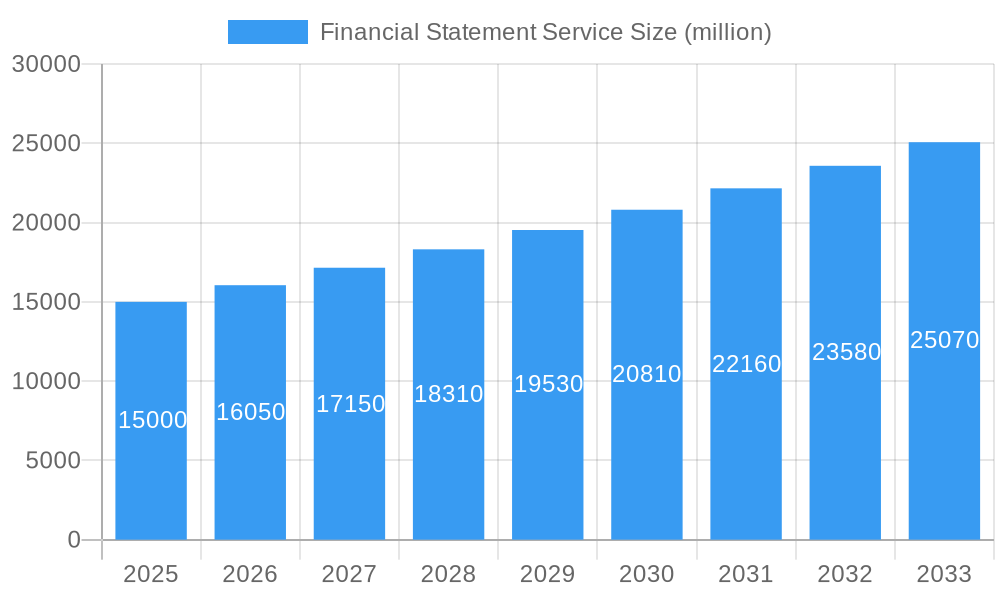
Financial Statement Service Market Size (In Billion)
The market segmentation reveals significant opportunities across different service types, including audit, review, and compilation services, catering to various industry verticals. While North America currently holds a leading market share, regions like Asia-Pacific are witnessing accelerated growth, reflecting the increasing adoption of international financial reporting standards (IFRS) and the expansion of businesses in emerging economies. Restraints include potential cybersecurity threats related to sensitive financial data and the need for continuous adaptation to evolving accounting standards. However, the overall outlook remains positive, with continuous technological innovation and increasing regulatory scrutiny driving the long-term growth trajectory of the Financial Statement Services market.
Financial Statement Service Company Market Share
Financial Statement Service Market Report: 2019-2033
This comprehensive report provides a detailed analysis of the global Financial Statement Service market, encompassing historical data (2019-2024), current estimates (2025), and future projections (2025-2033). The study delves into market dynamics, growth trends, competitive landscapes, and emerging opportunities, offering invaluable insights for industry professionals, investors, and strategic decision-makers. The report utilizes a parent market approach focusing on the broader financial services industry and drills down to the child market of financial statement services. Market values are presented in millions of units.
Financial Statement Service Market Dynamics & Structure
The global Financial Statement Service market, a crucial segment within the broader financial services industry, is characterized by moderate concentration. While major players like PwC and KPMG Global command significant market share (estimated at 15% and 12% respectively in 2025), a substantial number of smaller firms, including SC&H Group, FSSI, and Vistra, contribute significantly to the overall market volume. Technological innovation, primarily driven by automation and AI, is reshaping the landscape, leading to increased efficiency and accuracy. Stringent regulatory frameworks, such as IFRS and GAAP, impact service delivery and compliance requirements. The market also faces competition from alternative solutions and increasing pressure from in-house accounting capabilities of large corporations. Mergers and acquisitions (M&A) activity has been moderate over the past five years, with an estimated xx number of deals annually, primarily focused on strategic expansion and technology integration.
- Market Concentration: Moderately concentrated, with top players holding xx% market share in 2025.
- Technological Drivers: Automation, AI, and cloud-based solutions are accelerating service efficiency.
- Regulatory Frameworks: IFRS and GAAP compliance influence service design and demand.
- Competitive Substitutes: Internal accounting departments and simplified software solutions pose competition.
- M&A Activity: An estimated xx M&A deals annually (2019-2024).
- Innovation Barriers: High initial investment costs for technology adoption and skill gaps in the workforce.
Financial Statement Service Growth Trends & Insights
The global Financial Statement Service market exhibited a CAGR of xx% during the historical period (2019-2024), reaching an estimated market size of $xx million in 2025. This growth is attributed to increasing regulatory scrutiny, the complexity of financial reporting, and the growing demand for outsourcing among SMEs and large corporations. Market penetration is expected to reach xx% by 2033, driven by increased awareness of financial statement services and the benefits of outsourcing. Technological disruptions, particularly AI-powered audit tools and cloud-based solutions, are significantly improving efficiency and reducing costs. However, shifts in consumer behavior towards more agile and flexible service models need to be addressed for continued growth. This section will be extended using additional insights from XXX data.
Dominant Regions, Countries, or Segments in Financial Statement Service
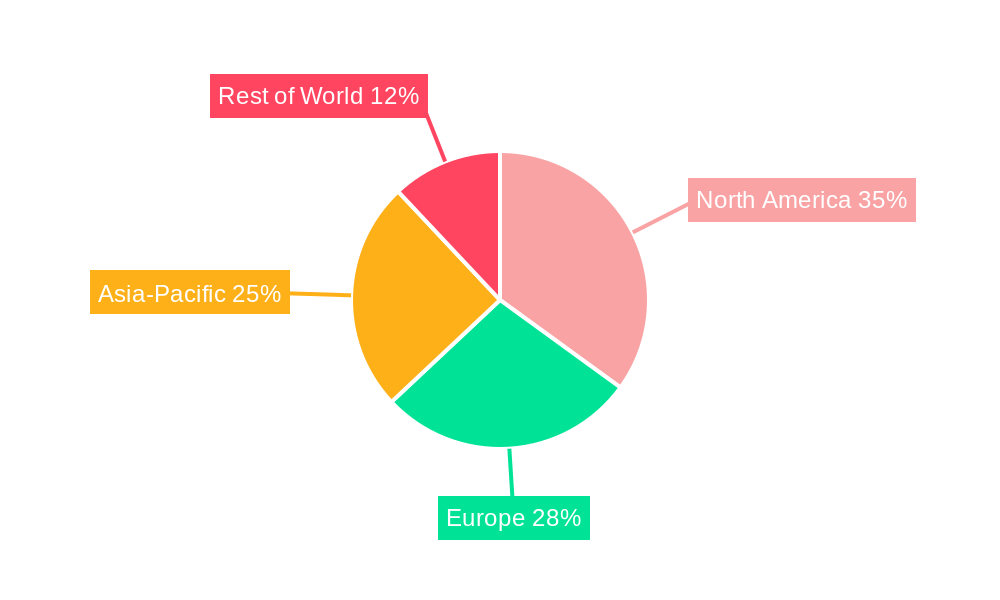
North America (particularly the US) holds the dominant position in the Financial Statement Service market, accounting for an estimated xx% of the global market share in 2025. This dominance is attributed to several factors:
- Strong regulatory environment: The stringent regulatory landscape necessitates robust financial statement services.
- Developed financial markets: Advanced financial systems and a large pool of listed companies drive demand.
- High adoption of technology: Early and widespread adoption of technology in the financial services sector.
- Large corporate sector: A significant presence of multinational corporations increases demand for specialized services.
- Abundant skilled labor: A substantial workforce with the expertise required for complex financial reporting contributes positively. Europe and Asia-Pacific are also significant markets, with substantial growth potential driven by increasing economic activity and regulatory changes.
Financial Statement Service Product Landscape
The Financial Statement Service market offers a range of services, including audit, compilation, review, and other assurance services. Recent innovations focus on incorporating data analytics and AI to improve accuracy, efficiency, and risk assessment. Cloud-based platforms and automation tools are key differentiators, offering enhanced scalability and accessibility. The unique selling proposition of many providers lies in their specialized industry expertise and ability to meet increasingly complex regulatory demands.
Key Drivers, Barriers & Challenges in Financial Statement Service
Key Drivers:
- Increasing regulatory compliance needs.
- Growing demand for outsourcing from SMEs and large corporations.
- Advancements in technology automating services.
- Globalization and cross-border transactions.
Key Barriers and Challenges:
- Maintaining data security and confidentiality.
- Adapting to evolving accounting standards and regulations.
- Competition from low-cost providers.
- The high initial investment needed for technological adoption. This can impact smaller firms disproportionately, possibly impacting the growth projections by xx% in the forecast period.
Emerging Opportunities in Financial Statement Service
- Expanding into emerging markets with less developed financial reporting infrastructure.
- Developing specialized services catering to niche industries.
- Leveraging blockchain technology for enhanced security and transparency.
- Offering integrated financial solutions combining services like advisory and tax compliance.
Growth Accelerators in the Financial Statement Service Industry
Technological breakthroughs, particularly in AI and machine learning, are a major growth accelerator. Strategic partnerships between Financial Statement Service providers and technology companies are also creating innovative solutions and expanding reach. Furthermore, market expansion strategies, such as mergers and acquisitions, are consolidating market share and driving economies of scale.
Key Players Shaping the Financial Statement Service Market
- PwC
- KPMG Global
- SC&H Group
- FSSI
- Vistra
- Heal Accounting
- Outsource2india
- 3E Accounting
- Ogier
- Affinity Accounting
- Hart Accounting
Notable Milestones in Financial Statement Service Sector
- 2020: Increased adoption of cloud-based accounting software.
- 2021: Significant investments in AI-powered audit tools by major players.
- 2022: Launch of several new specialized financial statement services by smaller firms.
- 2023: First successful implementation of blockchain technology in financial statement audits.
In-Depth Financial Statement Service Market Outlook
The Financial Statement Service market is poised for continued growth, driven by technological advancements, increasing regulatory complexity, and the globalization of financial markets. Strategic opportunities lie in expanding into emerging markets, developing specialized services, and leveraging cutting-edge technologies. The market is expected to reach a value of $xx million by 2033, representing a significant increase from the 2025 estimate. The focus on data security and compliance will remain paramount in driving the industry's future trajectory.
Financial Statement Service Segmentation
-
1. Application
- 1.1. SMEs
- 1.2. Large Enterprises
-
2. Types
- 2.1. Preparation
- 2.2. Compile
- 2.3. Review
- 2.4. Audit
- 2.5. Others
Financial Statement Service Segmentation By Geography
-
1. North America
- 1.1. United States
- 1.2. Canada
- 1.3. Mexico
-
2. South America
- 2.1. Brazil
- 2.2. Argentina
- 2.3. Rest of South America
-
3. Europe
- 3.1. United Kingdom
- 3.2. Germany
- 3.3. France
- 3.4. Italy
- 3.5. Spain
- 3.6. Russia
- 3.7. Benelux
- 3.8. Nordics
- 3.9. Rest of Europe
-
4. Middle East & Africa
- 4.1. Turkey
- 4.2. Israel
- 4.3. GCC
- 4.4. North Africa
- 4.5. South Africa
- 4.6. Rest of Middle East & Africa
-
5. Asia Pacific
- 5.1. China
- 5.2. India
- 5.3. Japan
- 5.4. South Korea
- 5.5. ASEAN
- 5.6. Oceania
- 5.7. Rest of Asia Pacific
Financial Statement Service Regional Market Share
Geographic Coverage of Financial Statement Service
Financial Statement Service REPORT HIGHLIGHTS
| Aspects | Details |
|---|---|
| Study Period | 2020-2034 |
| Base Year | 2025 |
| Estimated Year | 2026 |
| Forecast Period | 2026-2034 |
| Historical Period | 2020-2025 |
| Growth Rate | CAGR of 7% from 2020-2034 |
| Segmentation |
|
Table of Contents
- 1. Introduction
- 1.1. Research Scope
- 1.2. Market Segmentation
- 1.3. Research Methodology
- 1.4. Definitions and Assumptions
- 2. Executive Summary
- 2.1. Introduction
- 3. Market Dynamics
- 3.1. Introduction
- 3.2. Market Drivers
- 3.3. Market Restrains
- 3.4. Market Trends
- 4. Market Factor Analysis
- 4.1. Porters Five Forces
- 4.2. Supply/Value Chain
- 4.3. PESTEL analysis
- 4.4. Market Entropy
- 4.5. Patent/Trademark Analysis
- 5. Global Financial Statement Service Analysis, Insights and Forecast, 2020-2032
- 5.1. Market Analysis, Insights and Forecast - by Application
- 5.1.1. SMEs
- 5.1.2. Large Enterprises
- 5.2. Market Analysis, Insights and Forecast - by Types
- 5.2.1. Preparation
- 5.2.2. Compile
- 5.2.3. Review
- 5.2.4. Audit
- 5.2.5. Others
- 5.3. Market Analysis, Insights and Forecast - by Region
- 5.3.1. North America
- 5.3.2. South America
- 5.3.3. Europe
- 5.3.4. Middle East & Africa
- 5.3.5. Asia Pacific
- 5.1. Market Analysis, Insights and Forecast - by Application
- 6. North America Financial Statement Service Analysis, Insights and Forecast, 2020-2032
- 6.1. Market Analysis, Insights and Forecast - by Application
- 6.1.1. SMEs
- 6.1.2. Large Enterprises
- 6.2. Market Analysis, Insights and Forecast - by Types
- 6.2.1. Preparation
- 6.2.2. Compile
- 6.2.3. Review
- 6.2.4. Audit
- 6.2.5. Others
- 6.1. Market Analysis, Insights and Forecast - by Application
- 7. South America Financial Statement Service Analysis, Insights and Forecast, 2020-2032
- 7.1. Market Analysis, Insights and Forecast - by Application
- 7.1.1. SMEs
- 7.1.2. Large Enterprises
- 7.2. Market Analysis, Insights and Forecast - by Types
- 7.2.1. Preparation
- 7.2.2. Compile
- 7.2.3. Review
- 7.2.4. Audit
- 7.2.5. Others
- 7.1. Market Analysis, Insights and Forecast - by Application
- 8. Europe Financial Statement Service Analysis, Insights and Forecast, 2020-2032
- 8.1. Market Analysis, Insights and Forecast - by Application
- 8.1.1. SMEs
- 8.1.2. Large Enterprises
- 8.2. Market Analysis, Insights and Forecast - by Types
- 8.2.1. Preparation
- 8.2.2. Compile
- 8.2.3. Review
- 8.2.4. Audit
- 8.2.5. Others
- 8.1. Market Analysis, Insights and Forecast - by Application
- 9. Middle East & Africa Financial Statement Service Analysis, Insights and Forecast, 2020-2032
- 9.1. Market Analysis, Insights and Forecast - by Application
- 9.1.1. SMEs
- 9.1.2. Large Enterprises
- 9.2. Market Analysis, Insights and Forecast - by Types
- 9.2.1. Preparation
- 9.2.2. Compile
- 9.2.3. Review
- 9.2.4. Audit
- 9.2.5. Others
- 9.1. Market Analysis, Insights and Forecast - by Application
- 10. Asia Pacific Financial Statement Service Analysis, Insights and Forecast, 2020-2032
- 10.1. Market Analysis, Insights and Forecast - by Application
- 10.1.1. SMEs
- 10.1.2. Large Enterprises
- 10.2. Market Analysis, Insights and Forecast - by Types
- 10.2.1. Preparation
- 10.2.2. Compile
- 10.2.3. Review
- 10.2.4. Audit
- 10.2.5. Others
- 10.1. Market Analysis, Insights and Forecast - by Application
- 11. Competitive Analysis
- 11.1. Global Market Share Analysis 2025
- 11.2. Company Profiles
- 11.2.1 PwC
- 11.2.1.1. Overview
- 11.2.1.2. Products
- 11.2.1.3. SWOT Analysis
- 11.2.1.4. Recent Developments
- 11.2.1.5. Financials (Based on Availability)
- 11.2.2 KPMG Global
- 11.2.2.1. Overview
- 11.2.2.2. Products
- 11.2.2.3. SWOT Analysis
- 11.2.2.4. Recent Developments
- 11.2.2.5. Financials (Based on Availability)
- 11.2.3 SC&H Group
- 11.2.3.1. Overview
- 11.2.3.2. Products
- 11.2.3.3. SWOT Analysis
- 11.2.3.4. Recent Developments
- 11.2.3.5. Financials (Based on Availability)
- 11.2.4 FSSI
- 11.2.4.1. Overview
- 11.2.4.2. Products
- 11.2.4.3. SWOT Analysis
- 11.2.4.4. Recent Developments
- 11.2.4.5. Financials (Based on Availability)
- 11.2.5 Vistra
- 11.2.5.1. Overview
- 11.2.5.2. Products
- 11.2.5.3. SWOT Analysis
- 11.2.5.4. Recent Developments
- 11.2.5.5. Financials (Based on Availability)
- 11.2.6 Heal Accounting
- 11.2.6.1. Overview
- 11.2.6.2. Products
- 11.2.6.3. SWOT Analysis
- 11.2.6.4. Recent Developments
- 11.2.6.5. Financials (Based on Availability)
- 11.2.7 Outsource2india
- 11.2.7.1. Overview
- 11.2.7.2. Products
- 11.2.7.3. SWOT Analysis
- 11.2.7.4. Recent Developments
- 11.2.7.5. Financials (Based on Availability)
- 11.2.8 3E Accounting
- 11.2.8.1. Overview
- 11.2.8.2. Products
- 11.2.8.3. SWOT Analysis
- 11.2.8.4. Recent Developments
- 11.2.8.5. Financials (Based on Availability)
- 11.2.9 Ogier
- 11.2.9.1. Overview
- 11.2.9.2. Products
- 11.2.9.3. SWOT Analysis
- 11.2.9.4. Recent Developments
- 11.2.9.5. Financials (Based on Availability)
- 11.2.10 Affinity Accounting
- 11.2.10.1. Overview
- 11.2.10.2. Products
- 11.2.10.3. SWOT Analysis
- 11.2.10.4. Recent Developments
- 11.2.10.5. Financials (Based on Availability)
- 11.2.11 Hart Accounting
- 11.2.11.1. Overview
- 11.2.11.2. Products
- 11.2.11.3. SWOT Analysis
- 11.2.11.4. Recent Developments
- 11.2.11.5. Financials (Based on Availability)
- 11.2.1 PwC
List of Figures
- Figure 1: Global Financial Statement Service Revenue Breakdown (undefined, %) by Region 2025 & 2033
- Figure 2: North America Financial Statement Service Revenue (undefined), by Application 2025 & 2033
- Figure 3: North America Financial Statement Service Revenue Share (%), by Application 2025 & 2033
- Figure 4: North America Financial Statement Service Revenue (undefined), by Types 2025 & 2033
- Figure 5: North America Financial Statement Service Revenue Share (%), by Types 2025 & 2033
- Figure 6: North America Financial Statement Service Revenue (undefined), by Country 2025 & 2033
- Figure 7: North America Financial Statement Service Revenue Share (%), by Country 2025 & 2033
- Figure 8: South America Financial Statement Service Revenue (undefined), by Application 2025 & 2033
- Figure 9: South America Financial Statement Service Revenue Share (%), by Application 2025 & 2033
- Figure 10: South America Financial Statement Service Revenue (undefined), by Types 2025 & 2033
- Figure 11: South America Financial Statement Service Revenue Share (%), by Types 2025 & 2033
- Figure 12: South America Financial Statement Service Revenue (undefined), by Country 2025 & 2033
- Figure 13: South America Financial Statement Service Revenue Share (%), by Country 2025 & 2033
- Figure 14: Europe Financial Statement Service Revenue (undefined), by Application 2025 & 2033
- Figure 15: Europe Financial Statement Service Revenue Share (%), by Application 2025 & 2033
- Figure 16: Europe Financial Statement Service Revenue (undefined), by Types 2025 & 2033
- Figure 17: Europe Financial Statement Service Revenue Share (%), by Types 2025 & 2033
- Figure 18: Europe Financial Statement Service Revenue (undefined), by Country 2025 & 2033
- Figure 19: Europe Financial Statement Service Revenue Share (%), by Country 2025 & 2033
- Figure 20: Middle East & Africa Financial Statement Service Revenue (undefined), by Application 2025 & 2033
- Figure 21: Middle East & Africa Financial Statement Service Revenue Share (%), by Application 2025 & 2033
- Figure 22: Middle East & Africa Financial Statement Service Revenue (undefined), by Types 2025 & 2033
- Figure 23: Middle East & Africa Financial Statement Service Revenue Share (%), by Types 2025 & 2033
- Figure 24: Middle East & Africa Financial Statement Service Revenue (undefined), by Country 2025 & 2033
- Figure 25: Middle East & Africa Financial Statement Service Revenue Share (%), by Country 2025 & 2033
- Figure 26: Asia Pacific Financial Statement Service Revenue (undefined), by Application 2025 & 2033
- Figure 27: Asia Pacific Financial Statement Service Revenue Share (%), by Application 2025 & 2033
- Figure 28: Asia Pacific Financial Statement Service Revenue (undefined), by Types 2025 & 2033
- Figure 29: Asia Pacific Financial Statement Service Revenue Share (%), by Types 2025 & 2033
- Figure 30: Asia Pacific Financial Statement Service Revenue (undefined), by Country 2025 & 2033
- Figure 31: Asia Pacific Financial Statement Service Revenue Share (%), by Country 2025 & 2033
List of Tables
- Table 1: Global Financial Statement Service Revenue undefined Forecast, by Application 2020 & 2033
- Table 2: Global Financial Statement Service Revenue undefined Forecast, by Types 2020 & 2033
- Table 3: Global Financial Statement Service Revenue undefined Forecast, by Region 2020 & 2033
- Table 4: Global Financial Statement Service Revenue undefined Forecast, by Application 2020 & 2033
- Table 5: Global Financial Statement Service Revenue undefined Forecast, by Types 2020 & 2033
- Table 6: Global Financial Statement Service Revenue undefined Forecast, by Country 2020 & 2033
- Table 7: United States Financial Statement Service Revenue (undefined) Forecast, by Application 2020 & 2033
- Table 8: Canada Financial Statement Service Revenue (undefined) Forecast, by Application 2020 & 2033
- Table 9: Mexico Financial Statement Service Revenue (undefined) Forecast, by Application 2020 & 2033
- Table 10: Global Financial Statement Service Revenue undefined Forecast, by Application 2020 & 2033
- Table 11: Global Financial Statement Service Revenue undefined Forecast, by Types 2020 & 2033
- Table 12: Global Financial Statement Service Revenue undefined Forecast, by Country 2020 & 2033
- Table 13: Brazil Financial Statement Service Revenue (undefined) Forecast, by Application 2020 & 2033
- Table 14: Argentina Financial Statement Service Revenue (undefined) Forecast, by Application 2020 & 2033
- Table 15: Rest of South America Financial Statement Service Revenue (undefined) Forecast, by Application 2020 & 2033
- Table 16: Global Financial Statement Service Revenue undefined Forecast, by Application 2020 & 2033
- Table 17: Global Financial Statement Service Revenue undefined Forecast, by Types 2020 & 2033
- Table 18: Global Financial Statement Service Revenue undefined Forecast, by Country 2020 & 2033
- Table 19: United Kingdom Financial Statement Service Revenue (undefined) Forecast, by Application 2020 & 2033
- Table 20: Germany Financial Statement Service Revenue (undefined) Forecast, by Application 2020 & 2033
- Table 21: France Financial Statement Service Revenue (undefined) Forecast, by Application 2020 & 2033
- Table 22: Italy Financial Statement Service Revenue (undefined) Forecast, by Application 2020 & 2033
- Table 23: Spain Financial Statement Service Revenue (undefined) Forecast, by Application 2020 & 2033
- Table 24: Russia Financial Statement Service Revenue (undefined) Forecast, by Application 2020 & 2033
- Table 25: Benelux Financial Statement Service Revenue (undefined) Forecast, by Application 2020 & 2033
- Table 26: Nordics Financial Statement Service Revenue (undefined) Forecast, by Application 2020 & 2033
- Table 27: Rest of Europe Financial Statement Service Revenue (undefined) Forecast, by Application 2020 & 2033
- Table 28: Global Financial Statement Service Revenue undefined Forecast, by Application 2020 & 2033
- Table 29: Global Financial Statement Service Revenue undefined Forecast, by Types 2020 & 2033
- Table 30: Global Financial Statement Service Revenue undefined Forecast, by Country 2020 & 2033
- Table 31: Turkey Financial Statement Service Revenue (undefined) Forecast, by Application 2020 & 2033
- Table 32: Israel Financial Statement Service Revenue (undefined) Forecast, by Application 2020 & 2033
- Table 33: GCC Financial Statement Service Revenue (undefined) Forecast, by Application 2020 & 2033
- Table 34: North Africa Financial Statement Service Revenue (undefined) Forecast, by Application 2020 & 2033
- Table 35: South Africa Financial Statement Service Revenue (undefined) Forecast, by Application 2020 & 2033
- Table 36: Rest of Middle East & Africa Financial Statement Service Revenue (undefined) Forecast, by Application 2020 & 2033
- Table 37: Global Financial Statement Service Revenue undefined Forecast, by Application 2020 & 2033
- Table 38: Global Financial Statement Service Revenue undefined Forecast, by Types 2020 & 2033
- Table 39: Global Financial Statement Service Revenue undefined Forecast, by Country 2020 & 2033
- Table 40: China Financial Statement Service Revenue (undefined) Forecast, by Application 2020 & 2033
- Table 41: India Financial Statement Service Revenue (undefined) Forecast, by Application 2020 & 2033
- Table 42: Japan Financial Statement Service Revenue (undefined) Forecast, by Application 2020 & 2033
- Table 43: South Korea Financial Statement Service Revenue (undefined) Forecast, by Application 2020 & 2033
- Table 44: ASEAN Financial Statement Service Revenue (undefined) Forecast, by Application 2020 & 2033
- Table 45: Oceania Financial Statement Service Revenue (undefined) Forecast, by Application 2020 & 2033
- Table 46: Rest of Asia Pacific Financial Statement Service Revenue (undefined) Forecast, by Application 2020 & 2033
Frequently Asked Questions
1. What is the projected Compound Annual Growth Rate (CAGR) of the Financial Statement Service?
The projected CAGR is approximately 7%.
2. Which companies are prominent players in the Financial Statement Service?
Key companies in the market include PwC, KPMG Global, SC&H Group, FSSI, Vistra, Heal Accounting, Outsource2india, 3E Accounting, Ogier, Affinity Accounting, Hart Accounting.
3. What are the main segments of the Financial Statement Service?
The market segments include Application, Types.
4. Can you provide details about the market size?
The market size is estimated to be USD XXX N/A as of 2022.
5. What are some drivers contributing to market growth?
N/A
6. What are the notable trends driving market growth?
N/A
7. Are there any restraints impacting market growth?
N/A
8. Can you provide examples of recent developments in the market?
N/A
9. What pricing options are available for accessing the report?
Pricing options include single-user, multi-user, and enterprise licenses priced at USD 2900.00, USD 4350.00, and USD 5800.00 respectively.
10. Is the market size provided in terms of value or volume?
The market size is provided in terms of value, measured in N/A.
11. Are there any specific market keywords associated with the report?
Yes, the market keyword associated with the report is "Financial Statement Service," which aids in identifying and referencing the specific market segment covered.
12. How do I determine which pricing option suits my needs best?
The pricing options vary based on user requirements and access needs. Individual users may opt for single-user licenses, while businesses requiring broader access may choose multi-user or enterprise licenses for cost-effective access to the report.
13. Are there any additional resources or data provided in the Financial Statement Service report?
While the report offers comprehensive insights, it's advisable to review the specific contents or supplementary materials provided to ascertain if additional resources or data are available.
14. How can I stay updated on further developments or reports in the Financial Statement Service?
To stay informed about further developments, trends, and reports in the Financial Statement Service, consider subscribing to industry newsletters, following relevant companies and organizations, or regularly checking reputable industry news sources and publications.
Methodology
Step 1 - Identification of Relevant Samples Size from Population Database


Step 2 - Approaches for Defining Global Market Size (Value, Volume* & Price*)

Note*: In applicable scenarios
Step 3 - Data Sources
Primary Research
- Web Analytics
- Survey Reports
- Research Institute
- Latest Research Reports
- Opinion Leaders
Secondary Research
- Annual Reports
- White Paper
- Latest Press Release
- Industry Association
- Paid Database
- Investor Presentations

Step 4 - Data Triangulation
Involves using different sources of information in order to increase the validity of a study
These sources are likely to be stakeholders in a program - participants, other researchers, program staff, other community members, and so on.
Then we put all data in single framework & apply various statistical tools to find out the dynamic on the market.
During the analysis stage, feedback from the stakeholder groups would be compared to determine areas of agreement as well as areas of divergence