

Key Insights
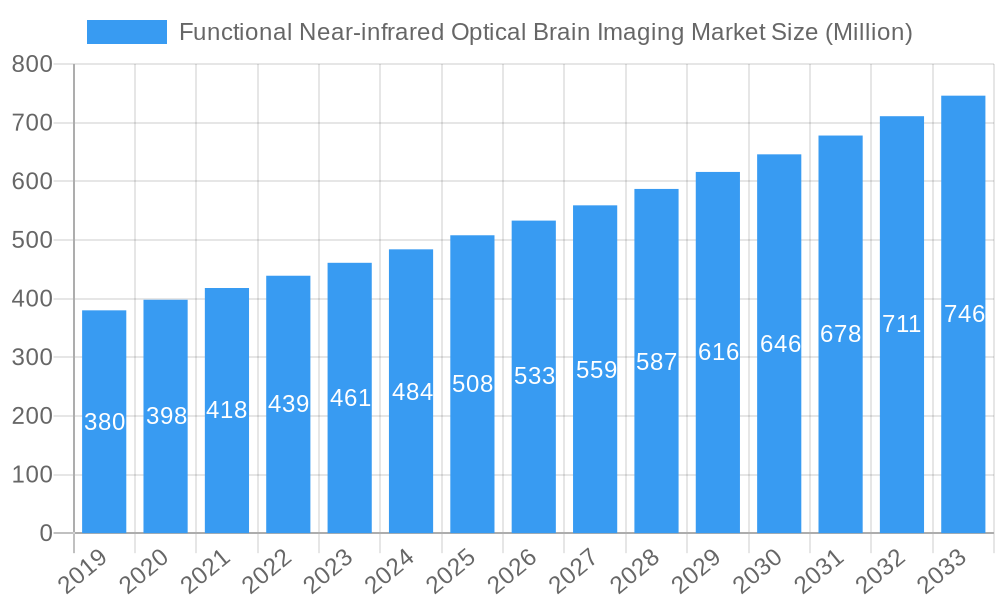
The Functional Near-infrared Optical Brain Imaging Market is poised for robust expansion, projected to reach a significant market size of approximately $520 million by 2025, driven by a Compound Annual Growth Rate (CAGR) of 5.65%. This growth trajectory is fueled by an increasing prevalence of neurological disorders such as Parkinson's Disease, Epilepsy, Dementia, and Traumatic Brain Injury, all of which benefit from advanced diagnostic and monitoring tools like fNIRS. The inherent advantages of fNIRS, including its non-invasiveness, portability, and cost-effectiveness compared to other neuroimaging techniques, are compelling hospitals and diagnostic centers to adopt this technology more widely. Furthermore, ongoing advancements in fNIRS sensor technology, signal processing algorithms, and the integration with artificial intelligence are enhancing its diagnostic accuracy and broadening its application scope, further stimulating market demand.
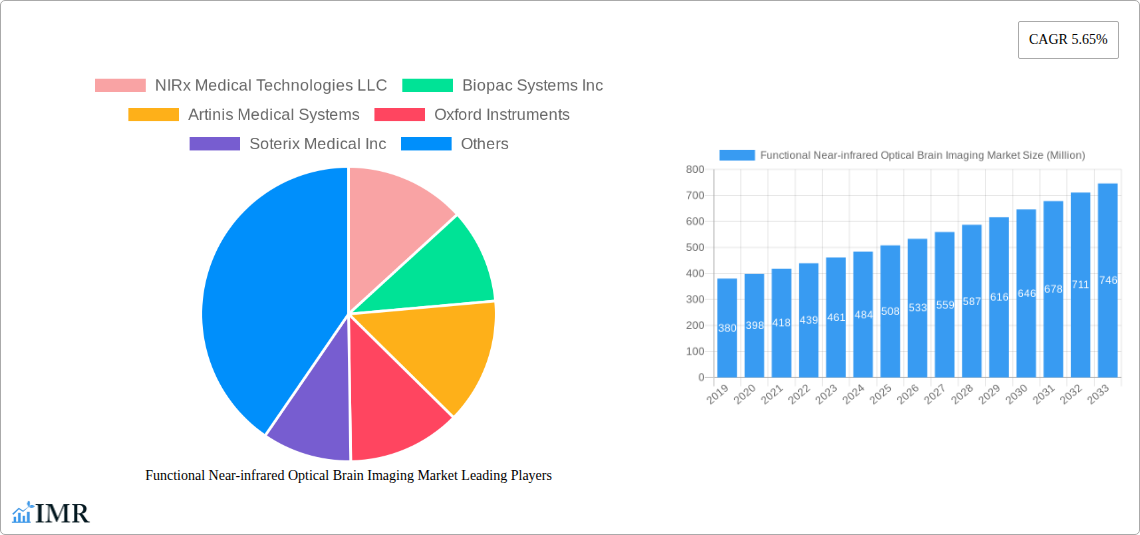
Functional Near-infrared Optical Brain Imaging Market Market Size (In Million)
The market's expansion is also being shaped by emerging trends such as the increasing focus on personalized medicine and the growing research into sleep disorders and cognitive decline in aging populations. These areas present fertile ground for fNIRS applications. However, the market faces certain restraints, including the need for greater clinical validation in specific applications and the initial high cost of sophisticated fNIRS systems, which can be a barrier for smaller healthcare facilities. Despite these challenges, the competitive landscape is dynamic, with key players like NIRx Medical Technologies LLC, Biopac Systems Inc, and Oxford Instruments investing in research and development to introduce innovative solutions. The geographical distribution indicates a strong presence in North America and Europe, with Asia Pacific emerging as a rapidly growing region due to increasing healthcare investments and rising awareness of neurological health.
Functional Near-infrared Optical Brain Imaging Market Company Market Share
This in-depth report offers a detailed exploration of the global Functional Near-infrared Optical Brain Imaging (fNIRS) market, providing crucial insights for stakeholders, researchers, and industry professionals. Covering the historical period of 2019-2024, base year of 2025, and a comprehensive forecast period of 2025-2033, this analysis delves into market dynamics, growth trends, product landscape, key players, and emerging opportunities. The report meticulously examines the market's evolution, driven by technological advancements and increasing applications in neuroscience, neurology, and mental health diagnostics.
Functional Near-infrared Optical Brain Imaging Market Market Dynamics & Structure
The Functional Near-infrared Optical Brain Imaging (fNIRS) market exhibits a moderately concentrated structure, with a few key players holding significant market share, alongside a growing number of innovative startups. Technological innovation is a primary driver, with ongoing advancements in sensor technology, signal processing algorithms, and wearable device development enhancing the accuracy, portability, and user-friendliness of fNIRS systems. Regulatory frameworks are evolving, with increasing recognition of fNIRS as a valuable diagnostic tool, though standardization and broader clinical validation remain key areas for development. Competitive product substitutes, such as fMRI and EEG, offer alternative neuroimaging solutions, but fNIRS differentiates itself through its non-invasiveness, portability, and cost-effectiveness, particularly for specific applications. End-user demographics are expanding, encompassing hospitals, research institutions, diagnostic centers, and even emerging consumer-facing wellness applications. Merger and acquisition (M&A) trends, while not yet extensive, are expected to increase as larger companies seek to integrate fNIRS technology into their broader healthcare portfolios, fostering market consolidation and further innovation. The market is influenced by factors such as the prevalence of neurological disorders, increasing investment in brain research, and the growing demand for real-time brain monitoring solutions. The estimated market value in 2025 is USD 1,200 Million.
- Market Concentration: Moderate, with key players and emerging innovators.
- Technological Innovation: Driven by sensor improvements, AI in signal processing, and wearable development.
- Regulatory Landscape: Evolving, with a focus on clinical validation and standardization.
- Competitive Substitutes: fMRI, EEG, MEG, offering different strengths and weaknesses.
- End-User Diversification: From clinical settings to research and wellness.
- M&A Activity: Potential for consolidation as the market matures.
Functional Near-infrared Optical Brain Imaging Market Growth Trends & Insights
The Functional Near-infrared Optical Brain Imaging (fNIRS) market is poised for substantial growth, projected to reach USD 3,500 Million by 2033, exhibiting a Compound Annual Growth Rate (CAGR) of XX% from 2025 to 2033. This robust expansion is fueled by escalating adoption rates across various applications, particularly in diagnosing and monitoring neurological and psychological conditions. Technological disruptions are continually refining fNIRS capabilities; for instance, the integration of time-domain fNIRS (TD-fNIRS) by companies like Kernel offers unprecedented resolution and accuracy in brain function measurement. This advancement allows for more precise identification of brain activity patterns, opening new avenues for research and clinical intervention. Consumer behavior shifts are also playing a role, with an increasing awareness and demand for non-invasive, real-time brain health monitoring solutions, extending beyond traditional clinical settings into personalized wellness and performance optimization. The market penetration of fNIRS devices is steadily increasing as their benefits become more widely recognized and as costs become more accessible. The inherent advantages of fNIRS, such as its portability, safety (no ionizing radiation), and ability to measure brain activity in naturalistic environments, are key differentiators driving its market expansion. Furthermore, the growing understanding of brain connectivity and its role in various disorders is propelling the demand for advanced neuroimaging techniques like fNIRS. The market size evolution is a testament to the increasing investment in neuroscience research and the growing clinical acceptance of fNIRS as a valuable diagnostic and research tool. The ability of fNIRS to provide functional brain imaging data in real-time without requiring extreme environmental controls (like in fMRI) is a significant factor contributing to its widespread adoption in diverse settings, from infant studies to cognitive load assessments during complex tasks.
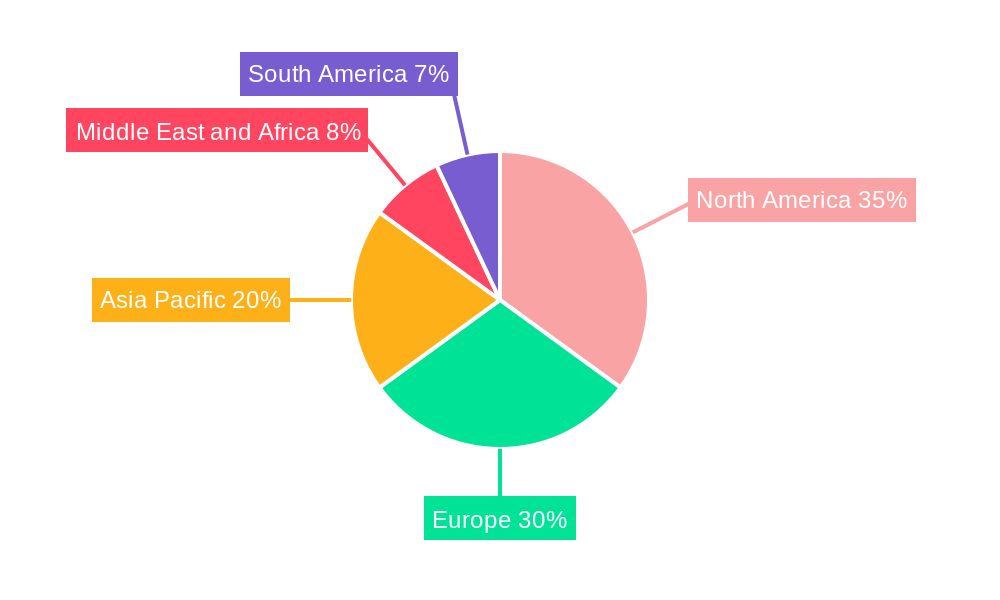
Dominant Regions, Countries, or Segments in Functional Near-infrared Optical Brain Imaging Market
North America currently dominates the Functional Near-infrared Optical Brain Imaging (fNIRS) market, driven by significant investments in neuroscience research, a strong presence of leading fNIRS technology developers, and a well-established healthcare infrastructure that readily adopts advanced diagnostic tools. The United States, in particular, represents a substantial portion of the regional market share, owing to robust government funding for brain health initiatives and a high prevalence of neurological disorders like Parkinson's Disease and Dementia.
Among the application types, Parkinson's Disease and Dementia are emerging as significant growth drivers. The increasing aging population globally contributes to a higher incidence of these neurodegenerative diseases, thereby fueling the demand for sophisticated diagnostic and monitoring tools like fNIRS. fNIRS offers a non-invasive, cost-effective alternative for early detection and tracking disease progression, making it attractive for widespread clinical application.
Leading Region: North America, particularly the United States.
- Key Drivers: High R&D investment, presence of key manufacturers, strong healthcare adoption, government funding for brain research.
- Market Share Potential: Estimated to hold over 35% of the global market share in 2025.
Dominant Application Type:
- Parkinson's Disease: Increasing prevalence, need for early diagnosis and monitoring.
- Dementia: Growing elderly population, demand for non-invasive cognitive assessment tools.
- Growth Potential: These segments are expected to see a CAGR of XX% during the forecast period.
Key End-User Segment:
- Hospitals: Integral for clinical diagnosis, patient monitoring, and neurorehabilitation programs.
- Diagnostic Centers: Growing adoption for specialized neurological assessments and research.
- Market Share: Hospitals are projected to account for approximately 55% of the end-user market in 2025.
The growth in these segments is further propelled by the increasing number of clinical trials leveraging fNIRS for therapeutic efficacy studies and the development of personalized treatment plans. Europe and Asia-Pacific are also anticipated to witness significant growth, fueled by expanding research initiatives and improving healthcare access in countries like Germany, the UK, China, and Japan.
Functional Near-infrared Optical Brain Imaging Market Product Landscape
The product landscape of the Functional Near-infrared Optical Brain Imaging (fNIRS) market is characterized by continuous innovation, with a focus on enhancing system resolution, portability, and data analysis capabilities. Companies are developing advanced fNIRS devices that integrate multi-wavelength spectroscopy for improved tissue penetration and more accurate oxygenation level detection. Emerging products include wearable fNIRS headsets designed for both laboratory research and real-world applications, enabling continuous brain monitoring during daily activities. The integration of artificial intelligence (AI) and machine learning (ML) algorithms is a significant trend, facilitating more sophisticated interpretation of brain data and enabling earlier and more precise diagnoses of neurological conditions. The performance metrics being prioritized include higher spatial and temporal resolution, reduced susceptibility to motion artifacts, and improved signal-to-noise ratio.
Key Drivers, Barriers & Challenges in Functional Near-infrared Optical Brain Imaging Market
Key Drivers:
- Increasing prevalence of neurological disorders: Growing incidence of conditions like Parkinson's disease, epilepsy, and dementia drives demand for advanced diagnostic tools.
- Technological advancements: Innovations in sensor technology, signal processing, and wearable design are enhancing fNIRS capabilities.
- Growing research investment: Significant funding in neuroscience and brain research is fueling the adoption of fNIRS in academic and clinical settings.
- Non-invasive and portable nature: fNIRS offers a safer and more practical alternative to other neuroimaging modalities.
Barriers & Challenges:
- Limited depth penetration: fNIRS signals are attenuated by tissue, limiting the depth of brain regions that can be reliably measured.
- Regulatory hurdles and standardization: The need for broader clinical validation and standardized protocols can slow market adoption.
- Competition from established neuroimaging techniques: fMRI and EEG offer established diagnostic pathways.
- High initial cost of advanced systems: While more affordable than fMRI, sophisticated fNIRS systems can still represent a significant investment for some institutions.
- Need for skilled operators: Accurate data acquisition and interpretation require trained personnel.
Emerging Opportunities in Functional Near-infrared Optical Brain Imaging Market
Emerging opportunities in the Functional Near-infrared Optical Brain Imaging (fNIRS) market lie in the expansion of its application in mental health, including the diagnosis and treatment monitoring of depression, anxiety, and ADHD. The development of consumer-grade, portable fNIRS devices for brain wellness and cognitive enhancement applications presents a significant untapped market. Furthermore, the integration of fNIRS with other neurotechnologies, such as virtual reality (VR) and augmented reality (AR), opens avenues for immersive neurofeedback training and rehabilitation. Personalized medicine approaches leveraging fNIRS data for individualized treatment strategies are also poised for growth.
Growth Accelerators in the Functional Near-infrared Optical Brain Imaging Market Industry
The Functional Near-infrared Optical Brain Imaging (fNIRS) market is experiencing accelerated growth driven by a confluence of factors. Technological breakthroughs in miniaturization and optical engineering are leading to more compact, user-friendly, and affordable fNIRS systems. Strategic partnerships between fNIRS manufacturers and leading research institutions are crucial for validating clinical applications and expanding the evidence base, thereby fostering wider adoption. Market expansion strategies, including the development of specialized fNIRS solutions for niche applications and the penetration of emerging geographical markets with growing healthcare expenditure, are also significant growth catalysts.
Key Players Shaping the Functional Near-infrared Optical Brain Imaging Market Market
- NIRx Medical Technologies LLC
- Biopac Systems Inc
- Artinis Medical Systems
- Oxford Instruments
- Soterix Medical Inc
- Gowerlaps Ltd
- Fujifilm Holdings Corporation (Hitachi Ltd )
- PerkinElmer Inc
- Shimadzu Corporation
Notable Milestones in Functional Near-infrared Optical Brain Imaging Market Sector
- March 2022: Kernel, a neurotechnology company, developed the Kernel Flow, a wearable headset device for brain measurement based on time-domain functional near-infrared spectroscopy (TD-fNIRS), enabling accurate, high-resolution brain measurement through picosecond pulses of light.
- March 2022: MYndspan launched an imaging service utilizing brain connectivity to measure and assess brain health, offering a detailed map of brain activity and function by measuring electrical signals between neurons.
In-Depth Functional Near-infrared Optical Brain Imaging Market Market Outlook
The future outlook for the Functional Near-infrared Optical Brain Imaging (fNIRS) market is exceptionally promising, driven by its expanding clinical utility and technological evolution. Key growth accelerators include the increasing focus on non-pharmacological interventions for neurological disorders, where fNIRS can play a vital role in monitoring therapeutic efficacy. The ongoing development of advanced algorithms for data interpretation will further democratize access to sophisticated brain insights. Strategic opportunities lie in forging stronger collaborations between device manufacturers, healthcare providers, and academic researchers to expedite clinical translation and establish fNIRS as a standard diagnostic tool for a wider range of conditions, ultimately contributing to improved patient outcomes and enhanced brain health across populations. The market is projected to see substantial growth in the coming years, with estimated market value of USD 3,500 Million by 2033.
Functional Near-infrared Optical Brain Imaging Market Segmentation
-
1. Application Type
- 1.1. Parkinson's Disease
- 1.2. Epilepsy
- 1.3. Dementia
- 1.4. Traumatic Brain Injury
- 1.5. Sleep Disorders
- 1.6. Other Application Types
-
2. End-User
- 2.1. Hospitals
- 2.2. Diagnostic Centers
Functional Near-infrared Optical Brain Imaging Market Segmentation By Geography
-
1. North America
- 1.1. United States
- 1.2. Canada
- 1.3. Mexico
-
2. Europe
- 2.1. Germany
- 2.2. United Kingdom
- 2.3. France
- 2.4. Italy
- 2.5. Spain
- 2.6. Rest of Europe
-
3. Asia Pacific
- 3.1. China
- 3.2. Japan
- 3.3. India
- 3.4. Australia
- 3.5. South Korea
- 3.6. Rest of Asia Pacific
-
4. Middle East and Africa
- 4.1. GCC
- 4.2. South Africa
- 4.3. Rest of Middle East and Africa
-
5. South America
- 5.1. Brazil
- 5.2. Argentina
- 5.3. Rest of South America
Functional Near-infrared Optical Brain Imaging Market Regional Market Share
Geographic Coverage of Functional Near-infrared Optical Brain Imaging Market
Functional Near-infrared Optical Brain Imaging Market REPORT HIGHLIGHTS
| Aspects | Details |
|---|---|
| Study Period | 2020-2034 |
| Base Year | 2025 |
| Estimated Year | 2026 |
| Forecast Period | 2026-2034 |
| Historical Period | 2020-2025 |
| Growth Rate | CAGR of 13.4% from 2020-2034 |
| Segmentation |
|
Table of Contents
- 1. Introduction
- 1.1. Research Scope
- 1.2. Market Segmentation
- 1.3. Research Methodology
- 1.4. Definitions and Assumptions
- 2. Executive Summary
- 2.1. Introduction
- 3. Market Dynamics
- 3.1. Introduction
- 3.2. Market Drivers
- 3.2.1. Rising Prevalence of Neurological Disorders; Emerging Trends in Products
- 3.3. Market Restrains
- 3.3.1. Lack of Skilled Professionals
- 3.4. Market Trends
- 3.4.1. Traumatic Brain Injury Segment Expects to Register a Strong Growth in the Forecast Period
- 4. Market Factor Analysis
- 4.1. Porters Five Forces
- 4.2. Supply/Value Chain
- 4.3. PESTEL analysis
- 4.4. Market Entropy
- 4.5. Patent/Trademark Analysis
- 5. Global Functional Near-infrared Optical Brain Imaging Market Analysis, Insights and Forecast, 2020-2032
- 5.1. Market Analysis, Insights and Forecast - by Application Type
- 5.1.1. Parkinson's Disease
- 5.1.2. Epilepsy
- 5.1.3. Dementia
- 5.1.4. Traumatic Brain Injury
- 5.1.5. Sleep Disorders
- 5.1.6. Other Application Types
- 5.2. Market Analysis, Insights and Forecast - by End-User
- 5.2.1. Hospitals
- 5.2.2. Diagnostic Centers
- 5.3. Market Analysis, Insights and Forecast - by Region
- 5.3.1. North America
- 5.3.2. Europe
- 5.3.3. Asia Pacific
- 5.3.4. Middle East and Africa
- 5.3.5. South America
- 5.1. Market Analysis, Insights and Forecast - by Application Type
- 6. North America Functional Near-infrared Optical Brain Imaging Market Analysis, Insights and Forecast, 2020-2032
- 6.1. Market Analysis, Insights and Forecast - by Application Type
- 6.1.1. Parkinson's Disease
- 6.1.2. Epilepsy
- 6.1.3. Dementia
- 6.1.4. Traumatic Brain Injury
- 6.1.5. Sleep Disorders
- 6.1.6. Other Application Types
- 6.2. Market Analysis, Insights and Forecast - by End-User
- 6.2.1. Hospitals
- 6.2.2. Diagnostic Centers
- 6.1. Market Analysis, Insights and Forecast - by Application Type
- 7. Europe Functional Near-infrared Optical Brain Imaging Market Analysis, Insights and Forecast, 2020-2032
- 7.1. Market Analysis, Insights and Forecast - by Application Type
- 7.1.1. Parkinson's Disease
- 7.1.2. Epilepsy
- 7.1.3. Dementia
- 7.1.4. Traumatic Brain Injury
- 7.1.5. Sleep Disorders
- 7.1.6. Other Application Types
- 7.2. Market Analysis, Insights and Forecast - by End-User
- 7.2.1. Hospitals
- 7.2.2. Diagnostic Centers
- 7.1. Market Analysis, Insights and Forecast - by Application Type
- 8. Asia Pacific Functional Near-infrared Optical Brain Imaging Market Analysis, Insights and Forecast, 2020-2032
- 8.1. Market Analysis, Insights and Forecast - by Application Type
- 8.1.1. Parkinson's Disease
- 8.1.2. Epilepsy
- 8.1.3. Dementia
- 8.1.4. Traumatic Brain Injury
- 8.1.5. Sleep Disorders
- 8.1.6. Other Application Types
- 8.2. Market Analysis, Insights and Forecast - by End-User
- 8.2.1. Hospitals
- 8.2.2. Diagnostic Centers
- 8.1. Market Analysis, Insights and Forecast - by Application Type
- 9. Middle East and Africa Functional Near-infrared Optical Brain Imaging Market Analysis, Insights and Forecast, 2020-2032
- 9.1. Market Analysis, Insights and Forecast - by Application Type
- 9.1.1. Parkinson's Disease
- 9.1.2. Epilepsy
- 9.1.3. Dementia
- 9.1.4. Traumatic Brain Injury
- 9.1.5. Sleep Disorders
- 9.1.6. Other Application Types
- 9.2. Market Analysis, Insights and Forecast - by End-User
- 9.2.1. Hospitals
- 9.2.2. Diagnostic Centers
- 9.1. Market Analysis, Insights and Forecast - by Application Type
- 10. South America Functional Near-infrared Optical Brain Imaging Market Analysis, Insights and Forecast, 2020-2032
- 10.1. Market Analysis, Insights and Forecast - by Application Type
- 10.1.1. Parkinson's Disease
- 10.1.2. Epilepsy
- 10.1.3. Dementia
- 10.1.4. Traumatic Brain Injury
- 10.1.5. Sleep Disorders
- 10.1.6. Other Application Types
- 10.2. Market Analysis, Insights and Forecast - by End-User
- 10.2.1. Hospitals
- 10.2.2. Diagnostic Centers
- 10.1. Market Analysis, Insights and Forecast - by Application Type
- 11. Competitive Analysis
- 11.1. Global Market Share Analysis 2025
- 11.2. Company Profiles
- 11.2.1 NIRx Medical Technologies LLC
- 11.2.1.1. Overview
- 11.2.1.2. Products
- 11.2.1.3. SWOT Analysis
- 11.2.1.4. Recent Developments
- 11.2.1.5. Financials (Based on Availability)
- 11.2.2 Biopac Systems Inc
- 11.2.2.1. Overview
- 11.2.2.2. Products
- 11.2.2.3. SWOT Analysis
- 11.2.2.4. Recent Developments
- 11.2.2.5. Financials (Based on Availability)
- 11.2.3 Artinis Medical Systems
- 11.2.3.1. Overview
- 11.2.3.2. Products
- 11.2.3.3. SWOT Analysis
- 11.2.3.4. Recent Developments
- 11.2.3.5. Financials (Based on Availability)
- 11.2.4 Oxford Instruments
- 11.2.4.1. Overview
- 11.2.4.2. Products
- 11.2.4.3. SWOT Analysis
- 11.2.4.4. Recent Developments
- 11.2.4.5. Financials (Based on Availability)
- 11.2.5 Soterix Medical Inc
- 11.2.5.1. Overview
- 11.2.5.2. Products
- 11.2.5.3. SWOT Analysis
- 11.2.5.4. Recent Developments
- 11.2.5.5. Financials (Based on Availability)
- 11.2.6 Gowerlabs Ltd
- 11.2.6.1. Overview
- 11.2.6.2. Products
- 11.2.6.3. SWOT Analysis
- 11.2.6.4. Recent Developments
- 11.2.6.5. Financials (Based on Availability)
- 11.2.7 Fujifilm Holdings Corporation (Hitachi Ltd )
- 11.2.7.1. Overview
- 11.2.7.2. Products
- 11.2.7.3. SWOT Analysis
- 11.2.7.4. Recent Developments
- 11.2.7.5. Financials (Based on Availability)
- 11.2.8 PerkinElmer Inc
- 11.2.8.1. Overview
- 11.2.8.2. Products
- 11.2.8.3. SWOT Analysis
- 11.2.8.4. Recent Developments
- 11.2.8.5. Financials (Based on Availability)
- 11.2.9 Shimadzu Corporation
- 11.2.9.1. Overview
- 11.2.9.2. Products
- 11.2.9.3. SWOT Analysis
- 11.2.9.4. Recent Developments
- 11.2.9.5. Financials (Based on Availability)
- 11.2.1 NIRx Medical Technologies LLC
List of Figures
- Figure 1: Global Functional Near-infrared Optical Brain Imaging Market Revenue Breakdown (undefined, %) by Region 2025 & 2033
- Figure 2: Global Functional Near-infrared Optical Brain Imaging Market Volume Breakdown (K Unit, %) by Region 2025 & 2033
- Figure 3: North America Functional Near-infrared Optical Brain Imaging Market Revenue (undefined), by Application Type 2025 & 2033
- Figure 4: North America Functional Near-infrared Optical Brain Imaging Market Volume (K Unit), by Application Type 2025 & 2033
- Figure 5: North America Functional Near-infrared Optical Brain Imaging Market Revenue Share (%), by Application Type 2025 & 2033
- Figure 6: North America Functional Near-infrared Optical Brain Imaging Market Volume Share (%), by Application Type 2025 & 2033
- Figure 7: North America Functional Near-infrared Optical Brain Imaging Market Revenue (undefined), by End-User 2025 & 2033
- Figure 8: North America Functional Near-infrared Optical Brain Imaging Market Volume (K Unit), by End-User 2025 & 2033
- Figure 9: North America Functional Near-infrared Optical Brain Imaging Market Revenue Share (%), by End-User 2025 & 2033
- Figure 10: North America Functional Near-infrared Optical Brain Imaging Market Volume Share (%), by End-User 2025 & 2033
- Figure 11: North America Functional Near-infrared Optical Brain Imaging Market Revenue (undefined), by Country 2025 & 2033
- Figure 12: North America Functional Near-infrared Optical Brain Imaging Market Volume (K Unit), by Country 2025 & 2033
- Figure 13: North America Functional Near-infrared Optical Brain Imaging Market Revenue Share (%), by Country 2025 & 2033
- Figure 14: North America Functional Near-infrared Optical Brain Imaging Market Volume Share (%), by Country 2025 & 2033
- Figure 15: Europe Functional Near-infrared Optical Brain Imaging Market Revenue (undefined), by Application Type 2025 & 2033
- Figure 16: Europe Functional Near-infrared Optical Brain Imaging Market Volume (K Unit), by Application Type 2025 & 2033
- Figure 17: Europe Functional Near-infrared Optical Brain Imaging Market Revenue Share (%), by Application Type 2025 & 2033
- Figure 18: Europe Functional Near-infrared Optical Brain Imaging Market Volume Share (%), by Application Type 2025 & 2033
- Figure 19: Europe Functional Near-infrared Optical Brain Imaging Market Revenue (undefined), by End-User 2025 & 2033
- Figure 20: Europe Functional Near-infrared Optical Brain Imaging Market Volume (K Unit), by End-User 2025 & 2033
- Figure 21: Europe Functional Near-infrared Optical Brain Imaging Market Revenue Share (%), by End-User 2025 & 2033
- Figure 22: Europe Functional Near-infrared Optical Brain Imaging Market Volume Share (%), by End-User 2025 & 2033
- Figure 23: Europe Functional Near-infrared Optical Brain Imaging Market Revenue (undefined), by Country 2025 & 2033
- Figure 24: Europe Functional Near-infrared Optical Brain Imaging Market Volume (K Unit), by Country 2025 & 2033
- Figure 25: Europe Functional Near-infrared Optical Brain Imaging Market Revenue Share (%), by Country 2025 & 2033
- Figure 26: Europe Functional Near-infrared Optical Brain Imaging Market Volume Share (%), by Country 2025 & 2033
- Figure 27: Asia Pacific Functional Near-infrared Optical Brain Imaging Market Revenue (undefined), by Application Type 2025 & 2033
- Figure 28: Asia Pacific Functional Near-infrared Optical Brain Imaging Market Volume (K Unit), by Application Type 2025 & 2033
- Figure 29: Asia Pacific Functional Near-infrared Optical Brain Imaging Market Revenue Share (%), by Application Type 2025 & 2033
- Figure 30: Asia Pacific Functional Near-infrared Optical Brain Imaging Market Volume Share (%), by Application Type 2025 & 2033
- Figure 31: Asia Pacific Functional Near-infrared Optical Brain Imaging Market Revenue (undefined), by End-User 2025 & 2033
- Figure 32: Asia Pacific Functional Near-infrared Optical Brain Imaging Market Volume (K Unit), by End-User 2025 & 2033
- Figure 33: Asia Pacific Functional Near-infrared Optical Brain Imaging Market Revenue Share (%), by End-User 2025 & 2033
- Figure 34: Asia Pacific Functional Near-infrared Optical Brain Imaging Market Volume Share (%), by End-User 2025 & 2033
- Figure 35: Asia Pacific Functional Near-infrared Optical Brain Imaging Market Revenue (undefined), by Country 2025 & 2033
- Figure 36: Asia Pacific Functional Near-infrared Optical Brain Imaging Market Volume (K Unit), by Country 2025 & 2033
- Figure 37: Asia Pacific Functional Near-infrared Optical Brain Imaging Market Revenue Share (%), by Country 2025 & 2033
- Figure 38: Asia Pacific Functional Near-infrared Optical Brain Imaging Market Volume Share (%), by Country 2025 & 2033
- Figure 39: Middle East and Africa Functional Near-infrared Optical Brain Imaging Market Revenue (undefined), by Application Type 2025 & 2033
- Figure 40: Middle East and Africa Functional Near-infrared Optical Brain Imaging Market Volume (K Unit), by Application Type 2025 & 2033
- Figure 41: Middle East and Africa Functional Near-infrared Optical Brain Imaging Market Revenue Share (%), by Application Type 2025 & 2033
- Figure 42: Middle East and Africa Functional Near-infrared Optical Brain Imaging Market Volume Share (%), by Application Type 2025 & 2033
- Figure 43: Middle East and Africa Functional Near-infrared Optical Brain Imaging Market Revenue (undefined), by End-User 2025 & 2033
- Figure 44: Middle East and Africa Functional Near-infrared Optical Brain Imaging Market Volume (K Unit), by End-User 2025 & 2033
- Figure 45: Middle East and Africa Functional Near-infrared Optical Brain Imaging Market Revenue Share (%), by End-User 2025 & 2033
- Figure 46: Middle East and Africa Functional Near-infrared Optical Brain Imaging Market Volume Share (%), by End-User 2025 & 2033
- Figure 47: Middle East and Africa Functional Near-infrared Optical Brain Imaging Market Revenue (undefined), by Country 2025 & 2033
- Figure 48: Middle East and Africa Functional Near-infrared Optical Brain Imaging Market Volume (K Unit), by Country 2025 & 2033
- Figure 49: Middle East and Africa Functional Near-infrared Optical Brain Imaging Market Revenue Share (%), by Country 2025 & 2033
- Figure 50: Middle East and Africa Functional Near-infrared Optical Brain Imaging Market Volume Share (%), by Country 2025 & 2033
- Figure 51: South America Functional Near-infrared Optical Brain Imaging Market Revenue (undefined), by Application Type 2025 & 2033
- Figure 52: South America Functional Near-infrared Optical Brain Imaging Market Volume (K Unit), by Application Type 2025 & 2033
- Figure 53: South America Functional Near-infrared Optical Brain Imaging Market Revenue Share (%), by Application Type 2025 & 2033
- Figure 54: South America Functional Near-infrared Optical Brain Imaging Market Volume Share (%), by Application Type 2025 & 2033
- Figure 55: South America Functional Near-infrared Optical Brain Imaging Market Revenue (undefined), by End-User 2025 & 2033
- Figure 56: South America Functional Near-infrared Optical Brain Imaging Market Volume (K Unit), by End-User 2025 & 2033
- Figure 57: South America Functional Near-infrared Optical Brain Imaging Market Revenue Share (%), by End-User 2025 & 2033
- Figure 58: South America Functional Near-infrared Optical Brain Imaging Market Volume Share (%), by End-User 2025 & 2033
- Figure 59: South America Functional Near-infrared Optical Brain Imaging Market Revenue (undefined), by Country 2025 & 2033
- Figure 60: South America Functional Near-infrared Optical Brain Imaging Market Volume (K Unit), by Country 2025 & 2033
- Figure 61: South America Functional Near-infrared Optical Brain Imaging Market Revenue Share (%), by Country 2025 & 2033
- Figure 62: South America Functional Near-infrared Optical Brain Imaging Market Volume Share (%), by Country 2025 & 2033
List of Tables
- Table 1: Global Functional Near-infrared Optical Brain Imaging Market Revenue undefined Forecast, by Application Type 2020 & 2033
- Table 2: Global Functional Near-infrared Optical Brain Imaging Market Volume K Unit Forecast, by Application Type 2020 & 2033
- Table 3: Global Functional Near-infrared Optical Brain Imaging Market Revenue undefined Forecast, by End-User 2020 & 2033
- Table 4: Global Functional Near-infrared Optical Brain Imaging Market Volume K Unit Forecast, by End-User 2020 & 2033
- Table 5: Global Functional Near-infrared Optical Brain Imaging Market Revenue undefined Forecast, by Region 2020 & 2033
- Table 6: Global Functional Near-infrared Optical Brain Imaging Market Volume K Unit Forecast, by Region 2020 & 2033
- Table 7: Global Functional Near-infrared Optical Brain Imaging Market Revenue undefined Forecast, by Application Type 2020 & 2033
- Table 8: Global Functional Near-infrared Optical Brain Imaging Market Volume K Unit Forecast, by Application Type 2020 & 2033
- Table 9: Global Functional Near-infrared Optical Brain Imaging Market Revenue undefined Forecast, by End-User 2020 & 2033
- Table 10: Global Functional Near-infrared Optical Brain Imaging Market Volume K Unit Forecast, by End-User 2020 & 2033
- Table 11: Global Functional Near-infrared Optical Brain Imaging Market Revenue undefined Forecast, by Country 2020 & 2033
- Table 12: Global Functional Near-infrared Optical Brain Imaging Market Volume K Unit Forecast, by Country 2020 & 2033
- Table 13: United States Functional Near-infrared Optical Brain Imaging Market Revenue (undefined) Forecast, by Application 2020 & 2033
- Table 14: United States Functional Near-infrared Optical Brain Imaging Market Volume (K Unit) Forecast, by Application 2020 & 2033
- Table 15: Canada Functional Near-infrared Optical Brain Imaging Market Revenue (undefined) Forecast, by Application 2020 & 2033
- Table 16: Canada Functional Near-infrared Optical Brain Imaging Market Volume (K Unit) Forecast, by Application 2020 & 2033
- Table 17: Mexico Functional Near-infrared Optical Brain Imaging Market Revenue (undefined) Forecast, by Application 2020 & 2033
- Table 18: Mexico Functional Near-infrared Optical Brain Imaging Market Volume (K Unit) Forecast, by Application 2020 & 2033
- Table 19: Global Functional Near-infrared Optical Brain Imaging Market Revenue undefined Forecast, by Application Type 2020 & 2033
- Table 20: Global Functional Near-infrared Optical Brain Imaging Market Volume K Unit Forecast, by Application Type 2020 & 2033
- Table 21: Global Functional Near-infrared Optical Brain Imaging Market Revenue undefined Forecast, by End-User 2020 & 2033
- Table 22: Global Functional Near-infrared Optical Brain Imaging Market Volume K Unit Forecast, by End-User 2020 & 2033
- Table 23: Global Functional Near-infrared Optical Brain Imaging Market Revenue undefined Forecast, by Country 2020 & 2033
- Table 24: Global Functional Near-infrared Optical Brain Imaging Market Volume K Unit Forecast, by Country 2020 & 2033
- Table 25: Germany Functional Near-infrared Optical Brain Imaging Market Revenue (undefined) Forecast, by Application 2020 & 2033
- Table 26: Germany Functional Near-infrared Optical Brain Imaging Market Volume (K Unit) Forecast, by Application 2020 & 2033
- Table 27: United Kingdom Functional Near-infrared Optical Brain Imaging Market Revenue (undefined) Forecast, by Application 2020 & 2033
- Table 28: United Kingdom Functional Near-infrared Optical Brain Imaging Market Volume (K Unit) Forecast, by Application 2020 & 2033
- Table 29: France Functional Near-infrared Optical Brain Imaging Market Revenue (undefined) Forecast, by Application 2020 & 2033
- Table 30: France Functional Near-infrared Optical Brain Imaging Market Volume (K Unit) Forecast, by Application 2020 & 2033
- Table 31: Italy Functional Near-infrared Optical Brain Imaging Market Revenue (undefined) Forecast, by Application 2020 & 2033
- Table 32: Italy Functional Near-infrared Optical Brain Imaging Market Volume (K Unit) Forecast, by Application 2020 & 2033
- Table 33: Spain Functional Near-infrared Optical Brain Imaging Market Revenue (undefined) Forecast, by Application 2020 & 2033
- Table 34: Spain Functional Near-infrared Optical Brain Imaging Market Volume (K Unit) Forecast, by Application 2020 & 2033
- Table 35: Rest of Europe Functional Near-infrared Optical Brain Imaging Market Revenue (undefined) Forecast, by Application 2020 & 2033
- Table 36: Rest of Europe Functional Near-infrared Optical Brain Imaging Market Volume (K Unit) Forecast, by Application 2020 & 2033
- Table 37: Global Functional Near-infrared Optical Brain Imaging Market Revenue undefined Forecast, by Application Type 2020 & 2033
- Table 38: Global Functional Near-infrared Optical Brain Imaging Market Volume K Unit Forecast, by Application Type 2020 & 2033
- Table 39: Global Functional Near-infrared Optical Brain Imaging Market Revenue undefined Forecast, by End-User 2020 & 2033
- Table 40: Global Functional Near-infrared Optical Brain Imaging Market Volume K Unit Forecast, by End-User 2020 & 2033
- Table 41: Global Functional Near-infrared Optical Brain Imaging Market Revenue undefined Forecast, by Country 2020 & 2033
- Table 42: Global Functional Near-infrared Optical Brain Imaging Market Volume K Unit Forecast, by Country 2020 & 2033
- Table 43: China Functional Near-infrared Optical Brain Imaging Market Revenue (undefined) Forecast, by Application 2020 & 2033
- Table 44: China Functional Near-infrared Optical Brain Imaging Market Volume (K Unit) Forecast, by Application 2020 & 2033
- Table 45: Japan Functional Near-infrared Optical Brain Imaging Market Revenue (undefined) Forecast, by Application 2020 & 2033
- Table 46: Japan Functional Near-infrared Optical Brain Imaging Market Volume (K Unit) Forecast, by Application 2020 & 2033
- Table 47: India Functional Near-infrared Optical Brain Imaging Market Revenue (undefined) Forecast, by Application 2020 & 2033
- Table 48: India Functional Near-infrared Optical Brain Imaging Market Volume (K Unit) Forecast, by Application 2020 & 2033
- Table 49: Australia Functional Near-infrared Optical Brain Imaging Market Revenue (undefined) Forecast, by Application 2020 & 2033
- Table 50: Australia Functional Near-infrared Optical Brain Imaging Market Volume (K Unit) Forecast, by Application 2020 & 2033
- Table 51: South Korea Functional Near-infrared Optical Brain Imaging Market Revenue (undefined) Forecast, by Application 2020 & 2033
- Table 52: South Korea Functional Near-infrared Optical Brain Imaging Market Volume (K Unit) Forecast, by Application 2020 & 2033
- Table 53: Rest of Asia Pacific Functional Near-infrared Optical Brain Imaging Market Revenue (undefined) Forecast, by Application 2020 & 2033
- Table 54: Rest of Asia Pacific Functional Near-infrared Optical Brain Imaging Market Volume (K Unit) Forecast, by Application 2020 & 2033
- Table 55: Global Functional Near-infrared Optical Brain Imaging Market Revenue undefined Forecast, by Application Type 2020 & 2033
- Table 56: Global Functional Near-infrared Optical Brain Imaging Market Volume K Unit Forecast, by Application Type 2020 & 2033
- Table 57: Global Functional Near-infrared Optical Brain Imaging Market Revenue undefined Forecast, by End-User 2020 & 2033
- Table 58: Global Functional Near-infrared Optical Brain Imaging Market Volume K Unit Forecast, by End-User 2020 & 2033
- Table 59: Global Functional Near-infrared Optical Brain Imaging Market Revenue undefined Forecast, by Country 2020 & 2033
- Table 60: Global Functional Near-infrared Optical Brain Imaging Market Volume K Unit Forecast, by Country 2020 & 2033
- Table 61: GCC Functional Near-infrared Optical Brain Imaging Market Revenue (undefined) Forecast, by Application 2020 & 2033
- Table 62: GCC Functional Near-infrared Optical Brain Imaging Market Volume (K Unit) Forecast, by Application 2020 & 2033
- Table 63: South Africa Functional Near-infrared Optical Brain Imaging Market Revenue (undefined) Forecast, by Application 2020 & 2033
- Table 64: South Africa Functional Near-infrared Optical Brain Imaging Market Volume (K Unit) Forecast, by Application 2020 & 2033
- Table 65: Rest of Middle East and Africa Functional Near-infrared Optical Brain Imaging Market Revenue (undefined) Forecast, by Application 2020 & 2033
- Table 66: Rest of Middle East and Africa Functional Near-infrared Optical Brain Imaging Market Volume (K Unit) Forecast, by Application 2020 & 2033
- Table 67: Global Functional Near-infrared Optical Brain Imaging Market Revenue undefined Forecast, by Application Type 2020 & 2033
- Table 68: Global Functional Near-infrared Optical Brain Imaging Market Volume K Unit Forecast, by Application Type 2020 & 2033
- Table 69: Global Functional Near-infrared Optical Brain Imaging Market Revenue undefined Forecast, by End-User 2020 & 2033
- Table 70: Global Functional Near-infrared Optical Brain Imaging Market Volume K Unit Forecast, by End-User 2020 & 2033
- Table 71: Global Functional Near-infrared Optical Brain Imaging Market Revenue undefined Forecast, by Country 2020 & 2033
- Table 72: Global Functional Near-infrared Optical Brain Imaging Market Volume K Unit Forecast, by Country 2020 & 2033
- Table 73: Brazil Functional Near-infrared Optical Brain Imaging Market Revenue (undefined) Forecast, by Application 2020 & 2033
- Table 74: Brazil Functional Near-infrared Optical Brain Imaging Market Volume (K Unit) Forecast, by Application 2020 & 2033
- Table 75: Argentina Functional Near-infrared Optical Brain Imaging Market Revenue (undefined) Forecast, by Application 2020 & 2033
- Table 76: Argentina Functional Near-infrared Optical Brain Imaging Market Volume (K Unit) Forecast, by Application 2020 & 2033
- Table 77: Rest of South America Functional Near-infrared Optical Brain Imaging Market Revenue (undefined) Forecast, by Application 2020 & 2033
- Table 78: Rest of South America Functional Near-infrared Optical Brain Imaging Market Volume (K Unit) Forecast, by Application 2020 & 2033
Frequently Asked Questions
1. What is the projected Compound Annual Growth Rate (CAGR) of the Functional Near-infrared Optical Brain Imaging Market?
The projected CAGR is approximately 13.4%.
2. Which companies are prominent players in the Functional Near-infrared Optical Brain Imaging Market?
Key companies in the market include NIRx Medical Technologies LLC, Biopac Systems Inc, Artinis Medical Systems, Oxford Instruments, Soterix Medical Inc, Gowerlabs Ltd, Fujifilm Holdings Corporation (Hitachi Ltd ), PerkinElmer Inc, Shimadzu Corporation.
3. What are the main segments of the Functional Near-infrared Optical Brain Imaging Market?
The market segments include Application Type, End-User.
4. Can you provide details about the market size?
The market size is estimated to be USD XXX N/A as of 2022.
5. What are some drivers contributing to market growth?
Rising Prevalence of Neurological Disorders; Emerging Trends in Products.
6. What are the notable trends driving market growth?
Traumatic Brain Injury Segment Expects to Register a Strong Growth in the Forecast Period.
7. Are there any restraints impacting market growth?
Lack of Skilled Professionals.
8. Can you provide examples of recent developments in the market?
March 2022: Kernel, a neurotechnology company, developed a wearable headset device, Kernel Flow, for brain measurement which was based on time-domain functional near-infrared spectroscopy (TD-fNIRS), which enables accurate, high-resolution measurement of the brain and its functions by emitting picosecond pulses of light into tissue and measuring the arrival times of single photons. The device weighs 2.05 kg and contains 52 modules arranged in four plates that fit on either side of the head.
9. What pricing options are available for accessing the report?
Pricing options include single-user, multi-user, and enterprise licenses priced at USD 4750, USD 5250, and USD 8750 respectively.
10. Is the market size provided in terms of value or volume?
The market size is provided in terms of value, measured in N/A and volume, measured in K Unit.
11. Are there any specific market keywords associated with the report?
Yes, the market keyword associated with the report is "Functional Near-infrared Optical Brain Imaging Market," which aids in identifying and referencing the specific market segment covered.
12. How do I determine which pricing option suits my needs best?
The pricing options vary based on user requirements and access needs. Individual users may opt for single-user licenses, while businesses requiring broader access may choose multi-user or enterprise licenses for cost-effective access to the report.
13. Are there any additional resources or data provided in the Functional Near-infrared Optical Brain Imaging Market report?
While the report offers comprehensive insights, it's advisable to review the specific contents or supplementary materials provided to ascertain if additional resources or data are available.
14. How can I stay updated on further developments or reports in the Functional Near-infrared Optical Brain Imaging Market?
To stay informed about further developments, trends, and reports in the Functional Near-infrared Optical Brain Imaging Market, consider subscribing to industry newsletters, following relevant companies and organizations, or regularly checking reputable industry news sources and publications.
Methodology
Step 1 - Identification of Relevant Samples Size from Population Database


Step 2 - Approaches for Defining Global Market Size (Value, Volume* & Price*)

Note*: In applicable scenarios
Step 3 - Data Sources
Primary Research
- Web Analytics
- Survey Reports
- Research Institute
- Latest Research Reports
- Opinion Leaders
Secondary Research
- Annual Reports
- White Paper
- Latest Press Release
- Industry Association
- Paid Database
- Investor Presentations

Step 4 - Data Triangulation
Involves using different sources of information in order to increase the validity of a study
These sources are likely to be stakeholders in a program - participants, other researchers, program staff, other community members, and so on.
Then we put all data in single framework & apply various statistical tools to find out the dynamic on the market.
During the analysis stage, feedback from the stakeholder groups would be compared to determine areas of agreement as well as areas of divergence