

Key Insights
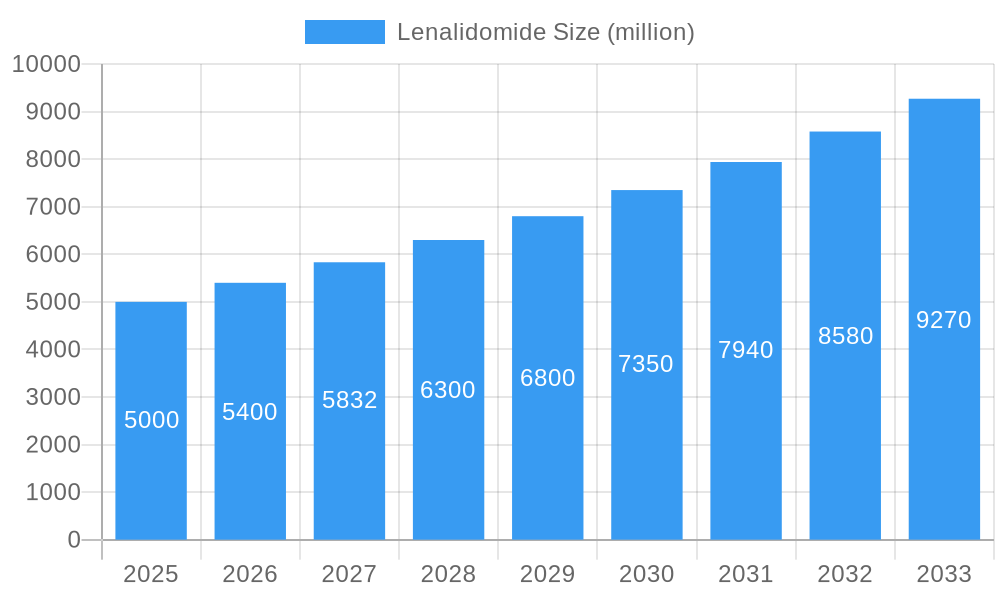
The global Lenalidomide market is projected to reach $14.08 billion by 2025, exhibiting a Compound Annual Growth Rate (CAGR) of 6.6% from 2025 to 2033. This growth is primarily attributed to the rising incidence of multiple myeloma and other hematological malignancies, where Lenalidomide is a critical therapeutic agent. Furthermore, ongoing clinical investigations into new applications and combination therapies are expected to expand market penetration. Advancements in novel formulations and delivery systems also promise to enhance patient adherence and treatment efficacy. However, potential restraints include the introduction of biosimilars, known side effects, and high treatment costs, necessitating strategic market initiatives focused on clinical validation, cost-efficient production, and outcome-driven marketing.
Lenalidomide Market Size (In Billion)
Market segmentation highlights the dominance of the multiple myeloma treatment sector, estimated to account for over 70% of the market value. North America currently leads in market share due to robust healthcare spending and early adoption of advanced treatments. Significant growth is anticipated in Europe and the Asia-Pacific regions, driven by expanding healthcare infrastructure and increasing recognition of Lenalidomide's therapeutic benefits. Leading companies, including Bristol Myers Squibb, are actively investing in research and development to enhance existing products, discover new indications, and secure market leadership. The forecast period (2025-2033) is expected to see substantial expansion, cementing Lenalidomide's importance in oncology treatment.
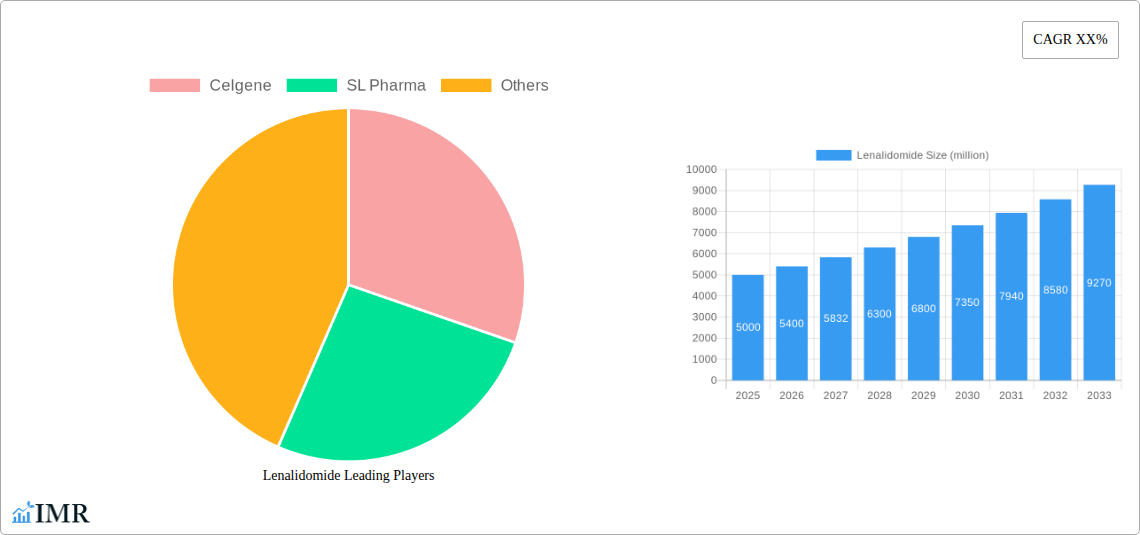
Lenalidomide Company Market Share
Lenalidomide Market Report: A Comprehensive Analysis (2019-2033)
This comprehensive report provides a detailed analysis of the global Lenalidomide market, encompassing market dynamics, growth trends, regional performance, product landscape, key players, and future outlook. The study period covers 2019-2033, with 2025 as the base and estimated year. This report is crucial for industry professionals, investors, and researchers seeking in-depth insights into this vital pharmaceutical segment. The parent market is the multiple myeloma treatment market and the child market is the lenalidomide-based therapies.
Lenalidomide Market Dynamics & Structure
The global Lenalidomide market is characterized by moderate concentration, with key players like Celgene (now part of Bristol Myers Squibb) and SL Pharma holding significant market share. Technological innovation, primarily focused on improving drug delivery and combination therapies, is a crucial driver. Stringent regulatory frameworks govern Lenalidomide's development and approval, impacting market entry and expansion. The market faces competition from other multiple myeloma treatments, impacting its overall growth trajectory. End-user demographics primarily comprise oncology patients, with age and disease severity playing a role in treatment selection. M&A activities have been relatively limited in recent years, xx million USD in total deal value during 2019-2024, reflecting the established nature of the market.
- Market Concentration: Moderately concentrated, with Celgene (Bristol Myers Squibb) and SL Pharma holding xx% and xx% market share respectively in 2025.
- Technological Innovation: Focus on improved drug delivery systems and combination therapies with other anti-cancer agents.
- Regulatory Landscape: Stringent approval processes impacting market entry and expansion.
- Competitive Substitutes: Other multiple myeloma treatments pose competitive pressure.
- End-User Demographics: Oncology patients, with age and disease severity influencing treatment selection.
- M&A Activity: Relatively low activity in recent years with a total deal value of xx million USD between 2019-2024.
Lenalidomide Growth Trends & Insights
The Lenalidomide market experienced a CAGR of xx% during the historical period (2019-2024), reaching a market size of xx million units in 2024. Adoption rates are influenced by factors such as disease prevalence, treatment guidelines, and healthcare infrastructure. Technological advancements, particularly in combination therapies and targeted drug delivery, have fueled market growth. Shifts in consumer behavior, such as increased patient awareness and preference for less toxic treatments, contribute to market dynamics. The forecast period (2025-2033) projects continued growth, driven by an expanding patient pool and ongoing research into new applications. Market penetration is expected to reach xx% by 2033.
Dominant Regions, Countries, or Segments in Lenalidomide
North America currently holds the dominant position in the Lenalidomide market, owing to high disease prevalence, well-established healthcare infrastructure, and robust pharmaceutical research. Europe follows as a significant market, driven by similar factors, albeit with varying healthcare systems across different countries. Asia-Pacific shows promising growth potential, driven by rising healthcare expenditure, growing awareness of multiple myeloma, and expanding access to specialized therapies.
- North America: High disease prevalence, advanced healthcare infrastructure, and robust pharmaceutical research drive market dominance.
- Europe: Significant market driven by similar factors as North America, with variations across different healthcare systems.
- Asia-Pacific: Promising growth potential due to rising healthcare expenditure and increasing awareness of multiple myeloma.
Lenalidomide Product Landscape
Lenalidomide is available in various formulations, optimized for different administration routes and treatment regimens. Innovations focus on improving efficacy, reducing side effects, and enhancing patient compliance. Key performance metrics include response rates, progression-free survival, and overall survival. Unique selling propositions center around its efficacy in treating multiple myeloma and other hematological malignancies. Technological advancements include the development of more targeted delivery systems to minimize side effects.
Key Drivers, Barriers & Challenges in Lenalidomide
Key Drivers: Rising prevalence of multiple myeloma, technological advancements in drug delivery and combination therapies, and increasing healthcare expenditure are major drivers of market growth. Favorable regulatory approvals and growing physician awareness further contribute to market expansion.
Key Barriers & Challenges: High treatment costs, potential side effects limiting patient access, and competition from alternative therapies pose significant challenges. Supply chain disruptions and evolving regulatory landscapes also create uncertainty. The competitive landscape, with the emergence of novel therapies, presents a significant challenge. The market faces a xx% reduction in growth projection due to these challenges.
Emerging Opportunities in Lenalidomide
Untapped markets in developing countries, coupled with the exploration of Lenalidomide's efficacy in treating other cancers, presents significant opportunities. Innovative applications in combination therapies and personalized medicine approaches further broaden the market's potential. Evolving consumer preferences towards less toxic and more targeted treatments will drive demand for improved formulations and delivery systems.
Growth Accelerators in the Lenalidomide Industry
Technological advancements in targeted drug delivery, along with strategic partnerships for developing combination therapies, will accelerate market growth. Market expansion into emerging economies, driven by increased healthcare accessibility and affordability, will contribute significantly to long-term growth. Continued research and development efforts aimed at improving efficacy and safety profiles are expected to fuel market expansion.
Key Players Shaping the Lenalidomide Market
- Bristol Myers Squibb (Celgene)
- SL Pharma
Notable Milestones in Lenalidomide Sector
- 2019: Launch of a new Lenalidomide formulation with improved bioavailability.
- 2021: Publication of key clinical trial data highlighting improved efficacy in combination therapy.
- 2023: Approval of Lenalidomide for a new indication in a specific patient subgroup.
In-Depth Lenalidomide Market Outlook
The Lenalidomide market is poised for continued growth, driven by ongoing innovation, expanding treatment guidelines, and rising patient populations. Strategic opportunities exist in developing targeted therapies, improving patient access in underserved markets, and forging collaborations for combination therapies. The future of the Lenalidomide market hinges on continuous R&D, regulatory approvals, and effective market penetration strategies. The market is projected to reach xx million units by 2033, exhibiting a CAGR of xx%.
Lenalidomide Segmentation
-
1. Application
- 1.1. Multiple myeloma (MM)
- 1.2. Myelodysplastic syndromes (MDS)
-
2. Types
- 2.1. 5 mg Capsules
- 2.2. 10 mg Capsules
- 2.3. 15 mg Capsules
- 2.4. 25 mg Capsules
Lenalidomide Segmentation By Geography
-
1. North America
- 1.1. United States
- 1.2. Canada
- 1.3. Mexico
-
2. South America
- 2.1. Brazil
- 2.2. Argentina
- 2.3. Rest of South America
-
3. Europe
- 3.1. United Kingdom
- 3.2. Germany
- 3.3. France
- 3.4. Italy
- 3.5. Spain
- 3.6. Russia
- 3.7. Benelux
- 3.8. Nordics
- 3.9. Rest of Europe
-
4. Middle East & Africa
- 4.1. Turkey
- 4.2. Israel
- 4.3. GCC
- 4.4. North Africa
- 4.5. South Africa
- 4.6. Rest of Middle East & Africa
-
5. Asia Pacific
- 5.1. China
- 5.2. India
- 5.3. Japan
- 5.4. South Korea
- 5.5. ASEAN
- 5.6. Oceania
- 5.7. Rest of Asia Pacific
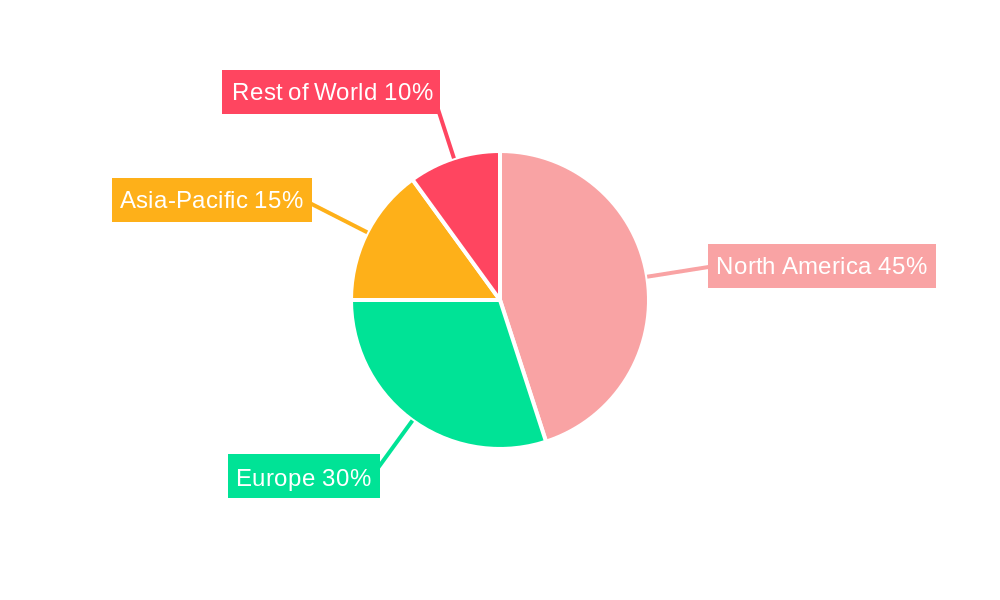
Lenalidomide Regional Market Share
Geographic Coverage of Lenalidomide
Lenalidomide REPORT HIGHLIGHTS
| Aspects | Details |
|---|---|
| Study Period | 2020-2034 |
| Base Year | 2025 |
| Estimated Year | 2026 |
| Forecast Period | 2026-2034 |
| Historical Period | 2020-2025 |
| Growth Rate | CAGR of 6.6% from 2020-2034 |
| Segmentation |
|
Table of Contents
- 1. Introduction
- 1.1. Research Scope
- 1.2. Market Segmentation
- 1.3. Research Methodology
- 1.4. Definitions and Assumptions
- 2. Executive Summary
- 2.1. Introduction
- 3. Market Dynamics
- 3.1. Introduction
- 3.2. Market Drivers
- 3.3. Market Restrains
- 3.4. Market Trends
- 4. Market Factor Analysis
- 4.1. Porters Five Forces
- 4.2. Supply/Value Chain
- 4.3. PESTEL analysis
- 4.4. Market Entropy
- 4.5. Patent/Trademark Analysis
- 5. Global Lenalidomide Analysis, Insights and Forecast, 2020-2032
- 5.1. Market Analysis, Insights and Forecast - by Application
- 5.1.1. Multiple myeloma (MM)
- 5.1.2. Myelodysplastic syndromes (MDS)
- 5.2. Market Analysis, Insights and Forecast - by Types
- 5.2.1. 5 mg Capsules
- 5.2.2. 10 mg Capsules
- 5.2.3. 15 mg Capsules
- 5.2.4. 25 mg Capsules
- 5.3. Market Analysis, Insights and Forecast - by Region
- 5.3.1. North America
- 5.3.2. South America
- 5.3.3. Europe
- 5.3.4. Middle East & Africa
- 5.3.5. Asia Pacific
- 5.1. Market Analysis, Insights and Forecast - by Application
- 6. North America Lenalidomide Analysis, Insights and Forecast, 2020-2032
- 6.1. Market Analysis, Insights and Forecast - by Application
- 6.1.1. Multiple myeloma (MM)
- 6.1.2. Myelodysplastic syndromes (MDS)
- 6.2. Market Analysis, Insights and Forecast - by Types
- 6.2.1. 5 mg Capsules
- 6.2.2. 10 mg Capsules
- 6.2.3. 15 mg Capsules
- 6.2.4. 25 mg Capsules
- 6.1. Market Analysis, Insights and Forecast - by Application
- 7. South America Lenalidomide Analysis, Insights and Forecast, 2020-2032
- 7.1. Market Analysis, Insights and Forecast - by Application
- 7.1.1. Multiple myeloma (MM)
- 7.1.2. Myelodysplastic syndromes (MDS)
- 7.2. Market Analysis, Insights and Forecast - by Types
- 7.2.1. 5 mg Capsules
- 7.2.2. 10 mg Capsules
- 7.2.3. 15 mg Capsules
- 7.2.4. 25 mg Capsules
- 7.1. Market Analysis, Insights and Forecast - by Application
- 8. Europe Lenalidomide Analysis, Insights and Forecast, 2020-2032
- 8.1. Market Analysis, Insights and Forecast - by Application
- 8.1.1. Multiple myeloma (MM)
- 8.1.2. Myelodysplastic syndromes (MDS)
- 8.2. Market Analysis, Insights and Forecast - by Types
- 8.2.1. 5 mg Capsules
- 8.2.2. 10 mg Capsules
- 8.2.3. 15 mg Capsules
- 8.2.4. 25 mg Capsules
- 8.1. Market Analysis, Insights and Forecast - by Application
- 9. Middle East & Africa Lenalidomide Analysis, Insights and Forecast, 2020-2032
- 9.1. Market Analysis, Insights and Forecast - by Application
- 9.1.1. Multiple myeloma (MM)
- 9.1.2. Myelodysplastic syndromes (MDS)
- 9.2. Market Analysis, Insights and Forecast - by Types
- 9.2.1. 5 mg Capsules
- 9.2.2. 10 mg Capsules
- 9.2.3. 15 mg Capsules
- 9.2.4. 25 mg Capsules
- 9.1. Market Analysis, Insights and Forecast - by Application
- 10. Asia Pacific Lenalidomide Analysis, Insights and Forecast, 2020-2032
- 10.1. Market Analysis, Insights and Forecast - by Application
- 10.1.1. Multiple myeloma (MM)
- 10.1.2. Myelodysplastic syndromes (MDS)
- 10.2. Market Analysis, Insights and Forecast - by Types
- 10.2.1. 5 mg Capsules
- 10.2.2. 10 mg Capsules
- 10.2.3. 15 mg Capsules
- 10.2.4. 25 mg Capsules
- 10.1. Market Analysis, Insights and Forecast - by Application
- 11. Competitive Analysis
- 11.1. Global Market Share Analysis 2025
- 11.2. Company Profiles
- 11.2.1 Celgene
- 11.2.1.1. Overview
- 11.2.1.2. Products
- 11.2.1.3. SWOT Analysis
- 11.2.1.4. Recent Developments
- 11.2.1.5. Financials (Based on Availability)
- 11.2.2 SL Pharma
- 11.2.2.1. Overview
- 11.2.2.2. Products
- 11.2.2.3. SWOT Analysis
- 11.2.2.4. Recent Developments
- 11.2.2.5. Financials (Based on Availability)
- 11.2.1 Celgene
List of Figures
- Figure 1: Global Lenalidomide Revenue Breakdown (billion, %) by Region 2025 & 2033
- Figure 2: North America Lenalidomide Revenue (billion), by Application 2025 & 2033
- Figure 3: North America Lenalidomide Revenue Share (%), by Application 2025 & 2033
- Figure 4: North America Lenalidomide Revenue (billion), by Types 2025 & 2033
- Figure 5: North America Lenalidomide Revenue Share (%), by Types 2025 & 2033
- Figure 6: North America Lenalidomide Revenue (billion), by Country 2025 & 2033
- Figure 7: North America Lenalidomide Revenue Share (%), by Country 2025 & 2033
- Figure 8: South America Lenalidomide Revenue (billion), by Application 2025 & 2033
- Figure 9: South America Lenalidomide Revenue Share (%), by Application 2025 & 2033
- Figure 10: South America Lenalidomide Revenue (billion), by Types 2025 & 2033
- Figure 11: South America Lenalidomide Revenue Share (%), by Types 2025 & 2033
- Figure 12: South America Lenalidomide Revenue (billion), by Country 2025 & 2033
- Figure 13: South America Lenalidomide Revenue Share (%), by Country 2025 & 2033
- Figure 14: Europe Lenalidomide Revenue (billion), by Application 2025 & 2033
- Figure 15: Europe Lenalidomide Revenue Share (%), by Application 2025 & 2033
- Figure 16: Europe Lenalidomide Revenue (billion), by Types 2025 & 2033
- Figure 17: Europe Lenalidomide Revenue Share (%), by Types 2025 & 2033
- Figure 18: Europe Lenalidomide Revenue (billion), by Country 2025 & 2033
- Figure 19: Europe Lenalidomide Revenue Share (%), by Country 2025 & 2033
- Figure 20: Middle East & Africa Lenalidomide Revenue (billion), by Application 2025 & 2033
- Figure 21: Middle East & Africa Lenalidomide Revenue Share (%), by Application 2025 & 2033
- Figure 22: Middle East & Africa Lenalidomide Revenue (billion), by Types 2025 & 2033
- Figure 23: Middle East & Africa Lenalidomide Revenue Share (%), by Types 2025 & 2033
- Figure 24: Middle East & Africa Lenalidomide Revenue (billion), by Country 2025 & 2033
- Figure 25: Middle East & Africa Lenalidomide Revenue Share (%), by Country 2025 & 2033
- Figure 26: Asia Pacific Lenalidomide Revenue (billion), by Application 2025 & 2033
- Figure 27: Asia Pacific Lenalidomide Revenue Share (%), by Application 2025 & 2033
- Figure 28: Asia Pacific Lenalidomide Revenue (billion), by Types 2025 & 2033
- Figure 29: Asia Pacific Lenalidomide Revenue Share (%), by Types 2025 & 2033
- Figure 30: Asia Pacific Lenalidomide Revenue (billion), by Country 2025 & 2033
- Figure 31: Asia Pacific Lenalidomide Revenue Share (%), by Country 2025 & 2033
List of Tables
- Table 1: Global Lenalidomide Revenue billion Forecast, by Application 2020 & 2033
- Table 2: Global Lenalidomide Revenue billion Forecast, by Types 2020 & 2033
- Table 3: Global Lenalidomide Revenue billion Forecast, by Region 2020 & 2033
- Table 4: Global Lenalidomide Revenue billion Forecast, by Application 2020 & 2033
- Table 5: Global Lenalidomide Revenue billion Forecast, by Types 2020 & 2033
- Table 6: Global Lenalidomide Revenue billion Forecast, by Country 2020 & 2033
- Table 7: United States Lenalidomide Revenue (billion) Forecast, by Application 2020 & 2033
- Table 8: Canada Lenalidomide Revenue (billion) Forecast, by Application 2020 & 2033
- Table 9: Mexico Lenalidomide Revenue (billion) Forecast, by Application 2020 & 2033
- Table 10: Global Lenalidomide Revenue billion Forecast, by Application 2020 & 2033
- Table 11: Global Lenalidomide Revenue billion Forecast, by Types 2020 & 2033
- Table 12: Global Lenalidomide Revenue billion Forecast, by Country 2020 & 2033
- Table 13: Brazil Lenalidomide Revenue (billion) Forecast, by Application 2020 & 2033
- Table 14: Argentina Lenalidomide Revenue (billion) Forecast, by Application 2020 & 2033
- Table 15: Rest of South America Lenalidomide Revenue (billion) Forecast, by Application 2020 & 2033
- Table 16: Global Lenalidomide Revenue billion Forecast, by Application 2020 & 2033
- Table 17: Global Lenalidomide Revenue billion Forecast, by Types 2020 & 2033
- Table 18: Global Lenalidomide Revenue billion Forecast, by Country 2020 & 2033
- Table 19: United Kingdom Lenalidomide Revenue (billion) Forecast, by Application 2020 & 2033
- Table 20: Germany Lenalidomide Revenue (billion) Forecast, by Application 2020 & 2033
- Table 21: France Lenalidomide Revenue (billion) Forecast, by Application 2020 & 2033
- Table 22: Italy Lenalidomide Revenue (billion) Forecast, by Application 2020 & 2033
- Table 23: Spain Lenalidomide Revenue (billion) Forecast, by Application 2020 & 2033
- Table 24: Russia Lenalidomide Revenue (billion) Forecast, by Application 2020 & 2033
- Table 25: Benelux Lenalidomide Revenue (billion) Forecast, by Application 2020 & 2033
- Table 26: Nordics Lenalidomide Revenue (billion) Forecast, by Application 2020 & 2033
- Table 27: Rest of Europe Lenalidomide Revenue (billion) Forecast, by Application 2020 & 2033
- Table 28: Global Lenalidomide Revenue billion Forecast, by Application 2020 & 2033
- Table 29: Global Lenalidomide Revenue billion Forecast, by Types 2020 & 2033
- Table 30: Global Lenalidomide Revenue billion Forecast, by Country 2020 & 2033
- Table 31: Turkey Lenalidomide Revenue (billion) Forecast, by Application 2020 & 2033
- Table 32: Israel Lenalidomide Revenue (billion) Forecast, by Application 2020 & 2033
- Table 33: GCC Lenalidomide Revenue (billion) Forecast, by Application 2020 & 2033
- Table 34: North Africa Lenalidomide Revenue (billion) Forecast, by Application 2020 & 2033
- Table 35: South Africa Lenalidomide Revenue (billion) Forecast, by Application 2020 & 2033
- Table 36: Rest of Middle East & Africa Lenalidomide Revenue (billion) Forecast, by Application 2020 & 2033
- Table 37: Global Lenalidomide Revenue billion Forecast, by Application 2020 & 2033
- Table 38: Global Lenalidomide Revenue billion Forecast, by Types 2020 & 2033
- Table 39: Global Lenalidomide Revenue billion Forecast, by Country 2020 & 2033
- Table 40: China Lenalidomide Revenue (billion) Forecast, by Application 2020 & 2033
- Table 41: India Lenalidomide Revenue (billion) Forecast, by Application 2020 & 2033
- Table 42: Japan Lenalidomide Revenue (billion) Forecast, by Application 2020 & 2033
- Table 43: South Korea Lenalidomide Revenue (billion) Forecast, by Application 2020 & 2033
- Table 44: ASEAN Lenalidomide Revenue (billion) Forecast, by Application 2020 & 2033
- Table 45: Oceania Lenalidomide Revenue (billion) Forecast, by Application 2020 & 2033
- Table 46: Rest of Asia Pacific Lenalidomide Revenue (billion) Forecast, by Application 2020 & 2033
Frequently Asked Questions
1. What is the projected Compound Annual Growth Rate (CAGR) of the Lenalidomide?
The projected CAGR is approximately 6.6%.
2. Which companies are prominent players in the Lenalidomide?
Key companies in the market include Celgene, SL Pharma.
3. What are the main segments of the Lenalidomide?
The market segments include Application, Types.
4. Can you provide details about the market size?
The market size is estimated to be USD 14.08 billion as of 2022.
5. What are some drivers contributing to market growth?
N/A
6. What are the notable trends driving market growth?
N/A
7. Are there any restraints impacting market growth?
N/A
8. Can you provide examples of recent developments in the market?
N/A
9. What pricing options are available for accessing the report?
Pricing options include single-user, multi-user, and enterprise licenses priced at USD 2900.00, USD 4350.00, and USD 5800.00 respectively.
10. Is the market size provided in terms of value or volume?
The market size is provided in terms of value, measured in billion.
11. Are there any specific market keywords associated with the report?
Yes, the market keyword associated with the report is "Lenalidomide," which aids in identifying and referencing the specific market segment covered.
12. How do I determine which pricing option suits my needs best?
The pricing options vary based on user requirements and access needs. Individual users may opt for single-user licenses, while businesses requiring broader access may choose multi-user or enterprise licenses for cost-effective access to the report.
13. Are there any additional resources or data provided in the Lenalidomide report?
While the report offers comprehensive insights, it's advisable to review the specific contents or supplementary materials provided to ascertain if additional resources or data are available.
14. How can I stay updated on further developments or reports in the Lenalidomide?
To stay informed about further developments, trends, and reports in the Lenalidomide, consider subscribing to industry newsletters, following relevant companies and organizations, or regularly checking reputable industry news sources and publications.
Methodology
Step 1 - Identification of Relevant Samples Size from Population Database


Step 2 - Approaches for Defining Global Market Size (Value, Volume* & Price*)

Note*: In applicable scenarios
Step 3 - Data Sources
Primary Research
- Web Analytics
- Survey Reports
- Research Institute
- Latest Research Reports
- Opinion Leaders
Secondary Research
- Annual Reports
- White Paper
- Latest Press Release
- Industry Association
- Paid Database
- Investor Presentations

Step 4 - Data Triangulation
Involves using different sources of information in order to increase the validity of a study
These sources are likely to be stakeholders in a program - participants, other researchers, program staff, other community members, and so on.
Then we put all data in single framework & apply various statistical tools to find out the dynamic on the market.
During the analysis stage, feedback from the stakeholder groups would be compared to determine areas of agreement as well as areas of divergence