

Key Insights
The MiRNA Sequencing and Assay market is projected for significant expansion, forecasted to reach $382.71 million by 2025, with a robust Compound Annual Growth Rate (CAGR) of 11.51% through 2033. This growth is fueled by increasing adoption of miRNA sequencing for diagnostics and prognostics in oncology, cardiovascular, and neurological diseases. Growing understanding of miRNA's regulatory roles in disease pathogenesis is driving R&D investment. Advancements in sequencing technologies are enhancing accuracy, speed, and cost-effectiveness, making these assays more accessible. The rising prevalence of chronic diseases and demand for personalized medicine are key contributors.
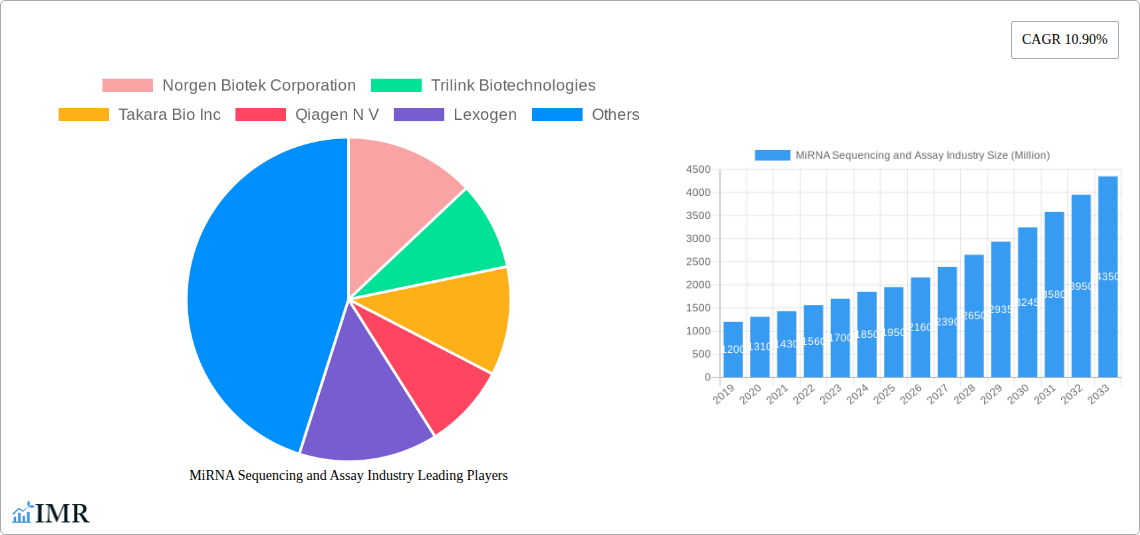
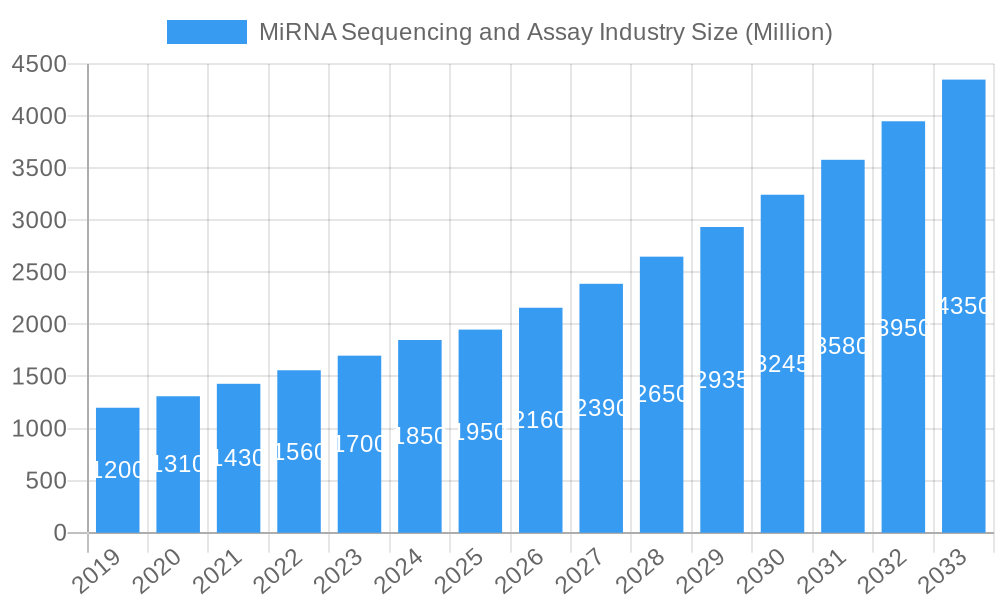
MiRNA Sequencing and Assay Industry Market Size (In Million)
The market is segmented by product type, with Sequencing Consumables and Library Preparation Kits being core components. In terms of technology, Sequencing by Synthesis is expected to lead, while emerging technologies like Nanopore Sequencing offer rapid, real-time analysis. The Clinical Laboratory segment is poised for the highest growth due to increasing integration of miRNA diagnostics into patient care. Life Science Organizations remain significant end-users for research and drug discovery. Geographically, North America leads, followed by Europe and the rapidly growing Asia Pacific region, driven by increased R&D and government support. High initial equipment costs and specialized bioinformatics expertise are being mitigated by technological innovation and a growing talent pool.
MiRNA Sequencing and Assay Industry Company Market Share
This report offers comprehensive insights into the miRNA sequencing and assay market, detailing microRNA profiling, detection technologies, next-generation sequencing (NGS) for miRNA, and liquid biopsy applications. It covers clinical laboratory and life science organization segments, along with product consumables and library preparation kits, providing essential analysis for stakeholders in the biotechnology industry. Key market drivers, restraints, opportunities, and the competitive landscape featuring major players like Thermo Fisher Scientific, Illumina Inc., Qiagen N V, and Oxford Nanopore Technologies are examined.
MiRNA Sequencing and Assay Industry Market Dynamics & Structure
The miRNA sequencing and assay industry exhibits a moderately concentrated market structure, driven by substantial technological innovation and a robust regulatory framework. Key drivers of technological advancement include the increasing demand for biomarker discovery, diagnostic assay development, and personalized medicine. The competitive landscape is characterized by intense R&D efforts and strategic collaborations to refine miRNA analysis platforms and gene silencing technologies. Barriers to innovation are primarily linked to the high cost of sequencing platforms and the complexity of miRNA data interpretation. End-user demographics are shifting, with a growing adoption in cancer diagnostics, neurological disorder research, and cardiovascular disease profiling. Mergers and acquisitions (M&A) are a notable trend, with companies aiming to expand their product portfolios and market reach in the genomics market. For instance, the acquisition of smaller, specialized miRNA service providers by larger corporations is a recurring theme, bolstering market consolidation. The parent market, encompassing broader molecular diagnostics, sees miRNA sequencing as a high-growth niche, contributing approximately $1,500 million to the overall diagnostics market value in 2025, with the child market for specialized miRNA kits and reagents valued at $750 million in the same year.
- Market Concentration: Moderately concentrated, with key players holding significant market share.
- Technological Innovation Drivers: Demand for biomarker discovery, diagnostic assay development, and personalized medicine.
- Regulatory Frameworks: Stringent regulations for diagnostic applications, driving validation and quality control.
- Competitive Product Substitutes: Traditional PCR-based methods, though increasingly being superseded by NGS.
- End-User Demographics: Growing adoption in clinical diagnostics, pharmaceutical R&D, and academic research.
- M&A Trends: Strategic acquisitions to expand portfolios and market presence.
MiRNA Sequencing and Assay Industry Growth Trends & Insights
The miRNA sequencing and assay industry is poised for significant expansion, projected to grow at a Compound Annual Growth Rate (CAGR) of 18.5% from 2025 to 2033. This robust growth trajectory is fueled by escalating adoption rates across various applications, particularly in disease diagnostics and drug discovery. The market size, estimated at $2,500 million in 2025, is expected to reach approximately $8,000 million by 2033. Technological disruptions, such as the advancement of nanopore sequencing and improved sequencing by synthesis chemistries, are lowering costs and increasing throughput, thereby democratizing access to miRNA analysis. Consumer behavior shifts are also playing a crucial role, with researchers and clinicians increasingly prioritizing cost-effective and sensitive miRNA detection methods. The penetration of NGS-based miRNA profiling in clinical laboratories is rapidly increasing, driven by its superior capacity for comprehensive analysis compared to traditional techniques. Furthermore, the growing understanding of miRNA's role in complex diseases like cancer, neurodegenerative disorders, and metabolic syndromes is stimulating demand for advanced miRNA analysis tools. The parent market, encompassing all genomic sequencing services, is projected to reach $30,000 million by 2025, with the miRNA segment representing a substantial and rapidly growing component. The child market for miRNA sequencing reagents alone is expected to grow from $800 million in 2025 to $2,500 million by 2033.
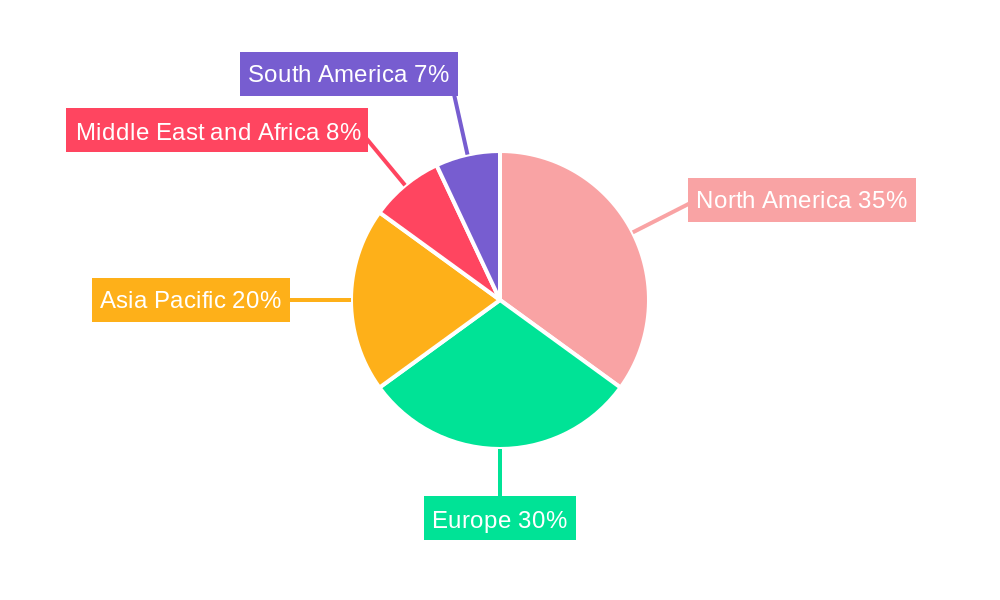
Dominant Regions, Countries, or Segments in MiRNA Sequencing and Assay Industry
North America, particularly the United States, currently dominates the miRNA sequencing and assay industry, driven by its robust healthcare infrastructure, substantial investment in R&D, and a high concentration of leading life science organizations and biotechnology companies. The region's dominance is further bolstered by favorable government funding for genomics research and a proactive approach to adopting new diagnostic technologies. Within the segment landscape, Sequencing Consumables emerges as a significant market driver, estimated to capture 45% of the total market value in 2025, followed by Library Preparation Kits at 35%. This is attributed to the continuous need for reagents and kits for high-throughput sequencing and assay development.
On the technology front, Sequencing by Synthesis remains the leading technology, accounting for 50% of the market share in 2025, owing to its established reliability and widespread adoption by major sequencing platform providers. However, Nanopore Sequencing is rapidly gaining traction due to its potential for real-time analysis and portability.
From an end-user perspective, Clinical Laboratories represent the fastest-growing segment, with an estimated market share of 40% in 2025. This surge is fueled by the increasing application of miRNA profiling in disease diagnosis, prognosis, and treatment monitoring, especially in oncology and infectious diseases.
- Key Regional Drivers (North America):
- Strong government funding for genomics research.
- High adoption rate of advanced sequencing technologies.
- Presence of leading research institutions and pharmaceutical companies.
- Established reimbursement policies for diagnostic tests.
- Dominant Product Segment (Sequencing Consumables):
- High volume usage in routine miRNA sequencing.
- Continuous innovation leading to improved performance and cost-effectiveness.
- Dominant Technology (Sequencing by Synthesis):
- Established market presence and infrastructure.
- High accuracy and throughput capabilities.
- Dominant End User (Clinical Laboratories):
- Increasing demand for miRNA biomarkers in diagnostics.
- Growing application in personalized medicine and companion diagnostics.
MiRNA Sequencing and Assay Industry Product Landscape
The miRNA sequencing and assay industry is characterized by continuous product innovation, with a strong emphasis on enhancing sensitivity, specificity, and workflow efficiency. Key product advancements include the development of more robust and user-friendly library preparation kits that minimize sample input requirements and streamline the workflow for both NGS and targeted miRNA assays. Companies are also focusing on integrated solutions, combining sequencing consumables with advanced bioinformatics software for miRNA data analysis. Unique selling propositions often revolve around reduced assay times, improved detection limits for rare miRNAs, and the ability to profile both miRNA and other small RNA species simultaneously. The application of these products spans from basic research in gene regulation to clinical applications such as cancer diagnostics and the identification of disease biomarkers.
Key Drivers, Barriers & Challenges in MiRNA Sequencing and Assay Industry
Key Drivers:
- Growing understanding of miRNA roles: Increasing scientific evidence linking miRNAs to various physiological and pathological processes fuels demand for their analysis.
- Advancements in sequencing technologies: Development of more accurate, faster, and cost-effective sequencing platforms (e.g., nanopore sequencing) makes miRNA profiling more accessible.
- Increasing applications in diagnostics: Growing use of miRNAs as biomarkers for early disease detection, prognosis, and treatment response monitoring, particularly in oncology and infectious diseases.
- Rise of personalized medicine: The need for tailored treatment strategies based on individual molecular profiles drives the demand for comprehensive genomic analysis, including miRNA profiling.
- Government initiatives and funding: Increased support for genomics research and diagnostics development globally.
Barriers & Challenges:
- High cost of sequencing and analysis: While decreasing, the initial investment in sequencing equipment and the cost of consumables can still be a barrier for some smaller labs.
- Standardization and reproducibility: Lack of universal standards for sample preparation, data analysis, and interpretation can lead to variations in results.
- Complex data interpretation: The intricate nature of miRNA pathways and regulatory networks requires sophisticated bioinformatics tools and expertise for meaningful interpretation.
- Regulatory hurdles: Stringent regulatory requirements for clinical diagnostic assays can slow down the adoption of new miRNA-based tests.
- Competition from established technologies: While NGS is dominant, traditional methods like qPCR still hold a place for specific applications, presenting a degree of competition.
Emerging Opportunities in MiRNA Sequencing and Assay Industry
Emerging opportunities in the miRNA sequencing and assay industry are centered on the expansion of liquid biopsy applications, offering non-invasive methods for disease detection and monitoring. The development of highly multiplexed miRNA assays for simultaneous profiling of multiple disease markers presents a significant growth avenue. Furthermore, the integration of AI and machine learning in miRNA data analysis to identify novel diagnostic and prognostic signatures is an area of immense potential. Untapped markets in veterinary diagnostics and agricultural applications, such as crop improvement and pest resistance, also offer substantial growth prospects. The increasing focus on epigenetics research and the role of non-coding RNAs in health and disease will continue to drive innovation and market expansion.
Growth Accelerators in the MiRNA Sequencing and Assay Industry Industry
Several key catalysts are accelerating growth in the miRNA sequencing and assay industry. Technological breakthroughs, such as the development of CRISPR-based miRNA detection and the continuous improvement in the sensitivity and specificity of NGS platforms, are expanding the application scope. Strategic partnerships between sequencing technology providers, assay developers, and diagnostic companies are crucial for bringing innovative solutions to market faster. Market expansion strategies, including the increasing adoption of outsourced miRNA sequencing services by academic institutions and smaller biotech firms, are also significant growth drivers. The growing global prevalence of chronic diseases and the rising demand for early diagnostic tools are creating a sustained demand for advanced miRNA profiling capabilities.
Key Players Shaping the MiRNA Sequencing and Assay Industry Market
- Norgen Biotek Corporation
- Trilink Biotechnologies
- Takara Bio Inc
- Qiagen N V
- Lexogen
- Oxford Nanopore Technologies
- New England Biolabs Inc
- PerkinElmer Inc
- Illumina Inc
- Thermo Fisher Scientific
Notable Milestones in MiRNA Sequencing and Assay Industry Sector
- April 2022: HTC Molecular Diagnostics Inc. unveiled new features of its proprietary HTG EdgeSeq technology. The company has improved its technology, and now its new sample preparation harmonization enables miRNA and mRNA profiling without the need for additional samples.
- January 2022: Allogene Therapeutics announced a collaboration with Antion Biosciences to advance multiplex gene silencing for the development of next-generation allogeneic CAR T products. As part of the collaboration, Antion's miRNA technology (miCAR) will be used as an additional tool to enhance the efficacy and safety of allogeneic CAR T therapies.
In-Depth MiRNA Sequencing and Assay Industry Market Outlook
The future outlook for the miRNA sequencing and assay industry is exceptionally promising, driven by ongoing technological advancements and expanding clinical utility. Growth accelerators include the continued refinement of high-throughput sequencing technologies, making miRNA profiling more accessible and cost-effective. Strategic collaborations between research institutions, diagnostic companies, and technology providers will be pivotal in translating research discoveries into clinical applications. The burgeoning field of liquid biopsy for early cancer detection and monitoring represents a significant untapped market potential. Furthermore, the increasing demand for personalized medicine and targeted therapies will sustain the need for comprehensive genomic analysis, with miRNAs playing a crucial role as biomarkers. The industry is well-positioned for sustained high growth, offering substantial opportunities for innovation and market leadership.
MiRNA Sequencing and Assay Industry Segmentation
-
1. Product
- 1.1. Sequencing Consumables
- 1.2. Library Preparation Kits
-
2. Technology
- 2.1. Sequencing by Synthesis
- 2.2. Ion Semiconductor
- 2.3. SOLiD
- 2.4. Nanopore Sequencing
-
3. End User
- 3.1. Clinical Laboratory
- 3.2. Life Science Organization
- 3.3. Other End Users
MiRNA Sequencing and Assay Industry Segmentation By Geography
-
1. North America
- 1.1. United States
- 1.2. Canada
- 1.3. Mexico
-
2. Europe
- 2.1. Germany
- 2.2. United Kingdom
- 2.3. France
- 2.4. Italy
- 2.5. Spain
- 2.6. Rest of Europe
-
3. Asia Pacific
- 3.1. China
- 3.2. Japan
- 3.3. India
- 3.4. Australia
- 3.5. South Korea
- 3.6. Rest of Asia Pacific
-
4. Middle East and Africa
- 4.1. GCC
- 4.2. South Africa
- 4.3. Rest of Middle East and Africa
-
5. South America
- 5.1. Brazil
- 5.2. Argentina
- 5.3. Rest of South America
MiRNA Sequencing and Assay Industry Regional Market Share
Geographic Coverage of MiRNA Sequencing and Assay Industry
MiRNA Sequencing and Assay Industry REPORT HIGHLIGHTS
| Aspects | Details |
|---|---|
| Study Period | 2020-2034 |
| Base Year | 2025 |
| Estimated Year | 2026 |
| Forecast Period | 2026-2034 |
| Historical Period | 2020-2025 |
| Growth Rate | CAGR of 11.51% from 2020-2034 |
| Segmentation |
|
Table of Contents
- 1. Introduction
- 1.1. Research Scope
- 1.2. Market Segmentation
- 1.3. Research Methodology
- 1.4. Definitions and Assumptions
- 2. Executive Summary
- 2.1. Introduction
- 3. Market Dynamics
- 3.1. Introduction
- 3.2. Market Drivers
- 3.2.1. MiRNA Sequencing and Assay Sequencing Supremacy Over Other Methods; Increased Research in the Field of Genomics; Reduced Sequencing Costs
- 3.3. Market Restrains
- 3.3.1. Paucity of Expert and Need for Computing Infrastructure
- 3.4. Market Trends
- 3.4.1. Library Preparation Kits are Expected to Hold the Largest Market Share in the miRNA Sequencing and Assay Market
- 4. Market Factor Analysis
- 4.1. Porters Five Forces
- 4.2. Supply/Value Chain
- 4.3. PESTEL analysis
- 4.4. Market Entropy
- 4.5. Patent/Trademark Analysis
- 5. Global MiRNA Sequencing and Assay Industry Analysis, Insights and Forecast, 2020-2032
- 5.1. Market Analysis, Insights and Forecast - by Product
- 5.1.1. Sequencing Consumables
- 5.1.2. Library Preparation Kits
- 5.2. Market Analysis, Insights and Forecast - by Technology
- 5.2.1. Sequencing by Synthesis
- 5.2.2. Ion Semiconductor
- 5.2.3. SOLiD
- 5.2.4. Nanopore Sequencing
- 5.3. Market Analysis, Insights and Forecast - by End User
- 5.3.1. Clinical Laboratory
- 5.3.2. Life Science Organization
- 5.3.3. Other End Users
- 5.4. Market Analysis, Insights and Forecast - by Region
- 5.4.1. North America
- 5.4.2. Europe
- 5.4.3. Asia Pacific
- 5.4.4. Middle East and Africa
- 5.4.5. South America
- 5.1. Market Analysis, Insights and Forecast - by Product
- 6. North America MiRNA Sequencing and Assay Industry Analysis, Insights and Forecast, 2020-2032
- 6.1. Market Analysis, Insights and Forecast - by Product
- 6.1.1. Sequencing Consumables
- 6.1.2. Library Preparation Kits
- 6.2. Market Analysis, Insights and Forecast - by Technology
- 6.2.1. Sequencing by Synthesis
- 6.2.2. Ion Semiconductor
- 6.2.3. SOLiD
- 6.2.4. Nanopore Sequencing
- 6.3. Market Analysis, Insights and Forecast - by End User
- 6.3.1. Clinical Laboratory
- 6.3.2. Life Science Organization
- 6.3.3. Other End Users
- 6.1. Market Analysis, Insights and Forecast - by Product
- 7. Europe MiRNA Sequencing and Assay Industry Analysis, Insights and Forecast, 2020-2032
- 7.1. Market Analysis, Insights and Forecast - by Product
- 7.1.1. Sequencing Consumables
- 7.1.2. Library Preparation Kits
- 7.2. Market Analysis, Insights and Forecast - by Technology
- 7.2.1. Sequencing by Synthesis
- 7.2.2. Ion Semiconductor
- 7.2.3. SOLiD
- 7.2.4. Nanopore Sequencing
- 7.3. Market Analysis, Insights and Forecast - by End User
- 7.3.1. Clinical Laboratory
- 7.3.2. Life Science Organization
- 7.3.3. Other End Users
- 7.1. Market Analysis, Insights and Forecast - by Product
- 8. Asia Pacific MiRNA Sequencing and Assay Industry Analysis, Insights and Forecast, 2020-2032
- 8.1. Market Analysis, Insights and Forecast - by Product
- 8.1.1. Sequencing Consumables
- 8.1.2. Library Preparation Kits
- 8.2. Market Analysis, Insights and Forecast - by Technology
- 8.2.1. Sequencing by Synthesis
- 8.2.2. Ion Semiconductor
- 8.2.3. SOLiD
- 8.2.4. Nanopore Sequencing
- 8.3. Market Analysis, Insights and Forecast - by End User
- 8.3.1. Clinical Laboratory
- 8.3.2. Life Science Organization
- 8.3.3. Other End Users
- 8.1. Market Analysis, Insights and Forecast - by Product
- 9. Middle East and Africa MiRNA Sequencing and Assay Industry Analysis, Insights and Forecast, 2020-2032
- 9.1. Market Analysis, Insights and Forecast - by Product
- 9.1.1. Sequencing Consumables
- 9.1.2. Library Preparation Kits
- 9.2. Market Analysis, Insights and Forecast - by Technology
- 9.2.1. Sequencing by Synthesis
- 9.2.2. Ion Semiconductor
- 9.2.3. SOLiD
- 9.2.4. Nanopore Sequencing
- 9.3. Market Analysis, Insights and Forecast - by End User
- 9.3.1. Clinical Laboratory
- 9.3.2. Life Science Organization
- 9.3.3. Other End Users
- 9.1. Market Analysis, Insights and Forecast - by Product
- 10. South America MiRNA Sequencing and Assay Industry Analysis, Insights and Forecast, 2020-2032
- 10.1. Market Analysis, Insights and Forecast - by Product
- 10.1.1. Sequencing Consumables
- 10.1.2. Library Preparation Kits
- 10.2. Market Analysis, Insights and Forecast - by Technology
- 10.2.1. Sequencing by Synthesis
- 10.2.2. Ion Semiconductor
- 10.2.3. SOLiD
- 10.2.4. Nanopore Sequencing
- 10.3. Market Analysis, Insights and Forecast - by End User
- 10.3.1. Clinical Laboratory
- 10.3.2. Life Science Organization
- 10.3.3. Other End Users
- 10.1. Market Analysis, Insights and Forecast - by Product
- 11. Competitive Analysis
- 11.1. Global Market Share Analysis 2025
- 11.2. Company Profiles
- 11.2.1 Norgen Biotek Corporation
- 11.2.1.1. Overview
- 11.2.1.2. Products
- 11.2.1.3. SWOT Analysis
- 11.2.1.4. Recent Developments
- 11.2.1.5. Financials (Based on Availability)
- 11.2.2 Trilink Biotechnologies
- 11.2.2.1. Overview
- 11.2.2.2. Products
- 11.2.2.3. SWOT Analysis
- 11.2.2.4. Recent Developments
- 11.2.2.5. Financials (Based on Availability)
- 11.2.3 Takara Bio Inc
- 11.2.3.1. Overview
- 11.2.3.2. Products
- 11.2.3.3. SWOT Analysis
- 11.2.3.4. Recent Developments
- 11.2.3.5. Financials (Based on Availability)
- 11.2.4 Qiagen N V
- 11.2.4.1. Overview
- 11.2.4.2. Products
- 11.2.4.3. SWOT Analysis
- 11.2.4.4. Recent Developments
- 11.2.4.5. Financials (Based on Availability)
- 11.2.5 Lexogen
- 11.2.5.1. Overview
- 11.2.5.2. Products
- 11.2.5.3. SWOT Analysis
- 11.2.5.4. Recent Developments
- 11.2.5.5. Financials (Based on Availability)
- 11.2.6 Oxford Nanopore Technologies*List Not Exhaustive
- 11.2.6.1. Overview
- 11.2.6.2. Products
- 11.2.6.3. SWOT Analysis
- 11.2.6.4. Recent Developments
- 11.2.6.5. Financials (Based on Availability)
- 11.2.7 New England Biolabs Inc
- 11.2.7.1. Overview
- 11.2.7.2. Products
- 11.2.7.3. SWOT Analysis
- 11.2.7.4. Recent Developments
- 11.2.7.5. Financials (Based on Availability)
- 11.2.8 PerkinElmer Inc
- 11.2.8.1. Overview
- 11.2.8.2. Products
- 11.2.8.3. SWOT Analysis
- 11.2.8.4. Recent Developments
- 11.2.8.5. Financials (Based on Availability)
- 11.2.9 Illumina Inc
- 11.2.9.1. Overview
- 11.2.9.2. Products
- 11.2.9.3. SWOT Analysis
- 11.2.9.4. Recent Developments
- 11.2.9.5. Financials (Based on Availability)
- 11.2.10 Thermo Fisher Scientific
- 11.2.10.1. Overview
- 11.2.10.2. Products
- 11.2.10.3. SWOT Analysis
- 11.2.10.4. Recent Developments
- 11.2.10.5. Financials (Based on Availability)
- 11.2.1 Norgen Biotek Corporation
List of Figures
- Figure 1: Global MiRNA Sequencing and Assay Industry Revenue Breakdown (million, %) by Region 2025 & 2033
- Figure 2: North America MiRNA Sequencing and Assay Industry Revenue (million), by Product 2025 & 2033
- Figure 3: North America MiRNA Sequencing and Assay Industry Revenue Share (%), by Product 2025 & 2033
- Figure 4: North America MiRNA Sequencing and Assay Industry Revenue (million), by Technology 2025 & 2033
- Figure 5: North America MiRNA Sequencing and Assay Industry Revenue Share (%), by Technology 2025 & 2033
- Figure 6: North America MiRNA Sequencing and Assay Industry Revenue (million), by End User 2025 & 2033
- Figure 7: North America MiRNA Sequencing and Assay Industry Revenue Share (%), by End User 2025 & 2033
- Figure 8: North America MiRNA Sequencing and Assay Industry Revenue (million), by Country 2025 & 2033
- Figure 9: North America MiRNA Sequencing and Assay Industry Revenue Share (%), by Country 2025 & 2033
- Figure 10: Europe MiRNA Sequencing and Assay Industry Revenue (million), by Product 2025 & 2033
- Figure 11: Europe MiRNA Sequencing and Assay Industry Revenue Share (%), by Product 2025 & 2033
- Figure 12: Europe MiRNA Sequencing and Assay Industry Revenue (million), by Technology 2025 & 2033
- Figure 13: Europe MiRNA Sequencing and Assay Industry Revenue Share (%), by Technology 2025 & 2033
- Figure 14: Europe MiRNA Sequencing and Assay Industry Revenue (million), by End User 2025 & 2033
- Figure 15: Europe MiRNA Sequencing and Assay Industry Revenue Share (%), by End User 2025 & 2033
- Figure 16: Europe MiRNA Sequencing and Assay Industry Revenue (million), by Country 2025 & 2033
- Figure 17: Europe MiRNA Sequencing and Assay Industry Revenue Share (%), by Country 2025 & 2033
- Figure 18: Asia Pacific MiRNA Sequencing and Assay Industry Revenue (million), by Product 2025 & 2033
- Figure 19: Asia Pacific MiRNA Sequencing and Assay Industry Revenue Share (%), by Product 2025 & 2033
- Figure 20: Asia Pacific MiRNA Sequencing and Assay Industry Revenue (million), by Technology 2025 & 2033
- Figure 21: Asia Pacific MiRNA Sequencing and Assay Industry Revenue Share (%), by Technology 2025 & 2033
- Figure 22: Asia Pacific MiRNA Sequencing and Assay Industry Revenue (million), by End User 2025 & 2033
- Figure 23: Asia Pacific MiRNA Sequencing and Assay Industry Revenue Share (%), by End User 2025 & 2033
- Figure 24: Asia Pacific MiRNA Sequencing and Assay Industry Revenue (million), by Country 2025 & 2033
- Figure 25: Asia Pacific MiRNA Sequencing and Assay Industry Revenue Share (%), by Country 2025 & 2033
- Figure 26: Middle East and Africa MiRNA Sequencing and Assay Industry Revenue (million), by Product 2025 & 2033
- Figure 27: Middle East and Africa MiRNA Sequencing and Assay Industry Revenue Share (%), by Product 2025 & 2033
- Figure 28: Middle East and Africa MiRNA Sequencing and Assay Industry Revenue (million), by Technology 2025 & 2033
- Figure 29: Middle East and Africa MiRNA Sequencing and Assay Industry Revenue Share (%), by Technology 2025 & 2033
- Figure 30: Middle East and Africa MiRNA Sequencing and Assay Industry Revenue (million), by End User 2025 & 2033
- Figure 31: Middle East and Africa MiRNA Sequencing and Assay Industry Revenue Share (%), by End User 2025 & 2033
- Figure 32: Middle East and Africa MiRNA Sequencing and Assay Industry Revenue (million), by Country 2025 & 2033
- Figure 33: Middle East and Africa MiRNA Sequencing and Assay Industry Revenue Share (%), by Country 2025 & 2033
- Figure 34: South America MiRNA Sequencing and Assay Industry Revenue (million), by Product 2025 & 2033
- Figure 35: South America MiRNA Sequencing and Assay Industry Revenue Share (%), by Product 2025 & 2033
- Figure 36: South America MiRNA Sequencing and Assay Industry Revenue (million), by Technology 2025 & 2033
- Figure 37: South America MiRNA Sequencing and Assay Industry Revenue Share (%), by Technology 2025 & 2033
- Figure 38: South America MiRNA Sequencing and Assay Industry Revenue (million), by End User 2025 & 2033
- Figure 39: South America MiRNA Sequencing and Assay Industry Revenue Share (%), by End User 2025 & 2033
- Figure 40: South America MiRNA Sequencing and Assay Industry Revenue (million), by Country 2025 & 2033
- Figure 41: South America MiRNA Sequencing and Assay Industry Revenue Share (%), by Country 2025 & 2033
List of Tables
- Table 1: Global MiRNA Sequencing and Assay Industry Revenue million Forecast, by Product 2020 & 2033
- Table 2: Global MiRNA Sequencing and Assay Industry Revenue million Forecast, by Technology 2020 & 2033
- Table 3: Global MiRNA Sequencing and Assay Industry Revenue million Forecast, by End User 2020 & 2033
- Table 4: Global MiRNA Sequencing and Assay Industry Revenue million Forecast, by Region 2020 & 2033
- Table 5: Global MiRNA Sequencing and Assay Industry Revenue million Forecast, by Product 2020 & 2033
- Table 6: Global MiRNA Sequencing and Assay Industry Revenue million Forecast, by Technology 2020 & 2033
- Table 7: Global MiRNA Sequencing and Assay Industry Revenue million Forecast, by End User 2020 & 2033
- Table 8: Global MiRNA Sequencing and Assay Industry Revenue million Forecast, by Country 2020 & 2033
- Table 9: United States MiRNA Sequencing and Assay Industry Revenue (million) Forecast, by Application 2020 & 2033
- Table 10: Canada MiRNA Sequencing and Assay Industry Revenue (million) Forecast, by Application 2020 & 2033
- Table 11: Mexico MiRNA Sequencing and Assay Industry Revenue (million) Forecast, by Application 2020 & 2033
- Table 12: Global MiRNA Sequencing and Assay Industry Revenue million Forecast, by Product 2020 & 2033
- Table 13: Global MiRNA Sequencing and Assay Industry Revenue million Forecast, by Technology 2020 & 2033
- Table 14: Global MiRNA Sequencing and Assay Industry Revenue million Forecast, by End User 2020 & 2033
- Table 15: Global MiRNA Sequencing and Assay Industry Revenue million Forecast, by Country 2020 & 2033
- Table 16: Germany MiRNA Sequencing and Assay Industry Revenue (million) Forecast, by Application 2020 & 2033
- Table 17: United Kingdom MiRNA Sequencing and Assay Industry Revenue (million) Forecast, by Application 2020 & 2033
- Table 18: France MiRNA Sequencing and Assay Industry Revenue (million) Forecast, by Application 2020 & 2033
- Table 19: Italy MiRNA Sequencing and Assay Industry Revenue (million) Forecast, by Application 2020 & 2033
- Table 20: Spain MiRNA Sequencing and Assay Industry Revenue (million) Forecast, by Application 2020 & 2033
- Table 21: Rest of Europe MiRNA Sequencing and Assay Industry Revenue (million) Forecast, by Application 2020 & 2033
- Table 22: Global MiRNA Sequencing and Assay Industry Revenue million Forecast, by Product 2020 & 2033
- Table 23: Global MiRNA Sequencing and Assay Industry Revenue million Forecast, by Technology 2020 & 2033
- Table 24: Global MiRNA Sequencing and Assay Industry Revenue million Forecast, by End User 2020 & 2033
- Table 25: Global MiRNA Sequencing and Assay Industry Revenue million Forecast, by Country 2020 & 2033
- Table 26: China MiRNA Sequencing and Assay Industry Revenue (million) Forecast, by Application 2020 & 2033
- Table 27: Japan MiRNA Sequencing and Assay Industry Revenue (million) Forecast, by Application 2020 & 2033
- Table 28: India MiRNA Sequencing and Assay Industry Revenue (million) Forecast, by Application 2020 & 2033
- Table 29: Australia MiRNA Sequencing and Assay Industry Revenue (million) Forecast, by Application 2020 & 2033
- Table 30: South Korea MiRNA Sequencing and Assay Industry Revenue (million) Forecast, by Application 2020 & 2033
- Table 31: Rest of Asia Pacific MiRNA Sequencing and Assay Industry Revenue (million) Forecast, by Application 2020 & 2033
- Table 32: Global MiRNA Sequencing and Assay Industry Revenue million Forecast, by Product 2020 & 2033
- Table 33: Global MiRNA Sequencing and Assay Industry Revenue million Forecast, by Technology 2020 & 2033
- Table 34: Global MiRNA Sequencing and Assay Industry Revenue million Forecast, by End User 2020 & 2033
- Table 35: Global MiRNA Sequencing and Assay Industry Revenue million Forecast, by Country 2020 & 2033
- Table 36: GCC MiRNA Sequencing and Assay Industry Revenue (million) Forecast, by Application 2020 & 2033
- Table 37: South Africa MiRNA Sequencing and Assay Industry Revenue (million) Forecast, by Application 2020 & 2033
- Table 38: Rest of Middle East and Africa MiRNA Sequencing and Assay Industry Revenue (million) Forecast, by Application 2020 & 2033
- Table 39: Global MiRNA Sequencing and Assay Industry Revenue million Forecast, by Product 2020 & 2033
- Table 40: Global MiRNA Sequencing and Assay Industry Revenue million Forecast, by Technology 2020 & 2033
- Table 41: Global MiRNA Sequencing and Assay Industry Revenue million Forecast, by End User 2020 & 2033
- Table 42: Global MiRNA Sequencing and Assay Industry Revenue million Forecast, by Country 2020 & 2033
- Table 43: Brazil MiRNA Sequencing and Assay Industry Revenue (million) Forecast, by Application 2020 & 2033
- Table 44: Argentina MiRNA Sequencing and Assay Industry Revenue (million) Forecast, by Application 2020 & 2033
- Table 45: Rest of South America MiRNA Sequencing and Assay Industry Revenue (million) Forecast, by Application 2020 & 2033
Frequently Asked Questions
1. What is the projected Compound Annual Growth Rate (CAGR) of the MiRNA Sequencing and Assay Industry?
The projected CAGR is approximately 11.51%.
2. Which companies are prominent players in the MiRNA Sequencing and Assay Industry?
Key companies in the market include Norgen Biotek Corporation, Trilink Biotechnologies, Takara Bio Inc, Qiagen N V, Lexogen, Oxford Nanopore Technologies*List Not Exhaustive, New England Biolabs Inc, PerkinElmer Inc, Illumina Inc, Thermo Fisher Scientific.
3. What are the main segments of the MiRNA Sequencing and Assay Industry?
The market segments include Product, Technology, End User.
4. Can you provide details about the market size?
The market size is estimated to be USD 382.71 million as of 2022.
5. What are some drivers contributing to market growth?
MiRNA Sequencing and Assay Sequencing Supremacy Over Other Methods; Increased Research in the Field of Genomics; Reduced Sequencing Costs.
6. What are the notable trends driving market growth?
Library Preparation Kits are Expected to Hold the Largest Market Share in the miRNA Sequencing and Assay Market.
7. Are there any restraints impacting market growth?
Paucity of Expert and Need for Computing Infrastructure.
8. Can you provide examples of recent developments in the market?
April 2022: HTC Molecular Diagnostics Inc. unveiled new features of its proprietary HTG EdgeSeq technology. The company has improved its technology, and now its new sample preparation harmonization enables miRNA and mRNA profiling without the need for additional samples.
9. What pricing options are available for accessing the report?
Pricing options include single-user, multi-user, and enterprise licenses priced at USD 4750, USD 5250, and USD 8750 respectively.
10. Is the market size provided in terms of value or volume?
The market size is provided in terms of value, measured in million.
11. Are there any specific market keywords associated with the report?
Yes, the market keyword associated with the report is "MiRNA Sequencing and Assay Industry," which aids in identifying and referencing the specific market segment covered.
12. How do I determine which pricing option suits my needs best?
The pricing options vary based on user requirements and access needs. Individual users may opt for single-user licenses, while businesses requiring broader access may choose multi-user or enterprise licenses for cost-effective access to the report.
13. Are there any additional resources or data provided in the MiRNA Sequencing and Assay Industry report?
While the report offers comprehensive insights, it's advisable to review the specific contents or supplementary materials provided to ascertain if additional resources or data are available.
14. How can I stay updated on further developments or reports in the MiRNA Sequencing and Assay Industry?
To stay informed about further developments, trends, and reports in the MiRNA Sequencing and Assay Industry, consider subscribing to industry newsletters, following relevant companies and organizations, or regularly checking reputable industry news sources and publications.
Methodology
Step 1 - Identification of Relevant Samples Size from Population Database


Step 2 - Approaches for Defining Global Market Size (Value, Volume* & Price*)

Note*: In applicable scenarios
Step 3 - Data Sources
Primary Research
- Web Analytics
- Survey Reports
- Research Institute
- Latest Research Reports
- Opinion Leaders
Secondary Research
- Annual Reports
- White Paper
- Latest Press Release
- Industry Association
- Paid Database
- Investor Presentations

Step 4 - Data Triangulation
Involves using different sources of information in order to increase the validity of a study
These sources are likely to be stakeholders in a program - participants, other researchers, program staff, other community members, and so on.
Then we put all data in single framework & apply various statistical tools to find out the dynamic on the market.
During the analysis stage, feedback from the stakeholder groups would be compared to determine areas of agreement as well as areas of divergence