

Key Insights
The 3D cell culture market is poised for significant expansion, with a current market size estimated at 1134 million in the base year 2025. This growth is driven by a remarkable CAGR of 12.3%, projecting a robust trajectory through the forecast period ending in 2033. This surge is largely attributed to the increasing demand for more physiologically relevant in vitro models that better mimic the in vivo environment compared to traditional 2D cultures. The limitations of 2D cell culture in accurately predicting drug efficacy and toxicity are driving the adoption of 3D models across various applications, including drug discovery, personalized medicine, and tissue engineering. Key advancements in scaffold-based and scaffold-free technologies, alongside the development of sophisticated microchip-based systems, are further fueling market growth by offering enhanced control and recapitulation of cellular microenvironments.
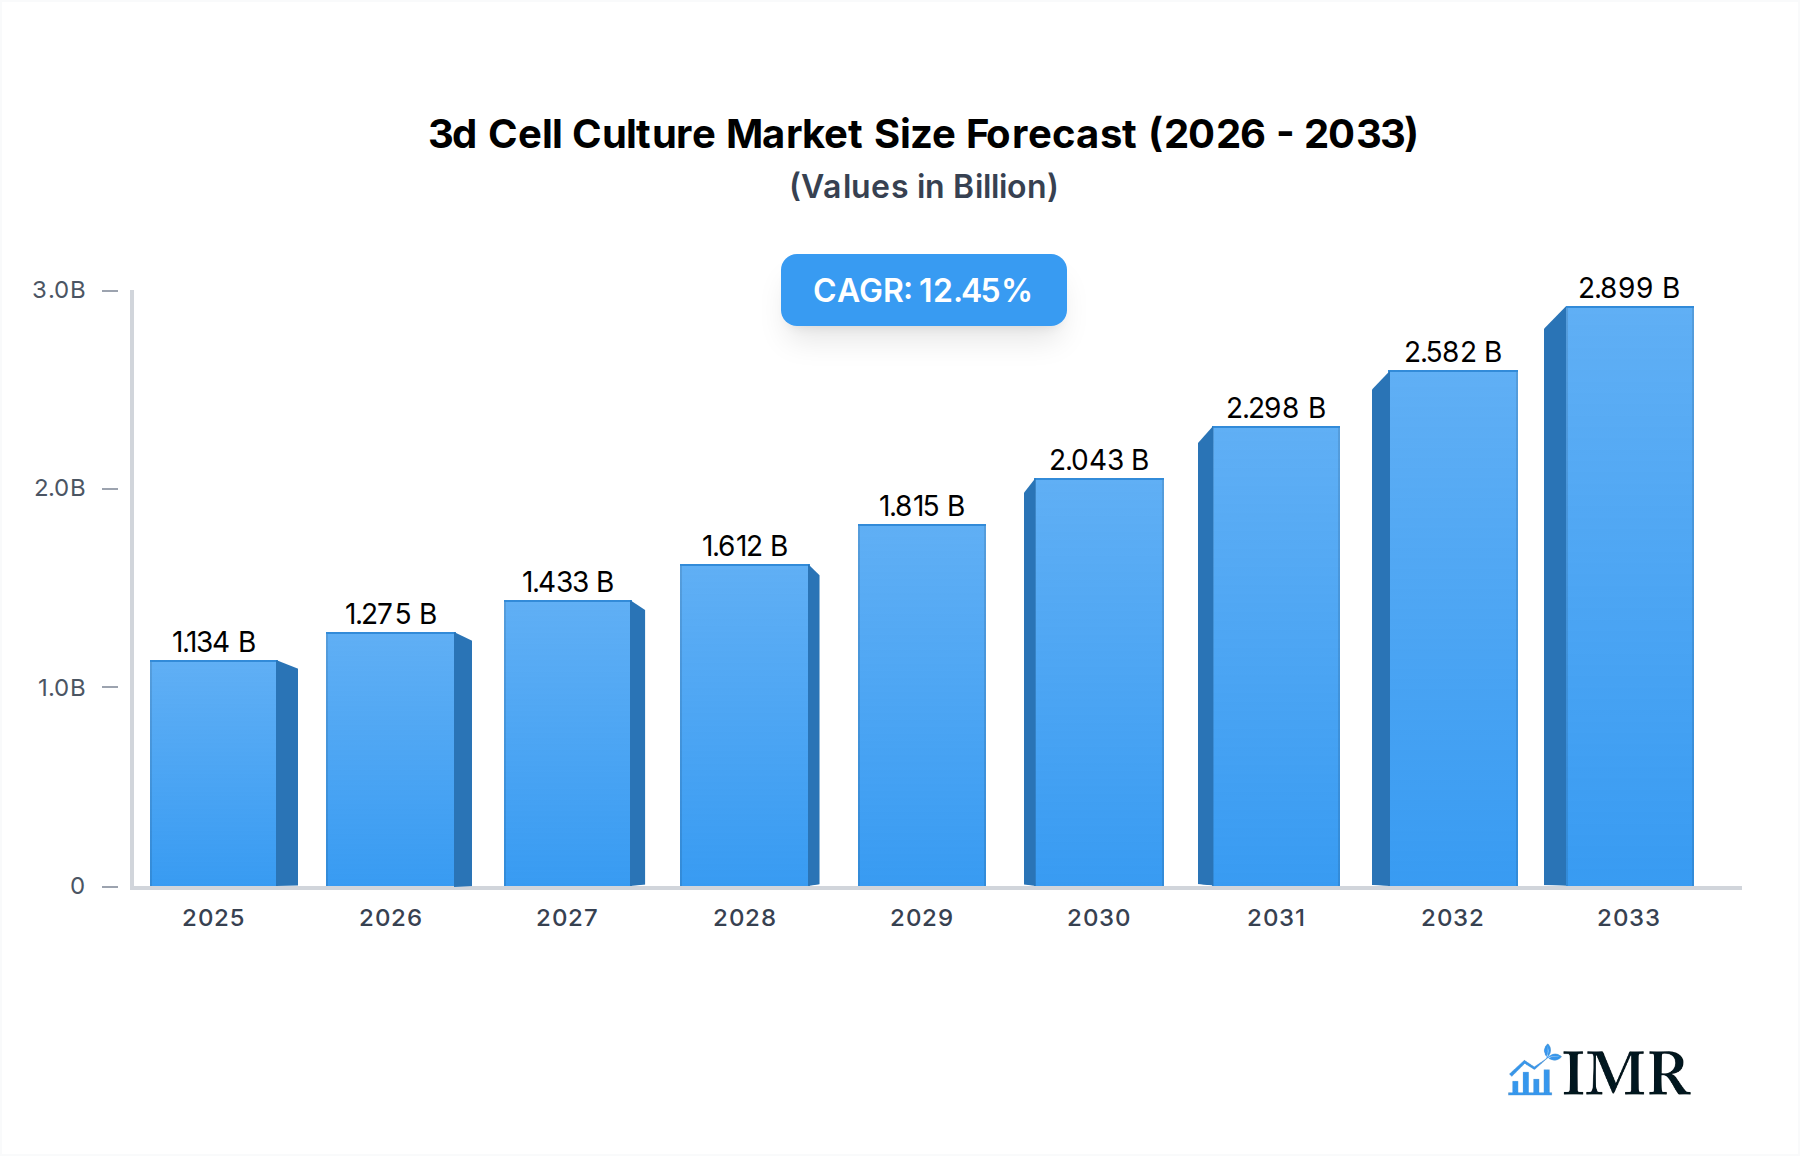
3d Cell Culture Market Size (In Billion)
The market's expansion is further bolstered by growing research investments in understanding complex biological processes and diseases. Pharmaceutical and biotechnology companies are increasingly leveraging 3D cell culture for preclinical drug screening and development, aiming to reduce the cost and time associated with bringing new therapies to market. Emerging economies, particularly in the Asia Pacific region, are also showing considerable potential due to increasing healthcare expenditure and a rising focus on advanced research methodologies. While the market benefits from these strong drivers, challenges such as the complexity of 3D model development and standardization may present some restraints. However, continuous innovation and the growing number of strategic collaborations among key players are expected to mitigate these challenges and sustain the market's impressive growth momentum. The competitive landscape is dynamic, with established players and innovative startups actively developing advanced solutions to capture market share.

3d Cell Culture Company Market Share
Unlocking the Future of Pre-clinical Research: A Comprehensive 3D Cell Culture Market Report
This in-depth market research report provides a strategic analysis of the global 3D cell culture market, a rapidly evolving sector poised to revolutionize drug discovery, toxicology testing, and regenerative medicine. Spanning the historical period of 2019-2024 and projecting growth through 2033, this report offers critical insights for stakeholders seeking to capitalize on emerging trends and navigate the competitive landscape. With a focus on market dynamics, growth trajectories, regional dominance, product innovation, and key players, this report is your definitive guide to understanding and leveraging the power of 3D cell culture.
3d Cell Culture Market Dynamics & Structure
The global 3D cell culture market is characterized by a moderate to high level of concentration, with a few key players dominating the landscape through continuous innovation and strategic acquisitions. Technological advancements, particularly in biomaterials, microfluidics, and imaging, serve as primary drivers, enabling the development of more physiologically relevant in vitro models. The increasing demand for personalized medicine and the need for more predictive preclinical models are further fueling market expansion. Regulatory bodies are increasingly acknowledging the potential of 3D cell culture models, leading to evolving frameworks that support their adoption. Competitive product substitutes include traditional 2D cell culture methods and animal models, but the superior predictive power of 3D models is steadily displacing them. End-user demographics are diverse, encompassing pharmaceutical and biotechnology companies, academic and research institutions, and contract research organizations (CROs). Mergers and acquisitions (M&A) are a notable trend, as larger companies acquire innovative startups to expand their portfolios and technological capabilities. For instance, a significant M&A deal volume of approximately $350 million was observed in the historical period (2019-2024), indicating robust consolidation activities. Barriers to innovation include the high cost of advanced equipment and specialized reagents, as well as the need for specialized expertise in complex experimental design and data analysis.
- Market Concentration: Dominated by a mix of large established players and agile startups, with a steady pace of M&A.
- Technological Innovation Drivers: Advancements in biomaterial science, microfabrication, high-throughput screening, and AI-driven data analysis.
- Regulatory Frameworks: Gradual integration and acceptance of 3D cell culture data by regulatory agencies for preclinical drug development.
- Competitive Product Substitutes: Ongoing competition from 2D cell culture and animal models, with a clear trend towards 3D model superiority.
- End-User Demographics: Primarily pharmaceutical, biotech, academic research, and CROs, with growing interest from cosmetics and academic research.
- M&A Trends: Active consolidation to acquire intellectual property, expand product offerings, and gain market share.
3d Cell Culture Growth Trends & Insights
The global 3D cell culture market is experiencing robust growth, driven by a confluence of scientific advancements and pressing industry needs. The market size is projected to grow from an estimated $7.5 billion in the base year 2025 to reach approximately $22.8 billion by the end of the forecast period in 2033, exhibiting a Compound Annual Growth Rate (CAGR) of 14.5%. This impressive expansion is underpinned by increasing adoption rates in drug discovery and development pipelines. Researchers are increasingly recognizing the limitations of traditional 2D cell cultures and animal models, which often fail to accurately replicate the complex microenvironment of human tissues and organs. 3D cell culture models, by contrast, offer a more physiologically relevant platform, leading to improved prediction of drug efficacy and potential toxicity, thereby reducing late-stage failures and accelerating the drug development process. Technological disruptions are constantly emerging, with innovations in scaffold-free methods, organ-on-a-chip technologies, and advanced imaging techniques enhancing the capabilities and applications of 3D cell culture. For instance, the advent of high-throughput 3D screening platforms is enabling researchers to test a wider range of compounds more efficiently. Consumer behavior shifts within the research community are also significant. There's a growing demand for standardized, reproducible 3D models that can be easily integrated into existing workflows. This has led to increased investment in the development of commercially available, ready-to-use 3D cell culture systems and kits. Furthermore, the rising prevalence of chronic diseases and the growing need for novel therapeutics are creating a sustained demand for more accurate and predictive preclinical testing methods. The market penetration of 3D cell culture is steadily increasing across various research applications, moving beyond niche applications to become a mainstream tool in preclinical research. The ability of 3D cultures to recapitulate key aspects of in vivo physiology, such as cell-to-cell interactions, extracellular matrix cues, and tissue architecture, is a primary factor driving this adoption. The transition from 2D to 3D is not just a technological upgrade but a paradigm shift towards more biologically accurate and predictive in vitro research.
Dominant Regions, Countries, or Segments in 3d Cell Culture
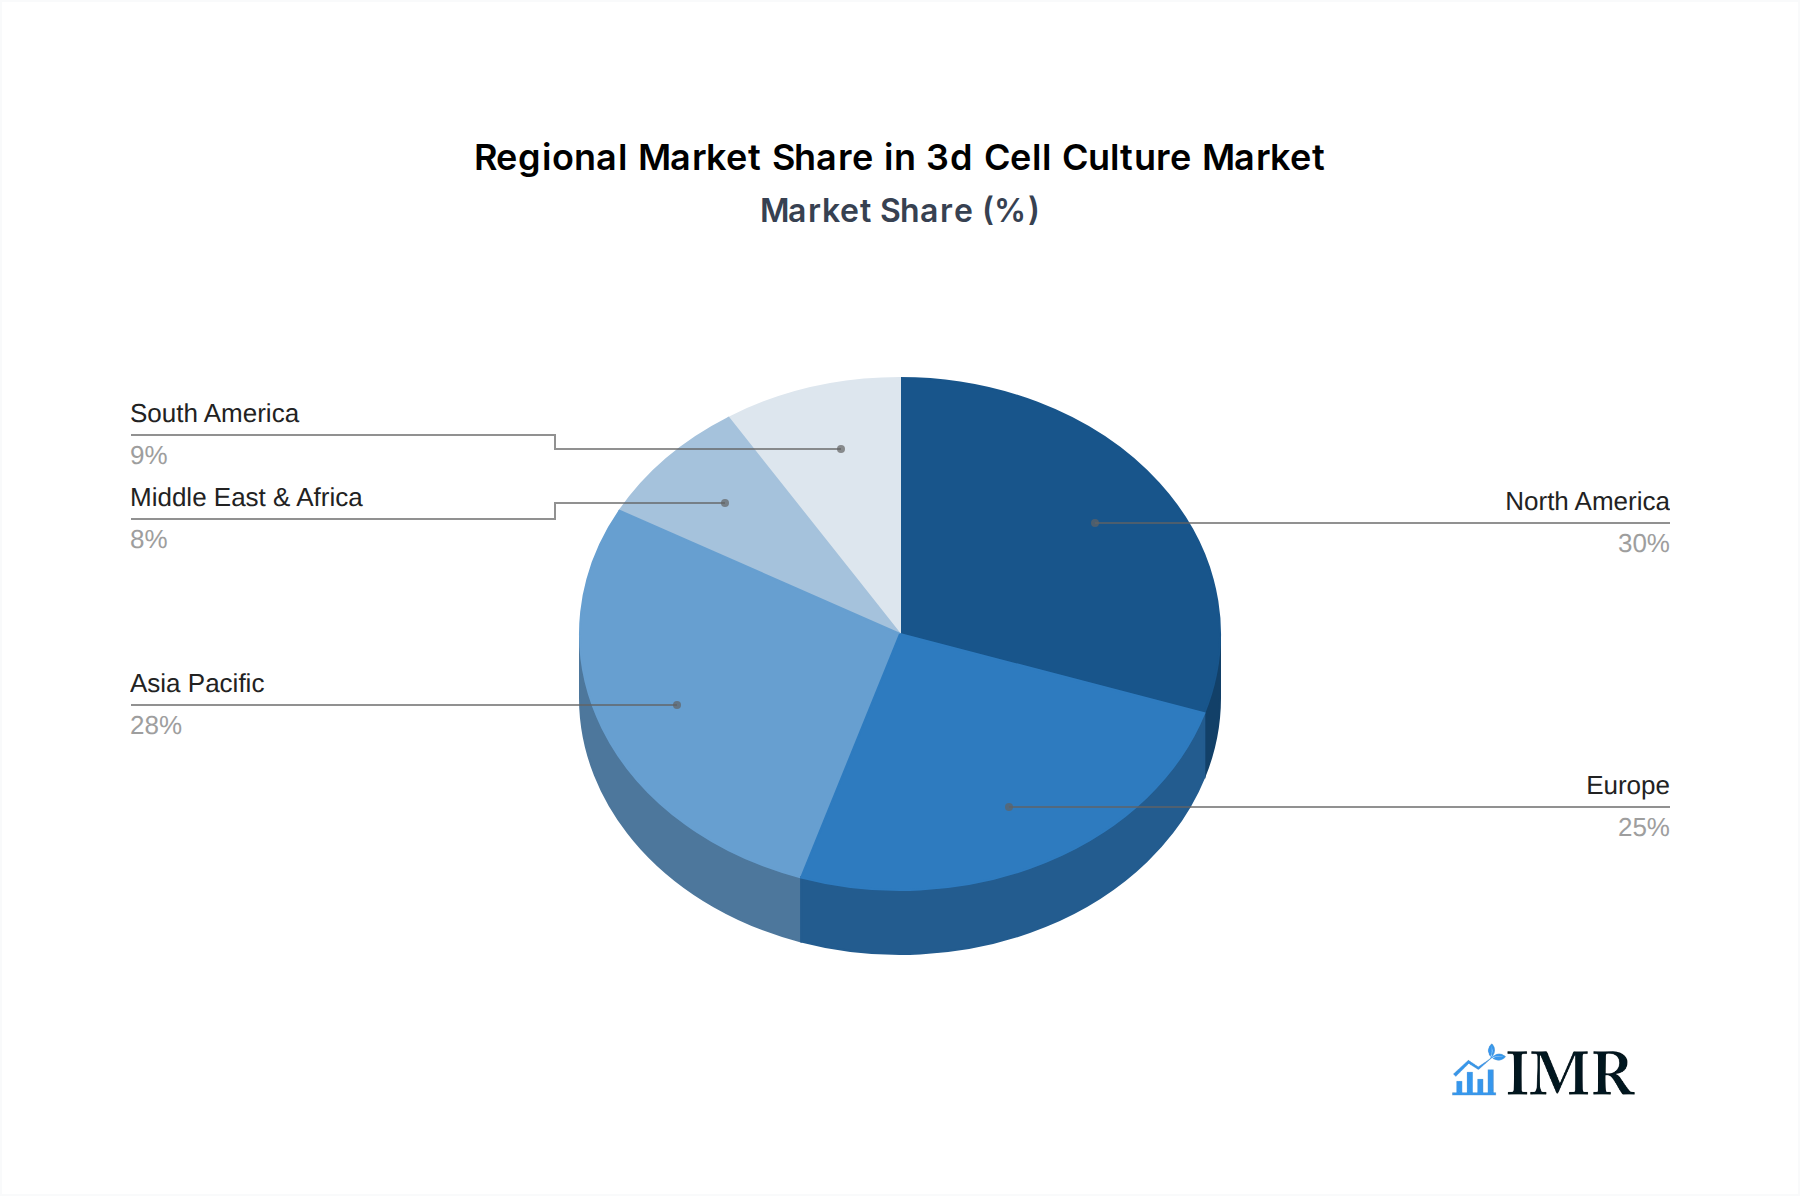
The Efficacy vs. Toxicology Testing segment within the Application category stands out as a dominant force in the global 3D cell culture market. This dominance is driven by the inherent need within the pharmaceutical and biotechnology industries to accurately predict drug efficacy and potential adverse effects before costly and time-consuming clinical trials. The limitations of traditional toxicology testing methods, including animal models, have led to significant late-stage drug failures, making 3D cell culture models essential for improving the translational value of preclinical data. North America, particularly the United States, currently holds the largest market share in the 3D cell culture sector due to its well-established pharmaceutical and biotechnology infrastructure, substantial R&D investments, and a robust regulatory environment that encourages the adoption of advanced preclinical technologies. Economic policies in the region actively support life sciences innovation, fostering a conducive environment for the growth of companies developing and utilizing 3D cell culture. The region also benefits from a strong academic research base and a high concentration of contract research organizations (CROs) that are early adopters of cutting-edge technologies. The leading countries within this region are investing heavily in research infrastructure and offering incentives for drug development.
In terms of Type, Scaffold-based 3D cell culture methods continue to hold a significant market share due to their ability to mimic the extracellular matrix and provide structural support for cell growth and organization. However, Scaffold-free methods are gaining traction rapidly due to their simplicity and ability to promote cell-cell interactions without external support, often leading to more native tissue-like structures. Microchips, or organ-on-a-chip technologies, represent the most advanced and rapidly growing segment within 3D cell culture. These platforms offer unparalleled control over the microenvironment, enabling the creation of complex, multi-tissue systems that closely mimic human physiology. The market share of microchips is expected to surge as the technology matures and becomes more accessible, offering significant growth potential for understanding complex biological processes and drug interactions. The dominance of these segments is further amplified by industry developments such as increased funding for regenerative medicine research, the growing focus on personalized medicine, and the push for alternatives to animal testing, all of which directly benefit the applications and types of 3D cell culture.
3d Cell Culture Product Landscape
The 3D cell culture product landscape is characterized by continuous innovation, offering a diverse array of solutions for researchers. Key product developments include advanced biomaterials such as hydrogels and decellularized extracellular matrices that better mimic native tissue environments, providing enhanced cell viability and function. The application of these products spans efficacy testing, where they enable more accurate prediction of therapeutic responses, and toxicology testing, offering superior insights into potential drug-induced side effects. Leading models are increasingly incorporating complex co-cultures and microfluidic designs within scaffold-based, scaffold-free, and microchip formats. Performance metrics are improving with enhanced cell encapsulation efficiency, higher cell viability over extended culture periods, and more accurate recapitulation of in vivo tissue architecture and gene expression profiles. Unique selling propositions include the development of disease-specific 3D models, high-throughput compatible systems, and integrated imaging and analysis solutions, all contributing to the acceleration of research and development cycles.
Key Drivers, Barriers & Challenges in 3d Cell Culture
Key Drivers:
- Need for Predictive Preclinical Models: The persistent high failure rate of drugs in clinical trials due to poor translation from animal models drives the demand for more physiologically relevant 3D cell culture systems.
- Advancements in Biomaterials and Engineering: Innovations in hydrogels, scaffolds, and microfluidics enable the creation of increasingly complex and accurate in vitro tissue models.
- Growing Demand for Alternatives to Animal Testing: Ethical concerns and regulatory pressures are pushing for the adoption of in vitro methods that reduce reliance on animal models.
- Personalized Medicine and Regenerative Medicine Research: 3D cell cultures are crucial for developing patient-specific disease models and advancing regenerative medicine therapies.
Key Barriers & Challenges:
- High Cost of Implementation: Specialized equipment, reagents, and trained personnel can make the adoption of advanced 3D cell culture techniques expensive, especially for smaller research institutions.
- Standardization and Reproducibility: Ensuring consistency and reproducibility across different labs and experimental setups remains a significant challenge for complex 3D models.
- Complex Experimental Design and Data Analysis: Designing and interpreting experiments with 3D cell cultures requires specialized expertise, creating a bottleneck for widespread adoption.
- Scalability for High-Throughput Screening: While improving, scaling up complex 3D models for large-scale screening applications is still an area of development.
- Regulatory Acceptance Nuances: While increasing, the full integration and acceptance of 3D cell culture data by all regulatory bodies for all types of applications are still evolving.
Emerging Opportunities in 3d Cell Culture
Emerging opportunities in the 3D cell culture sector lie in the development of highly functional organoids and organ-on-a-chip platforms for specific disease modeling, such as neurodegenerative disorders and complex cancers. The integration of artificial intelligence (AI) and machine learning for the analysis of complex 3D culture data presents a significant opportunity for automated interpretation and predictive modeling, accelerating discovery timelines. Furthermore, the expansion of 3D cell culture applications into novel areas like cosmetics testing and environmental toxicology offers untapped market potential. Evolving consumer preferences for cruelty-free and ethically sourced products also drive the demand for advanced in vitro testing methods. The development of standardized, user-friendly 3D cell culture kits and services will further democratize access to these technologies, opening up new markets and user bases.
Growth Accelerators in the 3d Cell Culture Industry
Growth accelerators in the 3D cell culture industry are primarily driven by sustained technological breakthroughs, strategic partnerships between academic institutions and commercial entities, and proactive market expansion strategies by key players. The continuous refinement of biomaterials and microfabrication techniques allows for the creation of more sophisticated and predictive tissue models, directly fueling adoption. Strategic collaborations are crucial for translating academic innovations into commercially viable products and for expanding the application scope of existing technologies. For instance, partnerships focused on developing novel disease models or integrating AI for data analysis are poised to significantly boost market growth. Furthermore, companies are actively pursuing market expansion by targeting emerging economies and niche therapeutic areas, thereby diversifying revenue streams and increasing global market penetration.
Key Players Shaping the 3d Cell Culture Market
- Thermo Fisher Scientific
- Corning
- Merck
- Greiner Bio-One
- Lonza Group
- Emulate
- TissUse
- CN Bio
- TARA Biosystems
- Mimetas
- Nortis
- Reprocell Incorporated
- Jet Bio-Filtration
- InSphero AG
- 3D Biotek
Notable Milestones in 3d Cell Culture Sector
- 2019: Increased investment in organoid research and development, leading to more sophisticated disease models.
- 2020: Emergence of advanced microfluidic-based organ-on-a-chip systems for complex tissue interactions.
- 2021: Significant product launches of advanced biomaterial scaffolds and ready-to-use 3D cell culture kits.
- 2022: Growing regulatory discussions and early guidance on the acceptance of 3D cell culture data for drug development.
- 2023: Expansion of 3D cell culture applications into areas beyond traditional drug discovery, such as personalized medicine and advanced toxicology.
- 2024: Strategic acquisitions of smaller, innovative 3D cell culture companies by larger life science corporations to enhance portfolios.
In-Depth 3d Cell Culture Market Outlook
The future outlook for the 3D cell culture market is exceptionally bright, fueled by ongoing technological advancements and the increasing recognition of its indispensable role in modern biomedical research. Growth accelerators, including the relentless pursuit of more predictive preclinical models, the burgeoning fields of regenerative medicine and personalized therapies, and the ongoing drive to replace animal testing, will continue to propel market expansion. Strategic partnerships between academic research centers and commercial entities will be instrumental in translating novel discoveries into widespread applications. Market expansion strategies, focusing on both established and emerging geographical regions, will further broaden the adoption of 3D cell culture technologies. The continued development of user-friendly platforms and robust data analysis tools will lower adoption barriers, making these advanced techniques more accessible to a wider range of researchers and institutions, thereby solidifying 3D cell culture as a cornerstone of future pharmaceutical and biomedical innovation.
3d Cell Culture Segmentation
-
1. Application
- 1.1. Efficacy vs. Toxicology Testing
- 1.2. Leading Models
-
2. Type
- 2.1. Scaffold-based
- 2.2. Scaffold-free
- 2.3. Microchips
3d Cell Culture Segmentation By Geography
-
1. North America
- 1.1. United States
- 1.2. Canada
- 1.3. Mexico
-
2. South America
- 2.1. Brazil
- 2.2. Argentina
- 2.3. Rest of South America
-
3. Europe
- 3.1. United Kingdom
- 3.2. Germany
- 3.3. France
- 3.4. Italy
- 3.5. Spain
- 3.6. Russia
- 3.7. Benelux
- 3.8. Nordics
- 3.9. Rest of Europe
-
4. Middle East & Africa
- 4.1. Turkey
- 4.2. Israel
- 4.3. GCC
- 4.4. North Africa
- 4.5. South Africa
- 4.6. Rest of Middle East & Africa
-
5. Asia Pacific
- 5.1. China
- 5.2. India
- 5.3. Japan
- 5.4. South Korea
- 5.5. ASEAN
- 5.6. Oceania
- 5.7. Rest of Asia Pacific
3d Cell Culture Regional Market Share
Geographic Coverage of 3d Cell Culture
3d Cell Culture REPORT HIGHLIGHTS
| Aspects | Details |
|---|---|
| Study Period | 2020-2034 |
| Base Year | 2025 |
| Estimated Year | 2026 |
| Forecast Period | 2026-2034 |
| Historical Period | 2020-2025 |
| Growth Rate | CAGR of 12.3% from 2020-2034 |
| Segmentation |
|
Table of Contents
- 1. Introduction
- 1.1. Research Scope
- 1.2. Market Segmentation
- 1.3. Research Methodology
- 1.4. Definitions and Assumptions
- 2. Executive Summary
- 2.1. Introduction
- 3. Market Dynamics
- 3.1. Introduction
- 3.2. Market Drivers
- 3.3. Market Restrains
- 3.4. Market Trends
- 4. Market Factor Analysis
- 4.1. Porters Five Forces
- 4.2. Supply/Value Chain
- 4.3. PESTEL analysis
- 4.4. Market Entropy
- 4.5. Patent/Trademark Analysis
- 5. Global 3d Cell Culture Analysis, Insights and Forecast, 2020-2032
- 5.1. Market Analysis, Insights and Forecast - by Application
- 5.1.1. Efficacy vs. Toxicology Testing
- 5.1.2. Leading Models
- 5.2. Market Analysis, Insights and Forecast - by Type
- 5.2.1. Scaffold-based
- 5.2.2. Scaffold-free
- 5.2.3. Microchips
- 5.3. Market Analysis, Insights and Forecast - by Region
- 5.3.1. North America
- 5.3.2. South America
- 5.3.3. Europe
- 5.3.4. Middle East & Africa
- 5.3.5. Asia Pacific
- 5.1. Market Analysis, Insights and Forecast - by Application
- 6. North America 3d Cell Culture Analysis, Insights and Forecast, 2020-2032
- 6.1. Market Analysis, Insights and Forecast - by Application
- 6.1.1. Efficacy vs. Toxicology Testing
- 6.1.2. Leading Models
- 6.2. Market Analysis, Insights and Forecast - by Type
- 6.2.1. Scaffold-based
- 6.2.2. Scaffold-free
- 6.2.3. Microchips
- 6.1. Market Analysis, Insights and Forecast - by Application
- 7. South America 3d Cell Culture Analysis, Insights and Forecast, 2020-2032
- 7.1. Market Analysis, Insights and Forecast - by Application
- 7.1.1. Efficacy vs. Toxicology Testing
- 7.1.2. Leading Models
- 7.2. Market Analysis, Insights and Forecast - by Type
- 7.2.1. Scaffold-based
- 7.2.2. Scaffold-free
- 7.2.3. Microchips
- 7.1. Market Analysis, Insights and Forecast - by Application
- 8. Europe 3d Cell Culture Analysis, Insights and Forecast, 2020-2032
- 8.1. Market Analysis, Insights and Forecast - by Application
- 8.1.1. Efficacy vs. Toxicology Testing
- 8.1.2. Leading Models
- 8.2. Market Analysis, Insights and Forecast - by Type
- 8.2.1. Scaffold-based
- 8.2.2. Scaffold-free
- 8.2.3. Microchips
- 8.1. Market Analysis, Insights and Forecast - by Application
- 9. Middle East & Africa 3d Cell Culture Analysis, Insights and Forecast, 2020-2032
- 9.1. Market Analysis, Insights and Forecast - by Application
- 9.1.1. Efficacy vs. Toxicology Testing
- 9.1.2. Leading Models
- 9.2. Market Analysis, Insights and Forecast - by Type
- 9.2.1. Scaffold-based
- 9.2.2. Scaffold-free
- 9.2.3. Microchips
- 9.1. Market Analysis, Insights and Forecast - by Application
- 10. Asia Pacific 3d Cell Culture Analysis, Insights and Forecast, 2020-2032
- 10.1. Market Analysis, Insights and Forecast - by Application
- 10.1.1. Efficacy vs. Toxicology Testing
- 10.1.2. Leading Models
- 10.2. Market Analysis, Insights and Forecast - by Type
- 10.2.1. Scaffold-based
- 10.2.2. Scaffold-free
- 10.2.3. Microchips
- 10.1. Market Analysis, Insights and Forecast - by Application
- 11. Competitive Analysis
- 11.1. Global Market Share Analysis 2025
- 11.2. Company Profiles
- 11.2.1 Thermo Fisher Scientific
- 11.2.1.1. Overview
- 11.2.1.2. Products
- 11.2.1.3. SWOT Analysis
- 11.2.1.4. Recent Developments
- 11.2.1.5. Financials (Based on Availability)
- 11.2.2 Corning
- 11.2.2.1. Overview
- 11.2.2.2. Products
- 11.2.2.3. SWOT Analysis
- 11.2.2.4. Recent Developments
- 11.2.2.5. Financials (Based on Availability)
- 11.2.3 Merck
- 11.2.3.1. Overview
- 11.2.3.2. Products
- 11.2.3.3. SWOT Analysis
- 11.2.3.4. Recent Developments
- 11.2.3.5. Financials (Based on Availability)
- 11.2.4 Greiner Bio-One
- 11.2.4.1. Overview
- 11.2.4.2. Products
- 11.2.4.3. SWOT Analysis
- 11.2.4.4. Recent Developments
- 11.2.4.5. Financials (Based on Availability)
- 11.2.5 Lonza Group
- 11.2.5.1. Overview
- 11.2.5.2. Products
- 11.2.5.3. SWOT Analysis
- 11.2.5.4. Recent Developments
- 11.2.5.5. Financials (Based on Availability)
- 11.2.6 Emulate
- 11.2.6.1. Overview
- 11.2.6.2. Products
- 11.2.6.3. SWOT Analysis
- 11.2.6.4. Recent Developments
- 11.2.6.5. Financials (Based on Availability)
- 11.2.7 TissUse
- 11.2.7.1. Overview
- 11.2.7.2. Products
- 11.2.7.3. SWOT Analysis
- 11.2.7.4. Recent Developments
- 11.2.7.5. Financials (Based on Availability)
- 11.2.8 CN Bio
- 11.2.8.1. Overview
- 11.2.8.2. Products
- 11.2.8.3. SWOT Analysis
- 11.2.8.4. Recent Developments
- 11.2.8.5. Financials (Based on Availability)
- 11.2.9 TARA Biosystems
- 11.2.9.1. Overview
- 11.2.9.2. Products
- 11.2.9.3. SWOT Analysis
- 11.2.9.4. Recent Developments
- 11.2.9.5. Financials (Based on Availability)
- 11.2.10 Mimetas
- 11.2.10.1. Overview
- 11.2.10.2. Products
- 11.2.10.3. SWOT Analysis
- 11.2.10.4. Recent Developments
- 11.2.10.5. Financials (Based on Availability)
- 11.2.11 Nortis
- 11.2.11.1. Overview
- 11.2.11.2. Products
- 11.2.11.3. SWOT Analysis
- 11.2.11.4. Recent Developments
- 11.2.11.5. Financials (Based on Availability)
- 11.2.12 Reprocell Incorporated
- 11.2.12.1. Overview
- 11.2.12.2. Products
- 11.2.12.3. SWOT Analysis
- 11.2.12.4. Recent Developments
- 11.2.12.5. Financials (Based on Availability)
- 11.2.13 Jet Bio-Filtration
- 11.2.13.1. Overview
- 11.2.13.2. Products
- 11.2.13.3. SWOT Analysis
- 11.2.13.4. Recent Developments
- 11.2.13.5. Financials (Based on Availability)
- 11.2.14 InSphero AG
- 11.2.14.1. Overview
- 11.2.14.2. Products
- 11.2.14.3. SWOT Analysis
- 11.2.14.4. Recent Developments
- 11.2.14.5. Financials (Based on Availability)
- 11.2.15 3D Biotek
- 11.2.15.1. Overview
- 11.2.15.2. Products
- 11.2.15.3. SWOT Analysis
- 11.2.15.4. Recent Developments
- 11.2.15.5. Financials (Based on Availability)
- 11.2.1 Thermo Fisher Scientific
List of Figures
- Figure 1: Global 3d Cell Culture Revenue Breakdown (million, %) by Region 2025 & 2033
- Figure 2: North America 3d Cell Culture Revenue (million), by Application 2025 & 2033
- Figure 3: North America 3d Cell Culture Revenue Share (%), by Application 2025 & 2033
- Figure 4: North America 3d Cell Culture Revenue (million), by Type 2025 & 2033
- Figure 5: North America 3d Cell Culture Revenue Share (%), by Type 2025 & 2033
- Figure 6: North America 3d Cell Culture Revenue (million), by Country 2025 & 2033
- Figure 7: North America 3d Cell Culture Revenue Share (%), by Country 2025 & 2033
- Figure 8: South America 3d Cell Culture Revenue (million), by Application 2025 & 2033
- Figure 9: South America 3d Cell Culture Revenue Share (%), by Application 2025 & 2033
- Figure 10: South America 3d Cell Culture Revenue (million), by Type 2025 & 2033
- Figure 11: South America 3d Cell Culture Revenue Share (%), by Type 2025 & 2033
- Figure 12: South America 3d Cell Culture Revenue (million), by Country 2025 & 2033
- Figure 13: South America 3d Cell Culture Revenue Share (%), by Country 2025 & 2033
- Figure 14: Europe 3d Cell Culture Revenue (million), by Application 2025 & 2033
- Figure 15: Europe 3d Cell Culture Revenue Share (%), by Application 2025 & 2033
- Figure 16: Europe 3d Cell Culture Revenue (million), by Type 2025 & 2033
- Figure 17: Europe 3d Cell Culture Revenue Share (%), by Type 2025 & 2033
- Figure 18: Europe 3d Cell Culture Revenue (million), by Country 2025 & 2033
- Figure 19: Europe 3d Cell Culture Revenue Share (%), by Country 2025 & 2033
- Figure 20: Middle East & Africa 3d Cell Culture Revenue (million), by Application 2025 & 2033
- Figure 21: Middle East & Africa 3d Cell Culture Revenue Share (%), by Application 2025 & 2033
- Figure 22: Middle East & Africa 3d Cell Culture Revenue (million), by Type 2025 & 2033
- Figure 23: Middle East & Africa 3d Cell Culture Revenue Share (%), by Type 2025 & 2033
- Figure 24: Middle East & Africa 3d Cell Culture Revenue (million), by Country 2025 & 2033
- Figure 25: Middle East & Africa 3d Cell Culture Revenue Share (%), by Country 2025 & 2033
- Figure 26: Asia Pacific 3d Cell Culture Revenue (million), by Application 2025 & 2033
- Figure 27: Asia Pacific 3d Cell Culture Revenue Share (%), by Application 2025 & 2033
- Figure 28: Asia Pacific 3d Cell Culture Revenue (million), by Type 2025 & 2033
- Figure 29: Asia Pacific 3d Cell Culture Revenue Share (%), by Type 2025 & 2033
- Figure 30: Asia Pacific 3d Cell Culture Revenue (million), by Country 2025 & 2033
- Figure 31: Asia Pacific 3d Cell Culture Revenue Share (%), by Country 2025 & 2033
List of Tables
- Table 1: Global 3d Cell Culture Revenue million Forecast, by Application 2020 & 2033
- Table 2: Global 3d Cell Culture Revenue million Forecast, by Type 2020 & 2033
- Table 3: Global 3d Cell Culture Revenue million Forecast, by Region 2020 & 2033
- Table 4: Global 3d Cell Culture Revenue million Forecast, by Application 2020 & 2033
- Table 5: Global 3d Cell Culture Revenue million Forecast, by Type 2020 & 2033
- Table 6: Global 3d Cell Culture Revenue million Forecast, by Country 2020 & 2033
- Table 7: United States 3d Cell Culture Revenue (million) Forecast, by Application 2020 & 2033
- Table 8: Canada 3d Cell Culture Revenue (million) Forecast, by Application 2020 & 2033
- Table 9: Mexico 3d Cell Culture Revenue (million) Forecast, by Application 2020 & 2033
- Table 10: Global 3d Cell Culture Revenue million Forecast, by Application 2020 & 2033
- Table 11: Global 3d Cell Culture Revenue million Forecast, by Type 2020 & 2033
- Table 12: Global 3d Cell Culture Revenue million Forecast, by Country 2020 & 2033
- Table 13: Brazil 3d Cell Culture Revenue (million) Forecast, by Application 2020 & 2033
- Table 14: Argentina 3d Cell Culture Revenue (million) Forecast, by Application 2020 & 2033
- Table 15: Rest of South America 3d Cell Culture Revenue (million) Forecast, by Application 2020 & 2033
- Table 16: Global 3d Cell Culture Revenue million Forecast, by Application 2020 & 2033
- Table 17: Global 3d Cell Culture Revenue million Forecast, by Type 2020 & 2033
- Table 18: Global 3d Cell Culture Revenue million Forecast, by Country 2020 & 2033
- Table 19: United Kingdom 3d Cell Culture Revenue (million) Forecast, by Application 2020 & 2033
- Table 20: Germany 3d Cell Culture Revenue (million) Forecast, by Application 2020 & 2033
- Table 21: France 3d Cell Culture Revenue (million) Forecast, by Application 2020 & 2033
- Table 22: Italy 3d Cell Culture Revenue (million) Forecast, by Application 2020 & 2033
- Table 23: Spain 3d Cell Culture Revenue (million) Forecast, by Application 2020 & 2033
- Table 24: Russia 3d Cell Culture Revenue (million) Forecast, by Application 2020 & 2033
- Table 25: Benelux 3d Cell Culture Revenue (million) Forecast, by Application 2020 & 2033
- Table 26: Nordics 3d Cell Culture Revenue (million) Forecast, by Application 2020 & 2033
- Table 27: Rest of Europe 3d Cell Culture Revenue (million) Forecast, by Application 2020 & 2033
- Table 28: Global 3d Cell Culture Revenue million Forecast, by Application 2020 & 2033
- Table 29: Global 3d Cell Culture Revenue million Forecast, by Type 2020 & 2033
- Table 30: Global 3d Cell Culture Revenue million Forecast, by Country 2020 & 2033
- Table 31: Turkey 3d Cell Culture Revenue (million) Forecast, by Application 2020 & 2033
- Table 32: Israel 3d Cell Culture Revenue (million) Forecast, by Application 2020 & 2033
- Table 33: GCC 3d Cell Culture Revenue (million) Forecast, by Application 2020 & 2033
- Table 34: North Africa 3d Cell Culture Revenue (million) Forecast, by Application 2020 & 2033
- Table 35: South Africa 3d Cell Culture Revenue (million) Forecast, by Application 2020 & 2033
- Table 36: Rest of Middle East & Africa 3d Cell Culture Revenue (million) Forecast, by Application 2020 & 2033
- Table 37: Global 3d Cell Culture Revenue million Forecast, by Application 2020 & 2033
- Table 38: Global 3d Cell Culture Revenue million Forecast, by Type 2020 & 2033
- Table 39: Global 3d Cell Culture Revenue million Forecast, by Country 2020 & 2033
- Table 40: China 3d Cell Culture Revenue (million) Forecast, by Application 2020 & 2033
- Table 41: India 3d Cell Culture Revenue (million) Forecast, by Application 2020 & 2033
- Table 42: Japan 3d Cell Culture Revenue (million) Forecast, by Application 2020 & 2033
- Table 43: South Korea 3d Cell Culture Revenue (million) Forecast, by Application 2020 & 2033
- Table 44: ASEAN 3d Cell Culture Revenue (million) Forecast, by Application 2020 & 2033
- Table 45: Oceania 3d Cell Culture Revenue (million) Forecast, by Application 2020 & 2033
- Table 46: Rest of Asia Pacific 3d Cell Culture Revenue (million) Forecast, by Application 2020 & 2033
Frequently Asked Questions
1. What is the projected Compound Annual Growth Rate (CAGR) of the 3d Cell Culture?
The projected CAGR is approximately 12.3%.
2. Which companies are prominent players in the 3d Cell Culture?
Key companies in the market include Thermo Fisher Scientific, Corning, Merck, Greiner Bio-One, Lonza Group, Emulate, TissUse, CN Bio, TARA Biosystems, Mimetas, Nortis, Reprocell Incorporated, Jet Bio-Filtration, InSphero AG, 3D Biotek.
3. What are the main segments of the 3d Cell Culture?
The market segments include Application, Type.
4. Can you provide details about the market size?
The market size is estimated to be USD 1134 million as of 2022.
5. What are some drivers contributing to market growth?
N/A
6. What are the notable trends driving market growth?
N/A
7. Are there any restraints impacting market growth?
N/A
8. Can you provide examples of recent developments in the market?
N/A
9. What pricing options are available for accessing the report?
Pricing options include single-user, multi-user, and enterprise licenses priced at USD 2900.00, USD 4350.00, and USD 5800.00 respectively.
10. Is the market size provided in terms of value or volume?
The market size is provided in terms of value, measured in million.
11. Are there any specific market keywords associated with the report?
Yes, the market keyword associated with the report is "3d Cell Culture," which aids in identifying and referencing the specific market segment covered.
12. How do I determine which pricing option suits my needs best?
The pricing options vary based on user requirements and access needs. Individual users may opt for single-user licenses, while businesses requiring broader access may choose multi-user or enterprise licenses for cost-effective access to the report.
13. Are there any additional resources or data provided in the 3d Cell Culture report?
While the report offers comprehensive insights, it's advisable to review the specific contents or supplementary materials provided to ascertain if additional resources or data are available.
14. How can I stay updated on further developments or reports in the 3d Cell Culture?
To stay informed about further developments, trends, and reports in the 3d Cell Culture, consider subscribing to industry newsletters, following relevant companies and organizations, or regularly checking reputable industry news sources and publications.
Methodology
Step 1 - Identification of Relevant Samples Size from Population Database


Step 2 - Approaches for Defining Global Market Size (Value, Volume* & Price*)

Note*: In applicable scenarios
Step 3 - Data Sources
Primary Research
- Web Analytics
- Survey Reports
- Research Institute
- Latest Research Reports
- Opinion Leaders
Secondary Research
- Annual Reports
- White Paper
- Latest Press Release
- Industry Association
- Paid Database
- Investor Presentations

Step 4 - Data Triangulation
Involves using different sources of information in order to increase the validity of a study
These sources are likely to be stakeholders in a program - participants, other researchers, program staff, other community members, and so on.
Then we put all data in single framework & apply various statistical tools to find out the dynamic on the market.
During the analysis stage, feedback from the stakeholder groups would be compared to determine areas of agreement as well as areas of divergence