

Key Insights
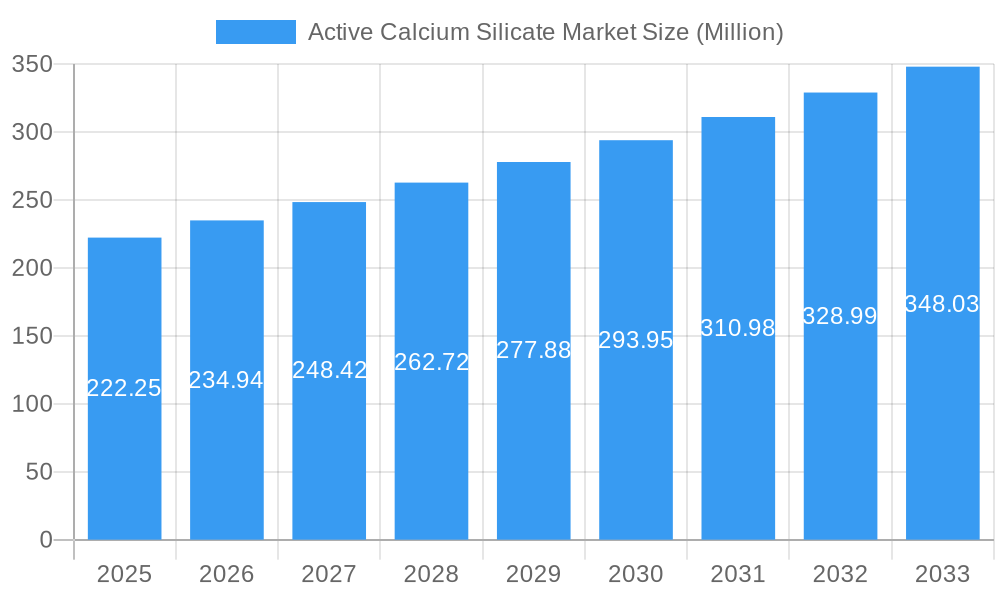
The Active Calcium Silicate market, valued at $222.25 million in 2025, is projected to experience robust growth, exhibiting a Compound Annual Growth Rate (CAGR) of 5.45% from 2025 to 2033. This expansion is driven by the increasing demand for energy-efficient building materials in the construction sector, particularly in insulation applications. The rising awareness of fire safety regulations and the consequent need for superior fire protection solutions further fuels market growth. Growing adoption in paints and coatings for enhanced durability and performance contributes significantly. Furthermore, the expanding ceramics and cement industries, requiring high-performance additives, are key market drivers. While the market faces certain restraints, such as price fluctuations of raw materials and potential environmental concerns related to production, the overall growth trajectory remains positive. Technological advancements focusing on improved thermal efficiency and fire resistance, alongside the development of eco-friendly manufacturing processes, are expected to mitigate these challenges. Geographically, North America and Europe currently hold significant market shares, driven by established construction industries and stringent building codes. However, the Asia-Pacific region is expected to witness the fastest growth, fueled by rapid urbanization and infrastructure development in countries like China and India. The competitive landscape comprises both established players and emerging regional manufacturers, fostering innovation and driving price competitiveness.
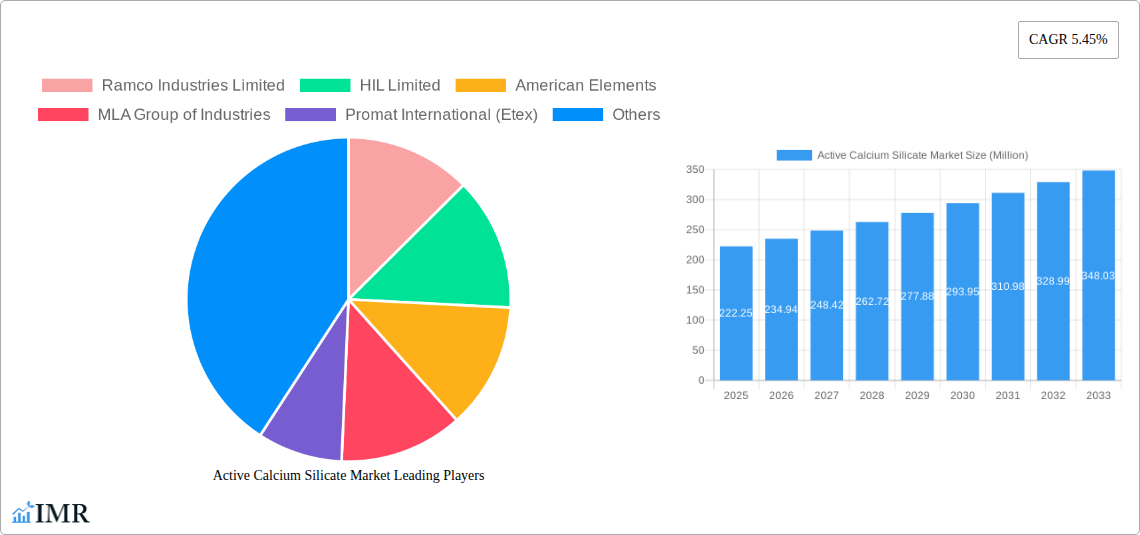
Active Calcium Silicate Market Market Size (In Million)
The major application segments – insulation, fire protection, paints & coatings, ceramics, and cement – each contribute significantly to the overall market value and growth. Insulation materials, leveraging the excellent thermal properties of active calcium silicate, represent a substantial portion of market demand. Fire protection applications capitalize on its inherent fire-resistant qualities, making it a crucial component in building safety systems. The incorporation of active calcium silicate in paints and coatings improves durability and resistance to degradation, while its use in ceramics and cement enhances product properties. Ongoing research and development efforts are focused on expanding the applications of active calcium silicate into new areas, such as advanced composites and specialized industrial materials, thereby opening up further growth opportunities. This suggests a promising future for the Active Calcium Silicate market, with sustained growth driven by technological advancements and expanding applications across various sectors.
Active Calcium Silicate Market Company Market Share
Active Calcium Silicate Market: A Comprehensive Report (2019-2033)
This in-depth report provides a comprehensive analysis of the Active Calcium Silicate market, encompassing market dynamics, growth trends, regional dominance, product landscape, key players, and future outlook. The study covers the period from 2019 to 2033, with 2025 as the base year and a forecast period of 2025-2033. The parent market is the broader silicate market, while the child market focuses specifically on active calcium silicate materials and their diverse applications. This report is crucial for industry professionals, investors, and strategic decision-makers seeking a detailed understanding of this evolving market, valued at xx Million units in 2025 and projected to reach xx Million units by 2033.
Active Calcium Silicate Market Market Dynamics & Structure
The Active Calcium Silicate market is a dynamic and evolving landscape, shaped by a confluence of competitive forces, technological advancements, and regulatory frameworks. Market concentration is currently at a moderate level, with a handful of leading manufacturers capturing a substantial portion of market share. However, this is balanced by a vibrant ecosystem of smaller, specialized players who contribute significantly to innovation and cater to niche applications. Technological progress remains a critical differentiator, with a persistent focus on enhancing thermal insulation capabilities, improving fire-resistant properties, and developing lighter-weight, more user-friendly products. Stringent environmental regulations are not only influencing manufacturing processes but also driving the development of more sustainable and eco-friendly Active Calcium Silicate formulations. The market is also experiencing shifts in end-user preferences, with a growing emphasis on performance, durability, and sustainability.
- Market Concentration: Moderately concentrated, with the top 5 players projected to hold approximately 60-65% of the market share in 2025. The landscape features a mix of global leaders and regional specialists, fostering a competitive environment.
- Technological Innovation: A key focus is on developing next-generation Active Calcium Silicate materials with superior thermal insulation properties, enhanced fire-resistant capabilities (meeting higher fire safety standards), and improved mechanical strength. Research into nano-material integration and advanced manufacturing techniques is ongoing.
- Regulatory Framework: Stringent environmental regulations are a significant factor, influencing product composition, manufacturing emissions, and waste management. Compliance with building codes related to fire safety and energy efficiency is also a major driver for product adoption.
- Competitive Substitutes: While Active Calcium Silicate offers distinct advantages, it faces competition from established insulation materials like mineral wool, fiberglass, and expanded polystyrene (EPS). The market share of substitutes is influenced by cost-effectiveness, specific performance requirements, and ease of installation for particular applications.
- End-User Demographics: The primary end-user sectors include the construction industry (residential, commercial, and industrial buildings), industrial insulation (piping, furnaces, and equipment), and the automotive sector (thermal and acoustic insulation). Growth in infrastructure development and industrial expansion directly impacts demand.
- M&A Trends: The market has witnessed a moderate level of merger and acquisition (M&A) activity. These activities are primarily driven by strategic objectives such as expanding geographical reach into new and emerging markets, acquiring complementary technological capabilities, and consolidating market positions. Approximately 5-8 significant M&A deals were observed during the historical period (2019-2024).
Active Calcium Silicate Market Growth Trends & Insights
The Active Calcium Silicate market is on a robust growth trajectory, propelled by the increasing global demand for high-performance insulation and fireproofing solutions. The market size experienced a Compound Annual Growth Rate (CAGR) of approximately 5.5% during the historical period (2019-2024) and is projected to sustain a healthy CAGR of around 6.0% to 6.5% during the forecast period (2025-2033). This upward trend is underpinned by several critical factors: escalating infrastructure development worldwide, a growing emphasis on energy efficiency in buildings and industrial processes, and increasingly stringent fire safety regulations. Technological advancements, including the development of more lightweight, higher-performing, and easier-to-install Active Calcium Silicate materials, are further accelerating market expansion. Consumer and industry preferences are increasingly leaning towards eco-friendly and sustainable building materials, which directly benefits the adoption of Active Calcium Silicate products. Furthermore, significant market penetration opportunities are anticipated in emerging economies, particularly in Asia-Pacific and Latin America, which will contribute substantially to the overall market growth.
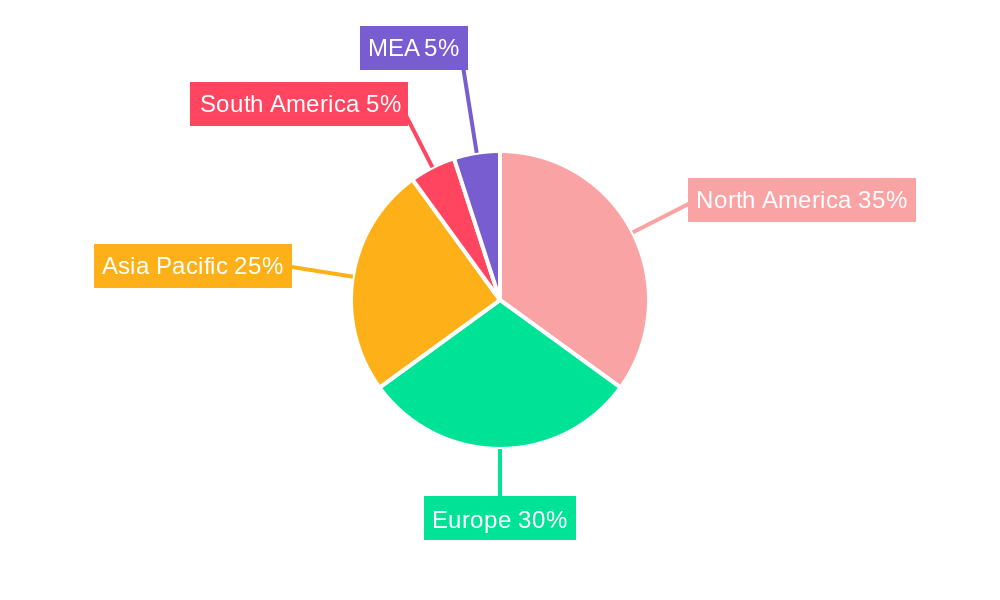
Dominant Regions, Countries, or Segments in Active Calcium Silicate Market
North America currently dominates the Active Calcium Silicate market, driven by robust construction activity and stringent building codes. However, Asia-Pacific is projected to experience the highest growth rate during the forecast period due to rapid urbanization and industrialization. Europe also holds a significant market share. Within the application segments, insulation holds the largest market share, followed by fire protection.
- North America: High adoption rate driven by stringent building codes and energy efficiency standards.
- Asia-Pacific: Fastest-growing region due to rapid urbanization and industrial expansion.
- Europe: Significant market share driven by established construction sector and environmental regulations.
- Application Segments: Insulation (xx Million units in 2025), Fire Protection (xx Million units in 2025), Paints & Coatings (xx Million units in 2025), Ceramics (xx Million units in 2025), Cement (xx Million units in 2025), Others (xx Million units in 2025).
Active Calcium Silicate Market Product Landscape
The Active Calcium Silicate product portfolio is diverse, catering to a wide array of applications. Key product forms include rigid boards, flexible blankets, and fine powders, each engineered with specific properties to meet distinct performance requirements. Recent innovations have been heavily focused on enhancing thermal insulation efficiency, improving fire resistance to meet evolving safety standards, and optimizing acoustic dampening capabilities. The industry is witnessing a rising demand for lightweight, high-performance materials that offer improved durability, ease of handling, and simplified installation processes. The unique selling propositions of Active Calcium Silicate products revolve around their superior thermal efficiency, excellent fire protection properties, and their inherent environmental friendliness. Technological advancements are also exploring the integration of nano-materials to further enhance performance characteristics, leading to the development of cutting-edge solutions for demanding applications.
Key Drivers, Barriers & Challenges in Active Calcium Silicate Market
Key Drivers: The primary catalysts for the Active Calcium Silicate market's growth include the escalating demand for energy-efficient and fire-resistant building materials, driven by global concerns for sustainability and safety. Stringent building codes and evolving environmental regulations are compelling industries to adopt advanced insulation solutions. Furthermore, supportive government initiatives promoting sustainable construction practices and energy conservation are significantly bolstering market expansion. The robust growth witnessed in the construction and industrial sectors, particularly in emerging economies, directly fuels the demand for Active Calcium Silicate products.
Challenges: The market faces several hurdles. Fluctuations in the prices of key raw materials, such as silica and calcium sources, can impact manufacturing costs and profitability. Intense competition from established and alternative insulation materials, often at lower price points, presents a constant challenge. Supply chain disruptions, exacerbated by global events, can lead to delays and increased logistical costs. Moreover, meeting increasingly stringent environmental regulations, while beneficial for sustainability, can add to manufacturing complexity and costs, requiring continuous investment in process optimization and compliance.
Emerging Opportunities in Active Calcium Silicate Market
Significant untapped markets in developing economies, particularly in the rapidly expanding Asia-Pacific and Latin America regions, present substantial growth opportunities for Active Calcium Silicate manufacturers. The increasing adoption of advanced construction techniques, such as pre-fabricated modular buildings and innovative architectural designs, creates potential for specialized Active Calcium Silicate solutions. The growing global imperative for sustainable and eco-friendly building materials is a major driving force, opening avenues for the development and commercialization of advanced, low-carbon footprint Active Calcium Silicate products. Furthermore, the exploration of novel applications in sectors like renewable energy infrastructure (e.g., insulation for solar panels and wind turbines) and high-temperature industrial processes offers promising avenues for market expansion and product diversification.
Growth Accelerators in the Active Calcium Silicate Market Industry
Technological advancements in material science leading to improved performance characteristics are key growth catalysts. Strategic partnerships between manufacturers and construction companies can accelerate market penetration. Expansion into new geographic markets and diversification of product offerings will further fuel market growth.
Key Players Shaping the Active Calcium Silicate Market Market
- Ramco Industries Limited
- HIL Limited
- American Elements
- MLA Group of Industries
- Promat International (Etex)
- Sibelco
- Skamol Group
- Weifang Hongyuan Chemical Co Ltd
- Johns Manville
- Xella Group
Notable Milestones in Active Calcium Silicate Market Sector
- 2022: Introduction of a new, high-performance Active Calcium Silicate board by Xella Group.
- 2023: Promat International (Etex) expands its manufacturing capacity in Asia.
- 2024: Johns Manville launches a sustainable Active Calcium Silicate product line.
In-Depth Active Calcium Silicate Market Market Outlook
The Active Calcium Silicate market is poised for continued growth, driven by several factors including increasing demand for sustainable building materials, technological advancements, and expanding construction activity globally. Strategic partnerships and investments in research and development will further shape the market landscape. The focus on developing innovative and high-performance materials will be crucial for sustained growth and market leadership.
Active Calcium Silicate Market Segmentation
-
1. Application
- 1.1. Insulation
- 1.2. Fire Protection
- 1.3. Paints & Coatings
- 1.4. Ceramics
- 1.5. Cement
- 1.6. Others
Active Calcium Silicate Market Segmentation By Geography
-
1. Asia Pacific
- 1.1. China
- 1.2. India
- 1.3. Japan
- 1.4. South Korea
- 1.5. Rest of Asia Pacific
-
2. North America
- 2.1. United States
- 2.2. Canada
- 2.3. Mexico
-
3. Europe
- 3.1. Germany
- 3.2. United Kingdom
- 3.3. France
- 3.4. Italy
- 3.5. Rest of Europe
-
4. South America
- 4.1. Brazil
- 4.2. Argentina
- 4.3. Rest of South America
-
5. Middle East and Africa
- 5.1. Saudi Arabia
- 5.2. South Africa
- 5.3. Rest of Middle East and Africa
Active Calcium Silicate Market Regional Market Share
Geographic Coverage of Active Calcium Silicate Market
Active Calcium Silicate Market REPORT HIGHLIGHTS
| Aspects | Details |
|---|---|
| Study Period | 2020-2034 |
| Base Year | 2025 |
| Estimated Year | 2026 |
| Forecast Period | 2026-2034 |
| Historical Period | 2020-2025 |
| Growth Rate | CAGR of 5.45% from 2020-2034 |
| Segmentation |
|
Table of Contents
- 1. Introduction
- 1.1. Research Scope
- 1.2. Market Segmentation
- 1.3. Research Objective
- 1.4. Definitions and Assumptions
- 2. Executive Summary
- 2.1. Market Snapshot
- 3. Market Dynamics
- 3.1. Market Drivers
- 3.2. Market Restrains
- 3.3. Market Trends
- 3.4. Market Opportunities
- 4. Market Factor Analysis
- 4.1. Porters Five Forces
- 4.1.1. Bargaining Power of Suppliers
- 4.1.2. Bargaining Power of Buyers
- 4.1.3. Threat of New Entrants
- 4.1.4. Threat of Substitutes
- 4.1.5. Competitive Rivalry
- 4.2. PESTEL analysis
- 4.3. BCG Analysis
- 4.3.1. Stars (High Growth, High Market Share)
- 4.3.2. Cash Cows (Low Growth, High Market Share)
- 4.3.3. Question Mark (High Growth, Low Market Share)
- 4.3.4. Dogs (Low Growth, Low Market Share)
- 4.4. Ansoff Matrix Analysis
- 4.5. Supply Chain Analysis
- 4.6. Regulatory Landscape
- 4.7. Current Market Potential and Opportunity Assessment (TAM–SAM–SOM Framework)
- 4.8. IMR Analyst Note
- 4.1. Porters Five Forces
- 5. Market Analysis, Insights and Forecast 2021-2033
- 5.1. Market Analysis, Insights and Forecast - by Application
- 5.1.1. Insulation
- 5.1.2. Fire Protection
- 5.1.3. Paints & Coatings
- 5.1.4. Ceramics
- 5.1.5. Cement
- 5.1.6. Others
- 5.2. Market Analysis, Insights and Forecast - by Region
- 5.2.1. Asia Pacific
- 5.2.2. North America
- 5.2.3. Europe
- 5.2.4. South America
- 5.2.5. Middle East and Africa
- 5.1. Market Analysis, Insights and Forecast - by Application
- 6. Global Active Calcium Silicate Market Analysis, Insights and Forecast, 2021-2033
- 6.1. Market Analysis, Insights and Forecast - by Application
- 6.1.1. Insulation
- 6.1.2. Fire Protection
- 6.1.3. Paints & Coatings
- 6.1.4. Ceramics
- 6.1.5. Cement
- 6.1.6. Others
- 6.1. Market Analysis, Insights and Forecast - by Application
- 7. Asia Pacific Active Calcium Silicate Market Analysis, Insights and Forecast, 2020-2032
- 7.1. Market Analysis, Insights and Forecast - by Application
- 7.1.1. Insulation
- 7.1.2. Fire Protection
- 7.1.3. Paints & Coatings
- 7.1.4. Ceramics
- 7.1.5. Cement
- 7.1.6. Others
- 7.1. Market Analysis, Insights and Forecast - by Application
- 8. North America Active Calcium Silicate Market Analysis, Insights and Forecast, 2020-2032
- 8.1. Market Analysis, Insights and Forecast - by Application
- 8.1.1. Insulation
- 8.1.2. Fire Protection
- 8.1.3. Paints & Coatings
- 8.1.4. Ceramics
- 8.1.5. Cement
- 8.1.6. Others
- 8.1. Market Analysis, Insights and Forecast - by Application
- 9. Europe Active Calcium Silicate Market Analysis, Insights and Forecast, 2020-2032
- 9.1. Market Analysis, Insights and Forecast - by Application
- 9.1.1. Insulation
- 9.1.2. Fire Protection
- 9.1.3. Paints & Coatings
- 9.1.4. Ceramics
- 9.1.5. Cement
- 9.1.6. Others
- 9.1. Market Analysis, Insights and Forecast - by Application
- 10. South America Active Calcium Silicate Market Analysis, Insights and Forecast, 2020-2032
- 10.1. Market Analysis, Insights and Forecast - by Application
- 10.1.1. Insulation
- 10.1.2. Fire Protection
- 10.1.3. Paints & Coatings
- 10.1.4. Ceramics
- 10.1.5. Cement
- 10.1.6. Others
- 10.1. Market Analysis, Insights and Forecast - by Application
- 11. Middle East and Africa Active Calcium Silicate Market Analysis, Insights and Forecast, 2020-2032
- 11.1. Market Analysis, Insights and Forecast - by Application
- 11.1.1. Insulation
- 11.1.2. Fire Protection
- 11.1.3. Paints & Coatings
- 11.1.4. Ceramics
- 11.1.5. Cement
- 11.1.6. Others
- 11.1. Market Analysis, Insights and Forecast - by Application
- 12. Competitive Analysis
- 12.1. Company Profiles
- 12.1.1 Ramco Industries Limited
- 12.1.1.1. Company Overview
- 12.1.1.2. Products
- 12.1.1.3. Company Financials
- 12.1.1.4. SWOT Analysis
- 12.1.2 HIL Limited
- 12.1.2.1. Company Overview
- 12.1.2.2. Products
- 12.1.2.3. Company Financials
- 12.1.2.4. SWOT Analysis
- 12.1.3 American Elements
- 12.1.3.1. Company Overview
- 12.1.3.2. Products
- 12.1.3.3. Company Financials
- 12.1.3.4. SWOT Analysis
- 12.1.4 MLA Group of Industries
- 12.1.4.1. Company Overview
- 12.1.4.2. Products
- 12.1.4.3. Company Financials
- 12.1.4.4. SWOT Analysis
- 12.1.5 Promat International (Etex)
- 12.1.5.1. Company Overview
- 12.1.5.2. Products
- 12.1.5.3. Company Financials
- 12.1.5.4. SWOT Analysis
- 12.1.6 Sibelco
- 12.1.6.1. Company Overview
- 12.1.6.2. Products
- 12.1.6.3. Company Financials
- 12.1.6.4. SWOT Analysis
- 12.1.7 Skamol Group
- 12.1.7.1. Company Overview
- 12.1.7.2. Products
- 12.1.7.3. Company Financials
- 12.1.7.4. SWOT Analysis
- 12.1.8 Weifang Hongyuan Chemical Co Ltd
- 12.1.8.1. Company Overview
- 12.1.8.2. Products
- 12.1.8.3. Company Financials
- 12.1.8.4. SWOT Analysis
- 12.1.9 Johns Manville
- 12.1.9.1. Company Overview
- 12.1.9.2. Products
- 12.1.9.3. Company Financials
- 12.1.9.4. SWOT Analysis
- 12.1.10 Xella Group
- 12.1.10.1. Company Overview
- 12.1.10.2. Products
- 12.1.10.3. Company Financials
- 12.1.10.4. SWOT Analysis
- 12.1.1 Ramco Industries Limited
- 12.2. Market Entropy
- 12.2.1 Company's Key Areas Served
- 12.2.2 Recent Developments
- 12.3. Company Market Share Analysis 2025
- 12.3.1 Top 5 Companies Market Share Analysis
- 12.3.2 Top 3 Companies Market Share Analysis
- 12.4. List of Potential Customers
- 13. Research Methodology
List of Figures
- Figure 1: Global Active Calcium Silicate Market Revenue Breakdown (Million, %) by Region 2025 & 2033
- Figure 2: Global Active Calcium Silicate Market Volume Breakdown (K Tons, %) by Region 2025 & 2033
- Figure 3: Asia Pacific Active Calcium Silicate Market Revenue (Million), by Application 2025 & 2033
- Figure 4: Asia Pacific Active Calcium Silicate Market Volume (K Tons), by Application 2025 & 2033
- Figure 5: Asia Pacific Active Calcium Silicate Market Revenue Share (%), by Application 2025 & 2033
- Figure 6: Asia Pacific Active Calcium Silicate Market Volume Share (%), by Application 2025 & 2033
- Figure 7: Asia Pacific Active Calcium Silicate Market Revenue (Million), by Country 2025 & 2033
- Figure 8: Asia Pacific Active Calcium Silicate Market Volume (K Tons), by Country 2025 & 2033
- Figure 9: Asia Pacific Active Calcium Silicate Market Revenue Share (%), by Country 2025 & 2033
- Figure 10: Asia Pacific Active Calcium Silicate Market Volume Share (%), by Country 2025 & 2033
- Figure 11: North America Active Calcium Silicate Market Revenue (Million), by Application 2025 & 2033
- Figure 12: North America Active Calcium Silicate Market Volume (K Tons), by Application 2025 & 2033
- Figure 13: North America Active Calcium Silicate Market Revenue Share (%), by Application 2025 & 2033
- Figure 14: North America Active Calcium Silicate Market Volume Share (%), by Application 2025 & 2033
- Figure 15: North America Active Calcium Silicate Market Revenue (Million), by Country 2025 & 2033
- Figure 16: North America Active Calcium Silicate Market Volume (K Tons), by Country 2025 & 2033
- Figure 17: North America Active Calcium Silicate Market Revenue Share (%), by Country 2025 & 2033
- Figure 18: North America Active Calcium Silicate Market Volume Share (%), by Country 2025 & 2033
- Figure 19: Europe Active Calcium Silicate Market Revenue (Million), by Application 2025 & 2033
- Figure 20: Europe Active Calcium Silicate Market Volume (K Tons), by Application 2025 & 2033
- Figure 21: Europe Active Calcium Silicate Market Revenue Share (%), by Application 2025 & 2033
- Figure 22: Europe Active Calcium Silicate Market Volume Share (%), by Application 2025 & 2033
- Figure 23: Europe Active Calcium Silicate Market Revenue (Million), by Country 2025 & 2033
- Figure 24: Europe Active Calcium Silicate Market Volume (K Tons), by Country 2025 & 2033
- Figure 25: Europe Active Calcium Silicate Market Revenue Share (%), by Country 2025 & 2033
- Figure 26: Europe Active Calcium Silicate Market Volume Share (%), by Country 2025 & 2033
- Figure 27: South America Active Calcium Silicate Market Revenue (Million), by Application 2025 & 2033
- Figure 28: South America Active Calcium Silicate Market Volume (K Tons), by Application 2025 & 2033
- Figure 29: South America Active Calcium Silicate Market Revenue Share (%), by Application 2025 & 2033
- Figure 30: South America Active Calcium Silicate Market Volume Share (%), by Application 2025 & 2033
- Figure 31: South America Active Calcium Silicate Market Revenue (Million), by Country 2025 & 2033
- Figure 32: South America Active Calcium Silicate Market Volume (K Tons), by Country 2025 & 2033
- Figure 33: South America Active Calcium Silicate Market Revenue Share (%), by Country 2025 & 2033
- Figure 34: South America Active Calcium Silicate Market Volume Share (%), by Country 2025 & 2033
- Figure 35: Middle East and Africa Active Calcium Silicate Market Revenue (Million), by Application 2025 & 2033
- Figure 36: Middle East and Africa Active Calcium Silicate Market Volume (K Tons), by Application 2025 & 2033
- Figure 37: Middle East and Africa Active Calcium Silicate Market Revenue Share (%), by Application 2025 & 2033
- Figure 38: Middle East and Africa Active Calcium Silicate Market Volume Share (%), by Application 2025 & 2033
- Figure 39: Middle East and Africa Active Calcium Silicate Market Revenue (Million), by Country 2025 & 2033
- Figure 40: Middle East and Africa Active Calcium Silicate Market Volume (K Tons), by Country 2025 & 2033
- Figure 41: Middle East and Africa Active Calcium Silicate Market Revenue Share (%), by Country 2025 & 2033
- Figure 42: Middle East and Africa Active Calcium Silicate Market Volume Share (%), by Country 2025 & 2033
List of Tables
- Table 1: Global Active Calcium Silicate Market Revenue Million Forecast, by Application 2020 & 2033
- Table 2: Global Active Calcium Silicate Market Volume K Tons Forecast, by Application 2020 & 2033
- Table 3: Global Active Calcium Silicate Market Revenue Million Forecast, by Region 2020 & 2033
- Table 4: Global Active Calcium Silicate Market Volume K Tons Forecast, by Region 2020 & 2033
- Table 5: Global Active Calcium Silicate Market Revenue Million Forecast, by Application 2020 & 2033
- Table 6: Global Active Calcium Silicate Market Volume K Tons Forecast, by Application 2020 & 2033
- Table 7: Global Active Calcium Silicate Market Revenue Million Forecast, by Country 2020 & 2033
- Table 8: Global Active Calcium Silicate Market Volume K Tons Forecast, by Country 2020 & 2033
- Table 9: China Active Calcium Silicate Market Revenue (Million) Forecast, by Application 2020 & 2033
- Table 10: China Active Calcium Silicate Market Volume (K Tons) Forecast, by Application 2020 & 2033
- Table 11: India Active Calcium Silicate Market Revenue (Million) Forecast, by Application 2020 & 2033
- Table 12: India Active Calcium Silicate Market Volume (K Tons) Forecast, by Application 2020 & 2033
- Table 13: Japan Active Calcium Silicate Market Revenue (Million) Forecast, by Application 2020 & 2033
- Table 14: Japan Active Calcium Silicate Market Volume (K Tons) Forecast, by Application 2020 & 2033
- Table 15: South Korea Active Calcium Silicate Market Revenue (Million) Forecast, by Application 2020 & 2033
- Table 16: South Korea Active Calcium Silicate Market Volume (K Tons) Forecast, by Application 2020 & 2033
- Table 17: Rest of Asia Pacific Active Calcium Silicate Market Revenue (Million) Forecast, by Application 2020 & 2033
- Table 18: Rest of Asia Pacific Active Calcium Silicate Market Volume (K Tons) Forecast, by Application 2020 & 2033
- Table 19: Global Active Calcium Silicate Market Revenue Million Forecast, by Application 2020 & 2033
- Table 20: Global Active Calcium Silicate Market Volume K Tons Forecast, by Application 2020 & 2033
- Table 21: Global Active Calcium Silicate Market Revenue Million Forecast, by Country 2020 & 2033
- Table 22: Global Active Calcium Silicate Market Volume K Tons Forecast, by Country 2020 & 2033
- Table 23: United States Active Calcium Silicate Market Revenue (Million) Forecast, by Application 2020 & 2033
- Table 24: United States Active Calcium Silicate Market Volume (K Tons) Forecast, by Application 2020 & 2033
- Table 25: Canada Active Calcium Silicate Market Revenue (Million) Forecast, by Application 2020 & 2033
- Table 26: Canada Active Calcium Silicate Market Volume (K Tons) Forecast, by Application 2020 & 2033
- Table 27: Mexico Active Calcium Silicate Market Revenue (Million) Forecast, by Application 2020 & 2033
- Table 28: Mexico Active Calcium Silicate Market Volume (K Tons) Forecast, by Application 2020 & 2033
- Table 29: Global Active Calcium Silicate Market Revenue Million Forecast, by Application 2020 & 2033
- Table 30: Global Active Calcium Silicate Market Volume K Tons Forecast, by Application 2020 & 2033
- Table 31: Global Active Calcium Silicate Market Revenue Million Forecast, by Country 2020 & 2033
- Table 32: Global Active Calcium Silicate Market Volume K Tons Forecast, by Country 2020 & 2033
- Table 33: Germany Active Calcium Silicate Market Revenue (Million) Forecast, by Application 2020 & 2033
- Table 34: Germany Active Calcium Silicate Market Volume (K Tons) Forecast, by Application 2020 & 2033
- Table 35: United Kingdom Active Calcium Silicate Market Revenue (Million) Forecast, by Application 2020 & 2033
- Table 36: United Kingdom Active Calcium Silicate Market Volume (K Tons) Forecast, by Application 2020 & 2033
- Table 37: France Active Calcium Silicate Market Revenue (Million) Forecast, by Application 2020 & 2033
- Table 38: France Active Calcium Silicate Market Volume (K Tons) Forecast, by Application 2020 & 2033
- Table 39: Italy Active Calcium Silicate Market Revenue (Million) Forecast, by Application 2020 & 2033
- Table 40: Italy Active Calcium Silicate Market Volume (K Tons) Forecast, by Application 2020 & 2033
- Table 41: Rest of Europe Active Calcium Silicate Market Revenue (Million) Forecast, by Application 2020 & 2033
- Table 42: Rest of Europe Active Calcium Silicate Market Volume (K Tons) Forecast, by Application 2020 & 2033
- Table 43: Global Active Calcium Silicate Market Revenue Million Forecast, by Application 2020 & 2033
- Table 44: Global Active Calcium Silicate Market Volume K Tons Forecast, by Application 2020 & 2033
- Table 45: Global Active Calcium Silicate Market Revenue Million Forecast, by Country 2020 & 2033
- Table 46: Global Active Calcium Silicate Market Volume K Tons Forecast, by Country 2020 & 2033
- Table 47: Brazil Active Calcium Silicate Market Revenue (Million) Forecast, by Application 2020 & 2033
- Table 48: Brazil Active Calcium Silicate Market Volume (K Tons) Forecast, by Application 2020 & 2033
- Table 49: Argentina Active Calcium Silicate Market Revenue (Million) Forecast, by Application 2020 & 2033
- Table 50: Argentina Active Calcium Silicate Market Volume (K Tons) Forecast, by Application 2020 & 2033
- Table 51: Rest of South America Active Calcium Silicate Market Revenue (Million) Forecast, by Application 2020 & 2033
- Table 52: Rest of South America Active Calcium Silicate Market Volume (K Tons) Forecast, by Application 2020 & 2033
- Table 53: Global Active Calcium Silicate Market Revenue Million Forecast, by Application 2020 & 2033
- Table 54: Global Active Calcium Silicate Market Volume K Tons Forecast, by Application 2020 & 2033
- Table 55: Global Active Calcium Silicate Market Revenue Million Forecast, by Country 2020 & 2033
- Table 56: Global Active Calcium Silicate Market Volume K Tons Forecast, by Country 2020 & 2033
- Table 57: Saudi Arabia Active Calcium Silicate Market Revenue (Million) Forecast, by Application 2020 & 2033
- Table 58: Saudi Arabia Active Calcium Silicate Market Volume (K Tons) Forecast, by Application 2020 & 2033
- Table 59: South Africa Active Calcium Silicate Market Revenue (Million) Forecast, by Application 2020 & 2033
- Table 60: South Africa Active Calcium Silicate Market Volume (K Tons) Forecast, by Application 2020 & 2033
- Table 61: Rest of Middle East and Africa Active Calcium Silicate Market Revenue (Million) Forecast, by Application 2020 & 2033
- Table 62: Rest of Middle East and Africa Active Calcium Silicate Market Volume (K Tons) Forecast, by Application 2020 & 2033
Frequently Asked Questions
1. What is the projected Compound Annual Growth Rate (CAGR) of the Active Calcium Silicate Market?
The projected CAGR is approximately 5.45%.
2. Which companies are prominent players in the Active Calcium Silicate Market?
Key companies in the market include Ramco Industries Limited, HIL Limited, American Elements, MLA Group of Industries, Promat International (Etex), Sibelco, Skamol Group, Weifang Hongyuan Chemical Co Ltd, Johns Manville, Xella Group.
3. What are the main segments of the Active Calcium Silicate Market?
The market segments include Application.
4. Can you provide details about the market size?
The market size is estimated to be USD 222.25 Million as of 2022.
5. What are some drivers contributing to market growth?
Growing Demand from the Construction Industry in Asia-Pacific; Increasing Usage in the Ceramic Industry; Other Drivers.
6. What are the notable trends driving market growth?
Growing Demand from Insulation and Fire Protection Segment.
7. Are there any restraints impacting market growth?
Stringent Regulations Pertaining to Permissible Exposure Limit of the Product; Other Restraints.
8. Can you provide examples of recent developments in the market?
N/A
9. What pricing options are available for accessing the report?
Pricing options include single-user, multi-user, and enterprise licenses priced at USD 4750, USD 5250, and USD 8750 respectively.
10. Is the market size provided in terms of value or volume?
The market size is provided in terms of value, measured in Million and volume, measured in K Tons.
11. Are there any specific market keywords associated with the report?
Yes, the market keyword associated with the report is "Active Calcium Silicate Market," which aids in identifying and referencing the specific market segment covered.
12. How do I determine which pricing option suits my needs best?
The pricing options vary based on user requirements and access needs. Individual users may opt for single-user licenses, while businesses requiring broader access may choose multi-user or enterprise licenses for cost-effective access to the report.
13. Are there any additional resources or data provided in the Active Calcium Silicate Market report?
While the report offers comprehensive insights, it's advisable to review the specific contents or supplementary materials provided to ascertain if additional resources or data are available.
14. How can I stay updated on further developments or reports in the Active Calcium Silicate Market?
To stay informed about further developments, trends, and reports in the Active Calcium Silicate Market, consider subscribing to industry newsletters, following relevant companies and organizations, or regularly checking reputable industry news sources and publications.
Methodology
Step 1 - Identification of Relevant Samples Size from Population Database


Step 2 - Approaches for Defining Global Market Size (Value, Volume* & Price*)

Note*: In applicable scenarios
Step 3 - Data Sources
Primary Research
- Web Analytics
- Survey Reports
- Research Institute
- Latest Research Reports
- Opinion Leaders
Secondary Research
- Annual Reports
- White Paper
- Latest Press Release
- Industry Association
- Paid Database
- Investor Presentations

Step 4 - Data Triangulation
Involves using different sources of information in order to increase the validity of a study
These sources are likely to be stakeholders in a program - participants, other researchers, program staff, other community members, and so on.
Then we put all data in single framework & apply various statistical tools to find out the dynamic on the market.
During the analysis stage, feedback from the stakeholder groups would be compared to determine areas of agreement as well as areas of divergence