

Key Insights
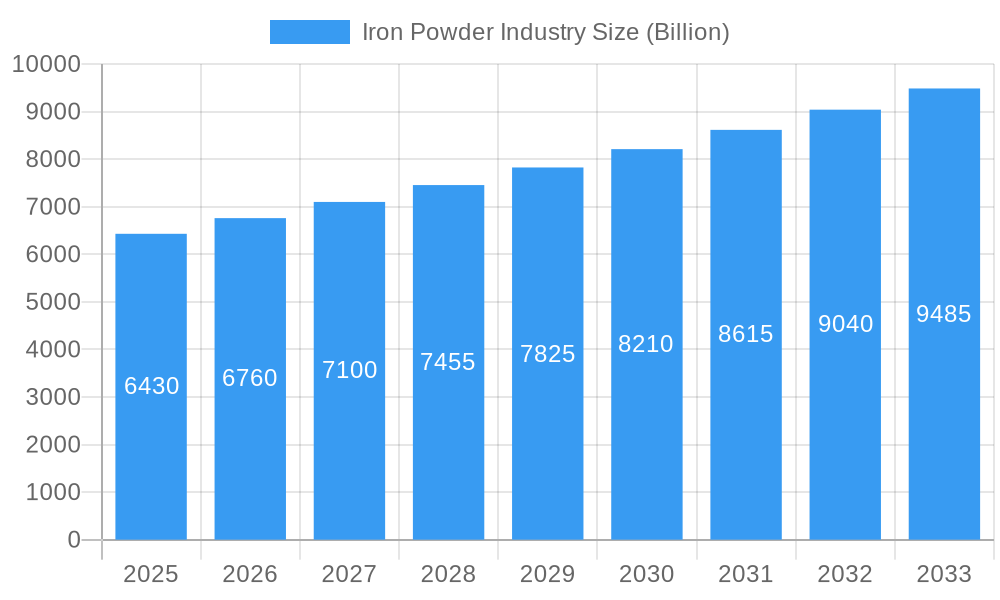
The global Iron Powder Market is poised for robust expansion, projected to reach a substantial USD 6.43 billion by 2025 and continue its upward trajectory to USD 10.64 billion by 2033, driven by an impressive Compound Annual Growth Rate (CAGR) of 5.2% during the forecast period of 2025-2033. This growth is underpinned by the increasing demand from key end-user industries, particularly the automotive sector, where iron powder is integral to the production of sintered components, magnetic materials, and friction materials. The chemical industry also represents a significant driver, utilizing iron powder as a catalyst and in various chemical processes. Furthermore, the "General Industrial" segment is experiencing steady growth, fueled by the demand for metal injection molding (MIM) and additive manufacturing applications. Emerging trends such as the development of advanced iron powder grades with enhanced properties and the increasing adoption of sustainable manufacturing practices are further stimulating market growth.
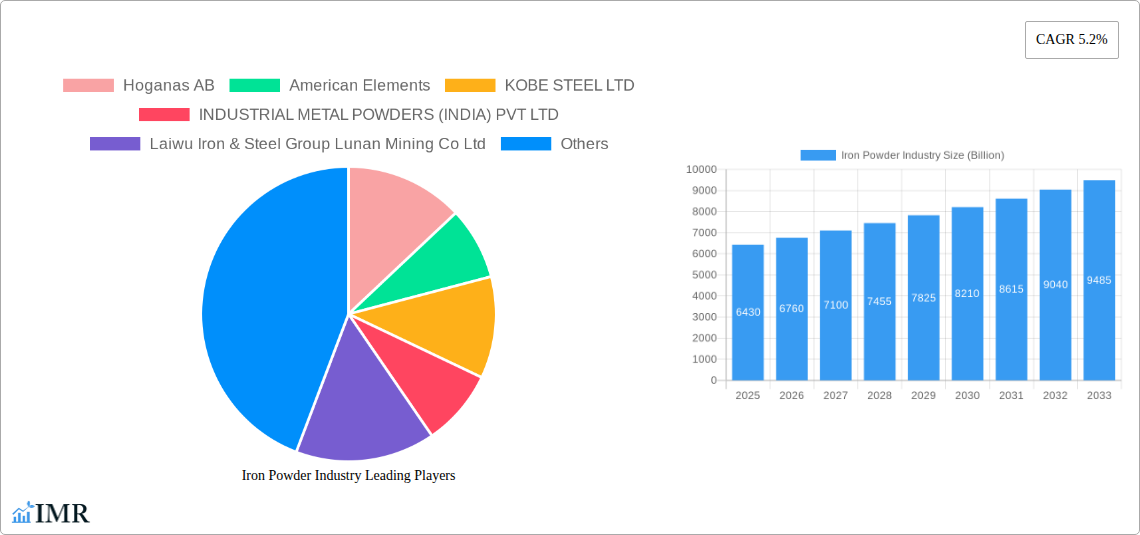
Iron Powder Industry Market Size (In Billion)
However, the market is not without its challenges. Fluctuations in raw material prices, particularly iron ore, can impact profitability and lead to price volatility for iron powder manufacturers. Stringent environmental regulations regarding powder production and handling also pose a restraint, necessitating investment in compliant technologies and processes. Despite these hurdles, the market's inherent dynamism, coupled with innovation in product development and application diversification, is expected to propel its continued expansion. Asia Pacific is anticipated to remain a dominant region, driven by rapid industrialization in countries like China and India, while North America and Europe continue to be significant markets due to their established automotive and industrial bases.
Iron Powder Industry Company Market Share
Gain unparalleled insights into the global iron powder market with this in-depth report. Spanning the historical period of 2019-2024, the base year of 2025, and an extensive forecast period of 2025-2033, this analysis delves into market dynamics, growth trends, product landscapes, and key players. Understand the intricate interplay of parent and child markets, identifying critical drivers, emerging opportunities, and formidable challenges shaping the future of iron powder applications across diverse end-user industries like Automotive, Chemical, General Industrial, and Food. This report provides actionable intelligence for stakeholders seeking to navigate and capitalize on the evolving iron powder sector.
Iron Powder Industry Market Dynamics & Structure
The iron powder market exhibits a moderate level of concentration, with leading players like Hoganas AB, American Elements, KOBE STEEL LTD, and INDUSTRIAL METAL POWDERS (INDIA) PVT LTD holding significant market shares. Technological innovation is a primary driver, particularly in the development of advanced powder metallurgy techniques and novel material compositions. Regulatory frameworks, such as environmental standards and safety protocols, also influence production processes and product development. Competitive product substitutes include other metal powders and alternative manufacturing methods, but iron powder's cost-effectiveness and versatility maintain its strong market position. End-user demographics are increasingly influenced by the automotive sector's demand for lightweight and high-performance components, alongside growth in the chemical and general industrial segments. Mergers and acquisitions (M&A) trends are observed as companies seek to expand their product portfolios, geographical reach, and technological capabilities. For instance, a predicted increase in M&A activity of approximately 15% within the forecast period is anticipated, driven by consolidation and strategic growth initiatives. Barriers to innovation include the high capital investment required for advanced processing technologies and the stringent quality control necessary for specialized applications.
- Market Concentration: Moderately concentrated with key players dominating specific segments.
- Technological Innovation: Driven by advancements in powder metallurgy, surface treatments, and alloy development.
- Regulatory Influence: Environmental compliance and occupational safety standards are key considerations.
- Competitive Landscape: Faces competition from alternative materials and manufacturing processes.
- End-User Demand: Primarily driven by automotive, chemical, and general industrial sectors.
- M&A Trends: Expected to see an increase in strategic acquisitions and consolidations.
- Innovation Barriers: High R&D costs and the need for rigorous quality assurance.
Iron Powder Industry Growth Trends & Insights
The global iron powder market is poised for robust growth, projected to reach a substantial $XX billion by 2033, exhibiting a Compound Annual Growth Rate (CAGR) of approximately XX% during the forecast period of 2025–2033. This expansion is fueled by a confluence of factors, including escalating demand from the automotive sector for components in electric vehicles and advanced engine systems, the increasing utilization of iron powders in the chemical industry for catalysts and pigments, and the consistent growth in general industrial applications such as welding electrodes and magnetic materials. The parent market, encompassing the broader metal powders industry, provides a fertile ground for iron powder's penetration, with a projected market size of $XXX billion in 2025. The child markets, specifically segmented by powder type, are also experiencing significant traction. Reduced iron powder, constituting a substantial portion of the market due to its cost-effectiveness, is anticipated to grow at a CAGR of XX%. Atomized iron powder, valued for its superior properties in demanding applications, is expected to witness a CAGR of XX%. Electrolytic iron powder, critical for high-purity applications, will also contribute to overall market expansion, with a projected CAGR of XX%.
Consumer behavior shifts are evident, with a growing preference for lightweight, durable, and sustainable materials, which iron powder, particularly in sintered components, effectively addresses. Technological disruptions, such as advancements in additive manufacturing (3D printing) utilizing iron powders, are opening new avenues for customization and complex part fabrication. Market penetration is deepening across emerging economies, driven by industrialization and infrastructure development. The adoption rates for advanced iron powder applications are accelerating, particularly in sectors embracing Industry 4.0 principles. The market size evolution is a testament to the increasing reliance on iron powder for critical applications, with the historical period (2019-2024) showing steady growth, laying a strong foundation for the accelerated expansion anticipated in the forecast period. For instance, the automotive segment alone is projected to account for XX% of the total iron powder market by 2033, driven by innovations in electric vehicle battery components and lightweight structural parts. The chemical industry's demand for iron powder as a catalyst in various chemical reactions is expected to contribute XX% to the market share, showcasing its pivotal role in industrial processes.
Dominant Regions, Countries, or Segments in Iron Powder Industry
The Automotive end-user segment stands as the dominant force driving growth and shaping the trajectory of the global iron powder industry. This leadership is intrinsically linked to the automotive sector's relentless pursuit of lightweighting, enhanced performance, and improved fuel efficiency across both traditional internal combustion engine vehicles and the rapidly expanding electric vehicle (EV) market. The increasing complexity of automotive components, from engine parts and transmission systems to battery components and structural elements in EVs, necessitates the use of advanced materials like iron powders. For example, sintered parts manufactured from iron powder offer superior strength-to-weight ratios compared to traditional casting methods, directly contributing to improved vehicle performance and reduced emissions. The projected market share of the automotive segment within the iron powder industry is estimated to be XX% by 2033, underscoring its critical importance.
Key Drivers for Automotive Dominance:
- Electric Vehicle (EV) Revolution: The surge in EV production is creating unprecedented demand for specialized iron powders for battery pack components, electric motor parts, and thermal management systems.
- Lightweighting Initiatives: Regulatory pressures and consumer demand for fuel efficiency are compelling automakers to adopt lighter materials, with iron powder playing a crucial role in creating complex, high-strength sintered components.
- Advanced Powertrain Technologies: Modern internal combustion engines and hybrid powertrains require intricate parts that benefit from the precision and material properties offered by iron powder metallurgy.
- Cost-Effectiveness and Performance Balance: Iron powder offers a compelling balance of cost and performance, making it an attractive choice for mass-produced automotive components.
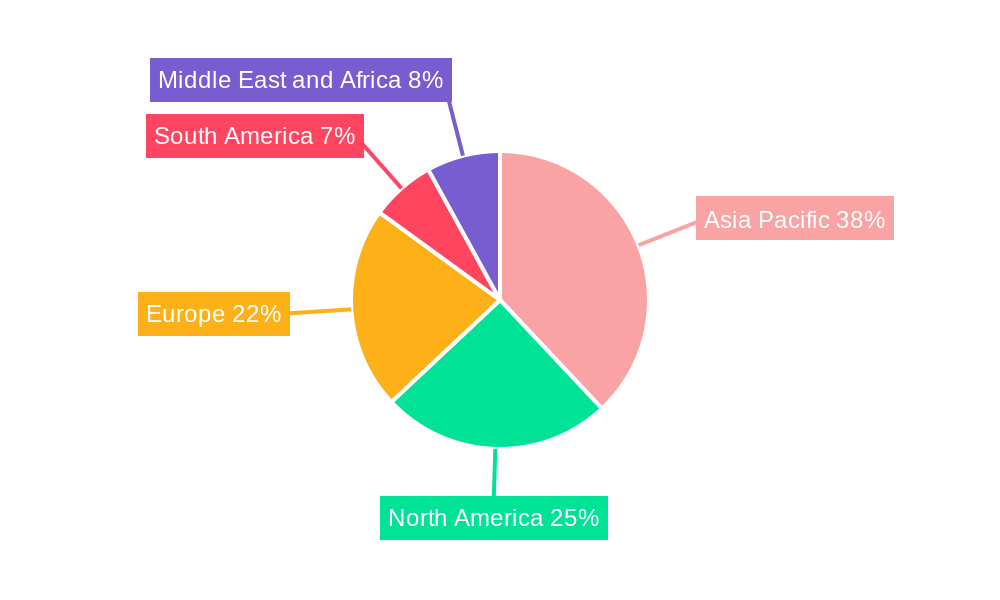
Geographically, Asia-Pacific is the dominant region, propelled by its robust manufacturing base, particularly in China, Japan, and South Korea. This region is not only a major consumer of iron powders but also a significant producer, with a strong presence of key players and a rapidly growing automotive and general industrial sectors. China's industrial policies, massive domestic demand, and the presence of companies like Laiwu Iron & Steel Group Lunan Mining Co Ltd and CNPC POWDER contribute significantly to this regional dominance. The Asia-Pacific market is expected to capture XX% of the global iron powder market by 2033.
Key Drivers for Asia-Pacific Dominance:
- Manufacturing Hub: The region's status as a global manufacturing powerhouse, especially in automotive and electronics.
- Rapid Industrialization: Continuous industrial growth and infrastructure development across emerging economies.
- Government Support and Policies: Favorable government initiatives promoting manufacturing and technological advancements.
- Growing Automotive Production: The concentration of major automotive manufacturers and their supply chains.
Within the Type segment, Reduced Iron Powder is anticipated to maintain its leading position due to its widespread availability and cost-effectiveness, catering to a broad spectrum of general industrial and some automotive applications. However, Atomized Iron Powder is experiencing a significant growth spurt, driven by its superior properties for high-performance applications in both automotive and specialized industrial uses, such as in cutting and welding.
Iron Powder Industry Product Landscape
The iron powder industry is characterized by continuous product innovation aimed at enhancing performance, expanding applications, and addressing specific end-user needs. Innovations focus on developing powders with controlled particle size distribution, improved compressibility, higher purity levels, and enhanced magnetic or mechanical properties. For instance, Höganäs' development of nickel-free powders addresses both cost reduction and environmental concerns, opening up new possibilities for sustainable component production. ATI's advancements in specialized alloy iron powders cater to high-temperature and corrosive environments, crucial for aerospace and advanced industrial machinery. These product developments are directly tied to performance metrics such as tensile strength, fatigue resistance, density, and magnetic permeability, enabling their use in increasingly demanding applications like additive manufacturing, advanced welding consumables, and high-performance magnetic cores.
Key Drivers, Barriers & Challenges in Iron Powder Industry
Key Drivers:
- Growing Automotive Demand: The burgeoning automotive sector, especially electric vehicles, drives significant demand for iron powders in critical components.
- Industrialization in Emerging Economies: Rapid industrial growth in regions like Asia-Pacific fuels demand across various end-user segments.
- Advancements in Powder Metallurgy: Continuous innovation in powder production and sintering techniques expands application possibilities.
- Additive Manufacturing Growth: The increasing adoption of 3D printing with metal powders presents a substantial growth avenue.
Key Barriers & Challenges:
- Supply Chain Volatility: Fluctuations in raw material prices and availability can impact production costs and lead times.
- Environmental Regulations: Increasingly stringent environmental regulations regarding production processes and emissions can necessitate significant investment.
- Competition from Alternatives: Substitution by other metal powders or manufacturing methods poses a competitive threat in certain applications.
- Technological Investment Requirements: The high capital expenditure required for advanced powder production and processing technologies can be a barrier.
- Quality Control for High-Purity Applications: Maintaining consistent, high-purity iron powder for specialized applications like food additives and pharmaceuticals requires rigorous quality assurance.
Emerging Opportunities in Iron Powder Industry
Emerging opportunities in the iron powder industry lie in the expansion of additive manufacturing (3D printing) applications, enabling the creation of highly complex and customized parts for sectors like aerospace, medical devices, and specialized tooling. The growing focus on sustainability and circular economy principles presents opportunities for developing iron powders from recycled materials or through more energy-efficient production methods. Furthermore, the increasing demand for high-purity iron powders in the food and pharmaceutical industries, driven by stringent quality standards and growing consumer awareness, represents a niche but significant growth area. The development of novel iron powder alloys with enhanced properties, such as superior corrosion resistance or magnetic characteristics, will unlock new application frontiers in advanced electronics and specialized industrial equipment.
Growth Accelerators in the Iron Powder Industry Industry
Several key growth accelerators are propelling the iron powder industry forward. Technological breakthroughs in powder production and atomization processes are enhancing quality, reducing costs, and improving material properties, making iron powders more competitive across a wider range of applications. Strategic partnerships and collaborations between raw material suppliers, powder manufacturers, and end-users are fostering innovation and accelerating the development of tailored solutions for specific industry needs. Market expansion into untapped geographical regions, particularly in developing economies with burgeoning industrial sectors, offers significant potential for increased consumption. The continuous investment in research and development (R&D) by major players, focusing on new alloy compositions and advanced processing techniques like hot isostatic pressing (HIP) and selective laser melting (SLM), is a critical driver for long-term growth and market penetration.
Key Players Shaping the Iron Powder Industry Market
- Hoganas AB
- American Elements
- KOBE STEEL LTD
- INDUSTRIAL METAL POWDERS (INDIA) PVT LTD
- Laiwu Iron & Steel Group Lunan Mining Co Ltd
- ATI
- Ashland
- Belmont Metals
- BASF SE
- Rio Tinto Metal Powders
- CNPC POWDER
- JFE Steel Corporation
- Pometon Powder
Notable Milestones in Iron Powder Industry Sector
- January 2023: JFE Steel completed the acquisition of the ISO 45001 certification, an international standard for occupational health and safety management systems, for all of its Japan operations. This signifies a commitment to enhanced safety and operational excellence.
- January 2023: Höganäs developed nickel-free powders for component production. The new nickel-free powder can potentially reduce price and the harmful environmental impact, addressing market demands for sustainability and cost-efficiency.
In-Depth Iron Powder Industry Market Outlook
The outlook for the iron powder industry remains exceptionally positive, driven by a confluence of accelerating growth factors and promising strategic opportunities. The persistent global push towards industrialization, particularly in emerging markets, combined with the unwavering demand from the automotive sector for advanced lightweight components and the burgeoning adoption of additive manufacturing, will continue to fuel market expansion. Innovations in powder metallurgy and the development of specialized iron powder alloys are set to unlock new application frontiers, while a growing emphasis on sustainability will encourage the development of eco-friendly production methods and the utilization of recycled materials. Strategic investments in R&D and potential M&A activities will further consolidate the market and drive technological advancements, positioning the iron powder industry for sustained robust growth throughout the forecast period and beyond.
Iron Powder Industry Segmentation
-
1. Type
- 1.1. Reduced Iron Powder
- 1.2. Atomized Iron Powder
- 1.3. Electrolytic Iron Powder
-
2. End-User
- 2.1. Automotive
- 2.2. Chemical
- 2.3. General Industrial
- 2.4. Food
- 2.5. Other End-users
Iron Powder Industry Segmentation By Geography
-
1. Asia Pacific
- 1.1. China
- 1.2. India
- 1.3. Japan
- 1.4. South Korea
- 1.5. Rest of Asia Pacific
-
2. North America
- 2.1. United States
- 2.2. Canada
- 2.3. Mexico
-
3. Europe
- 3.1. United Kingdom
- 3.2. France
- 3.3. Germany
- 3.4. Italy
- 3.5. Rest of Europe
-
4. South America
- 4.1. Brazil
- 4.2. Argentina
- 4.3. Rest of South America
-
5. Middle East and Africa
- 5.1. Saudi Arabia
- 5.2. South Africa
- 5.3. Rest of Middle East and Africa
Iron Powder Industry Regional Market Share
Geographic Coverage of Iron Powder Industry
Iron Powder Industry REPORT HIGHLIGHTS
| Aspects | Details |
|---|---|
| Study Period | 2020-2034 |
| Base Year | 2025 |
| Estimated Year | 2026 |
| Forecast Period | 2026-2034 |
| Historical Period | 2020-2025 |
| Growth Rate | CAGR of 5.2% from 2020-2034 |
| Segmentation |
|
Table of Contents
- 1. Introduction
- 1.1. Research Scope
- 1.2. Market Segmentation
- 1.3. Research Objective
- 1.4. Definitions and Assumptions
- 2. Executive Summary
- 2.1. Market Snapshot
- 3. Market Dynamics
- 3.1. Market Drivers
- 3.2. Market Restrains
- 3.3. Market Trends
- 3.4. Market Opportunities
- 4. Market Factor Analysis
- 4.1. Porters Five Forces
- 4.1.1. Bargaining Power of Suppliers
- 4.1.2. Bargaining Power of Buyers
- 4.1.3. Threat of New Entrants
- 4.1.4. Threat of Substitutes
- 4.1.5. Competitive Rivalry
- 4.2. PESTEL analysis
- 4.3. BCG Analysis
- 4.3.1. Stars (High Growth, High Market Share)
- 4.3.2. Cash Cows (Low Growth, High Market Share)
- 4.3.3. Question Mark (High Growth, Low Market Share)
- 4.3.4. Dogs (Low Growth, Low Market Share)
- 4.4. Ansoff Matrix Analysis
- 4.5. Supply Chain Analysis
- 4.6. Regulatory Landscape
- 4.7. Current Market Potential and Opportunity Assessment (TAM–SAM–SOM Framework)
- 4.8. IMR Analyst Note
- 4.1. Porters Five Forces
- 5. Market Analysis, Insights and Forecast 2021-2033
- 5.1. Market Analysis, Insights and Forecast - by Type
- 5.1.1. Reduced Iron Powder
- 5.1.2. Atomized Iron Powder
- 5.1.3. Electrolytic Iron Powder
- 5.2. Market Analysis, Insights and Forecast - by End-User
- 5.2.1. Automotive
- 5.2.2. Chemical
- 5.2.3. General Industrial
- 5.2.4. Food
- 5.2.5. Other End-users
- 5.3. Market Analysis, Insights and Forecast - by Region
- 5.3.1. Asia Pacific
- 5.3.2. North America
- 5.3.3. Europe
- 5.3.4. South America
- 5.3.5. Middle East and Africa
- 5.1. Market Analysis, Insights and Forecast - by Type
- 6. Global Iron Powder Industry Analysis, Insights and Forecast, 2021-2033
- 6.1. Market Analysis, Insights and Forecast - by Type
- 6.1.1. Reduced Iron Powder
- 6.1.2. Atomized Iron Powder
- 6.1.3. Electrolytic Iron Powder
- 6.2. Market Analysis, Insights and Forecast - by End-User
- 6.2.1. Automotive
- 6.2.2. Chemical
- 6.2.3. General Industrial
- 6.2.4. Food
- 6.2.5. Other End-users
- 6.1. Market Analysis, Insights and Forecast - by Type
- 7. Asia Pacific Iron Powder Industry Analysis, Insights and Forecast, 2020-2032
- 7.1. Market Analysis, Insights and Forecast - by Type
- 7.1.1. Reduced Iron Powder
- 7.1.2. Atomized Iron Powder
- 7.1.3. Electrolytic Iron Powder
- 7.2. Market Analysis, Insights and Forecast - by End-User
- 7.2.1. Automotive
- 7.2.2. Chemical
- 7.2.3. General Industrial
- 7.2.4. Food
- 7.2.5. Other End-users
- 7.1. Market Analysis, Insights and Forecast - by Type
- 8. North America Iron Powder Industry Analysis, Insights and Forecast, 2020-2032
- 8.1. Market Analysis, Insights and Forecast - by Type
- 8.1.1. Reduced Iron Powder
- 8.1.2. Atomized Iron Powder
- 8.1.3. Electrolytic Iron Powder
- 8.2. Market Analysis, Insights and Forecast - by End-User
- 8.2.1. Automotive
- 8.2.2. Chemical
- 8.2.3. General Industrial
- 8.2.4. Food
- 8.2.5. Other End-users
- 8.1. Market Analysis, Insights and Forecast - by Type
- 9. Europe Iron Powder Industry Analysis, Insights and Forecast, 2020-2032
- 9.1. Market Analysis, Insights and Forecast - by Type
- 9.1.1. Reduced Iron Powder
- 9.1.2. Atomized Iron Powder
- 9.1.3. Electrolytic Iron Powder
- 9.2. Market Analysis, Insights and Forecast - by End-User
- 9.2.1. Automotive
- 9.2.2. Chemical
- 9.2.3. General Industrial
- 9.2.4. Food
- 9.2.5. Other End-users
- 9.1. Market Analysis, Insights and Forecast - by Type
- 10. South America Iron Powder Industry Analysis, Insights and Forecast, 2020-2032
- 10.1. Market Analysis, Insights and Forecast - by Type
- 10.1.1. Reduced Iron Powder
- 10.1.2. Atomized Iron Powder
- 10.1.3. Electrolytic Iron Powder
- 10.2. Market Analysis, Insights and Forecast - by End-User
- 10.2.1. Automotive
- 10.2.2. Chemical
- 10.2.3. General Industrial
- 10.2.4. Food
- 10.2.5. Other End-users
- 10.1. Market Analysis, Insights and Forecast - by Type
- 11. Middle East and Africa Iron Powder Industry Analysis, Insights and Forecast, 2020-2032
- 11.1. Market Analysis, Insights and Forecast - by Type
- 11.1.1. Reduced Iron Powder
- 11.1.2. Atomized Iron Powder
- 11.1.3. Electrolytic Iron Powder
- 11.2. Market Analysis, Insights and Forecast - by End-User
- 11.2.1. Automotive
- 11.2.2. Chemical
- 11.2.3. General Industrial
- 11.2.4. Food
- 11.2.5. Other End-users
- 11.1. Market Analysis, Insights and Forecast - by Type
- 12. Competitive Analysis
- 12.1. Company Profiles
- 12.1.1 Hoganas AB
- 12.1.1.1. Company Overview
- 12.1.1.2. Products
- 12.1.1.3. Company Financials
- 12.1.1.4. SWOT Analysis
- 12.1.2 American Elements
- 12.1.2.1. Company Overview
- 12.1.2.2. Products
- 12.1.2.3. Company Financials
- 12.1.2.4. SWOT Analysis
- 12.1.3 KOBE STEEL LTD
- 12.1.3.1. Company Overview
- 12.1.3.2. Products
- 12.1.3.3. Company Financials
- 12.1.3.4. SWOT Analysis
- 12.1.4 INDUSTRIAL METAL POWDERS (INDIA) PVT LTD
- 12.1.4.1. Company Overview
- 12.1.4.2. Products
- 12.1.4.3. Company Financials
- 12.1.4.4. SWOT Analysis
- 12.1.5 Laiwu Iron & Steel Group Lunan Mining Co Ltd
- 12.1.5.1. Company Overview
- 12.1.5.2. Products
- 12.1.5.3. Company Financials
- 12.1.5.4. SWOT Analysis
- 12.1.6 ATI
- 12.1.6.1. Company Overview
- 12.1.6.2. Products
- 12.1.6.3. Company Financials
- 12.1.6.4. SWOT Analysis
- 12.1.7 Ashland
- 12.1.7.1. Company Overview
- 12.1.7.2. Products
- 12.1.7.3. Company Financials
- 12.1.7.4. SWOT Analysis
- 12.1.8 Belmont Metals
- 12.1.8.1. Company Overview
- 12.1.8.2. Products
- 12.1.8.3. Company Financials
- 12.1.8.4. SWOT Analysis
- 12.1.9 BASF SE
- 12.1.9.1. Company Overview
- 12.1.9.2. Products
- 12.1.9.3. Company Financials
- 12.1.9.4. SWOT Analysis
- 12.1.10 Rio Tinto Metal Powders
- 12.1.10.1. Company Overview
- 12.1.10.2. Products
- 12.1.10.3. Company Financials
- 12.1.10.4. SWOT Analysis
- 12.1.11 CNPC POWDER
- 12.1.11.1. Company Overview
- 12.1.11.2. Products
- 12.1.11.3. Company Financials
- 12.1.11.4. SWOT Analysis
- 12.1.12 JFE Steel Corporation
- 12.1.12.1. Company Overview
- 12.1.12.2. Products
- 12.1.12.3. Company Financials
- 12.1.12.4. SWOT Analysis
- 12.1.13 Pometon Powder
- 12.1.13.1. Company Overview
- 12.1.13.2. Products
- 12.1.13.3. Company Financials
- 12.1.13.4. SWOT Analysis
- 12.1.1 Hoganas AB
- 12.2. Market Entropy
- 12.2.1 Company's Key Areas Served
- 12.2.2 Recent Developments
- 12.3. Company Market Share Analysis 2025
- 12.3.1 Top 5 Companies Market Share Analysis
- 12.3.2 Top 3 Companies Market Share Analysis
- 12.4. List of Potential Customers
- 13. Research Methodology
List of Figures
- Figure 1: Global Iron Powder Industry Revenue Breakdown (Billion, %) by Region 2025 & 2033
- Figure 2: Global Iron Powder Industry Volume Breakdown (K Tons, %) by Region 2025 & 2033
- Figure 3: Asia Pacific Iron Powder Industry Revenue (Billion), by Type 2025 & 2033
- Figure 4: Asia Pacific Iron Powder Industry Volume (K Tons), by Type 2025 & 2033
- Figure 5: Asia Pacific Iron Powder Industry Revenue Share (%), by Type 2025 & 2033
- Figure 6: Asia Pacific Iron Powder Industry Volume Share (%), by Type 2025 & 2033
- Figure 7: Asia Pacific Iron Powder Industry Revenue (Billion), by End-User 2025 & 2033
- Figure 8: Asia Pacific Iron Powder Industry Volume (K Tons), by End-User 2025 & 2033
- Figure 9: Asia Pacific Iron Powder Industry Revenue Share (%), by End-User 2025 & 2033
- Figure 10: Asia Pacific Iron Powder Industry Volume Share (%), by End-User 2025 & 2033
- Figure 11: Asia Pacific Iron Powder Industry Revenue (Billion), by Country 2025 & 2033
- Figure 12: Asia Pacific Iron Powder Industry Volume (K Tons), by Country 2025 & 2033
- Figure 13: Asia Pacific Iron Powder Industry Revenue Share (%), by Country 2025 & 2033
- Figure 14: Asia Pacific Iron Powder Industry Volume Share (%), by Country 2025 & 2033
- Figure 15: North America Iron Powder Industry Revenue (Billion), by Type 2025 & 2033
- Figure 16: North America Iron Powder Industry Volume (K Tons), by Type 2025 & 2033
- Figure 17: North America Iron Powder Industry Revenue Share (%), by Type 2025 & 2033
- Figure 18: North America Iron Powder Industry Volume Share (%), by Type 2025 & 2033
- Figure 19: North America Iron Powder Industry Revenue (Billion), by End-User 2025 & 2033
- Figure 20: North America Iron Powder Industry Volume (K Tons), by End-User 2025 & 2033
- Figure 21: North America Iron Powder Industry Revenue Share (%), by End-User 2025 & 2033
- Figure 22: North America Iron Powder Industry Volume Share (%), by End-User 2025 & 2033
- Figure 23: North America Iron Powder Industry Revenue (Billion), by Country 2025 & 2033
- Figure 24: North America Iron Powder Industry Volume (K Tons), by Country 2025 & 2033
- Figure 25: North America Iron Powder Industry Revenue Share (%), by Country 2025 & 2033
- Figure 26: North America Iron Powder Industry Volume Share (%), by Country 2025 & 2033
- Figure 27: Europe Iron Powder Industry Revenue (Billion), by Type 2025 & 2033
- Figure 28: Europe Iron Powder Industry Volume (K Tons), by Type 2025 & 2033
- Figure 29: Europe Iron Powder Industry Revenue Share (%), by Type 2025 & 2033
- Figure 30: Europe Iron Powder Industry Volume Share (%), by Type 2025 & 2033
- Figure 31: Europe Iron Powder Industry Revenue (Billion), by End-User 2025 & 2033
- Figure 32: Europe Iron Powder Industry Volume (K Tons), by End-User 2025 & 2033
- Figure 33: Europe Iron Powder Industry Revenue Share (%), by End-User 2025 & 2033
- Figure 34: Europe Iron Powder Industry Volume Share (%), by End-User 2025 & 2033
- Figure 35: Europe Iron Powder Industry Revenue (Billion), by Country 2025 & 2033
- Figure 36: Europe Iron Powder Industry Volume (K Tons), by Country 2025 & 2033
- Figure 37: Europe Iron Powder Industry Revenue Share (%), by Country 2025 & 2033
- Figure 38: Europe Iron Powder Industry Volume Share (%), by Country 2025 & 2033
- Figure 39: South America Iron Powder Industry Revenue (Billion), by Type 2025 & 2033
- Figure 40: South America Iron Powder Industry Volume (K Tons), by Type 2025 & 2033
- Figure 41: South America Iron Powder Industry Revenue Share (%), by Type 2025 & 2033
- Figure 42: South America Iron Powder Industry Volume Share (%), by Type 2025 & 2033
- Figure 43: South America Iron Powder Industry Revenue (Billion), by End-User 2025 & 2033
- Figure 44: South America Iron Powder Industry Volume (K Tons), by End-User 2025 & 2033
- Figure 45: South America Iron Powder Industry Revenue Share (%), by End-User 2025 & 2033
- Figure 46: South America Iron Powder Industry Volume Share (%), by End-User 2025 & 2033
- Figure 47: South America Iron Powder Industry Revenue (Billion), by Country 2025 & 2033
- Figure 48: South America Iron Powder Industry Volume (K Tons), by Country 2025 & 2033
- Figure 49: South America Iron Powder Industry Revenue Share (%), by Country 2025 & 2033
- Figure 50: South America Iron Powder Industry Volume Share (%), by Country 2025 & 2033
- Figure 51: Middle East and Africa Iron Powder Industry Revenue (Billion), by Type 2025 & 2033
- Figure 52: Middle East and Africa Iron Powder Industry Volume (K Tons), by Type 2025 & 2033
- Figure 53: Middle East and Africa Iron Powder Industry Revenue Share (%), by Type 2025 & 2033
- Figure 54: Middle East and Africa Iron Powder Industry Volume Share (%), by Type 2025 & 2033
- Figure 55: Middle East and Africa Iron Powder Industry Revenue (Billion), by End-User 2025 & 2033
- Figure 56: Middle East and Africa Iron Powder Industry Volume (K Tons), by End-User 2025 & 2033
- Figure 57: Middle East and Africa Iron Powder Industry Revenue Share (%), by End-User 2025 & 2033
- Figure 58: Middle East and Africa Iron Powder Industry Volume Share (%), by End-User 2025 & 2033
- Figure 59: Middle East and Africa Iron Powder Industry Revenue (Billion), by Country 2025 & 2033
- Figure 60: Middle East and Africa Iron Powder Industry Volume (K Tons), by Country 2025 & 2033
- Figure 61: Middle East and Africa Iron Powder Industry Revenue Share (%), by Country 2025 & 2033
- Figure 62: Middle East and Africa Iron Powder Industry Volume Share (%), by Country 2025 & 2033
List of Tables
- Table 1: Global Iron Powder Industry Revenue Billion Forecast, by Type 2020 & 2033
- Table 2: Global Iron Powder Industry Volume K Tons Forecast, by Type 2020 & 2033
- Table 3: Global Iron Powder Industry Revenue Billion Forecast, by End-User 2020 & 2033
- Table 4: Global Iron Powder Industry Volume K Tons Forecast, by End-User 2020 & 2033
- Table 5: Global Iron Powder Industry Revenue Billion Forecast, by Region 2020 & 2033
- Table 6: Global Iron Powder Industry Volume K Tons Forecast, by Region 2020 & 2033
- Table 7: Global Iron Powder Industry Revenue Billion Forecast, by Type 2020 & 2033
- Table 8: Global Iron Powder Industry Volume K Tons Forecast, by Type 2020 & 2033
- Table 9: Global Iron Powder Industry Revenue Billion Forecast, by End-User 2020 & 2033
- Table 10: Global Iron Powder Industry Volume K Tons Forecast, by End-User 2020 & 2033
- Table 11: Global Iron Powder Industry Revenue Billion Forecast, by Country 2020 & 2033
- Table 12: Global Iron Powder Industry Volume K Tons Forecast, by Country 2020 & 2033
- Table 13: China Iron Powder Industry Revenue (Billion) Forecast, by Application 2020 & 2033
- Table 14: China Iron Powder Industry Volume (K Tons) Forecast, by Application 2020 & 2033
- Table 15: India Iron Powder Industry Revenue (Billion) Forecast, by Application 2020 & 2033
- Table 16: India Iron Powder Industry Volume (K Tons) Forecast, by Application 2020 & 2033
- Table 17: Japan Iron Powder Industry Revenue (Billion) Forecast, by Application 2020 & 2033
- Table 18: Japan Iron Powder Industry Volume (K Tons) Forecast, by Application 2020 & 2033
- Table 19: South Korea Iron Powder Industry Revenue (Billion) Forecast, by Application 2020 & 2033
- Table 20: South Korea Iron Powder Industry Volume (K Tons) Forecast, by Application 2020 & 2033
- Table 21: Rest of Asia Pacific Iron Powder Industry Revenue (Billion) Forecast, by Application 2020 & 2033
- Table 22: Rest of Asia Pacific Iron Powder Industry Volume (K Tons) Forecast, by Application 2020 & 2033
- Table 23: Global Iron Powder Industry Revenue Billion Forecast, by Type 2020 & 2033
- Table 24: Global Iron Powder Industry Volume K Tons Forecast, by Type 2020 & 2033
- Table 25: Global Iron Powder Industry Revenue Billion Forecast, by End-User 2020 & 2033
- Table 26: Global Iron Powder Industry Volume K Tons Forecast, by End-User 2020 & 2033
- Table 27: Global Iron Powder Industry Revenue Billion Forecast, by Country 2020 & 2033
- Table 28: Global Iron Powder Industry Volume K Tons Forecast, by Country 2020 & 2033
- Table 29: United States Iron Powder Industry Revenue (Billion) Forecast, by Application 2020 & 2033
- Table 30: United States Iron Powder Industry Volume (K Tons) Forecast, by Application 2020 & 2033
- Table 31: Canada Iron Powder Industry Revenue (Billion) Forecast, by Application 2020 & 2033
- Table 32: Canada Iron Powder Industry Volume (K Tons) Forecast, by Application 2020 & 2033
- Table 33: Mexico Iron Powder Industry Revenue (Billion) Forecast, by Application 2020 & 2033
- Table 34: Mexico Iron Powder Industry Volume (K Tons) Forecast, by Application 2020 & 2033
- Table 35: Global Iron Powder Industry Revenue Billion Forecast, by Type 2020 & 2033
- Table 36: Global Iron Powder Industry Volume K Tons Forecast, by Type 2020 & 2033
- Table 37: Global Iron Powder Industry Revenue Billion Forecast, by End-User 2020 & 2033
- Table 38: Global Iron Powder Industry Volume K Tons Forecast, by End-User 2020 & 2033
- Table 39: Global Iron Powder Industry Revenue Billion Forecast, by Country 2020 & 2033
- Table 40: Global Iron Powder Industry Volume K Tons Forecast, by Country 2020 & 2033
- Table 41: United Kingdom Iron Powder Industry Revenue (Billion) Forecast, by Application 2020 & 2033
- Table 42: United Kingdom Iron Powder Industry Volume (K Tons) Forecast, by Application 2020 & 2033
- Table 43: France Iron Powder Industry Revenue (Billion) Forecast, by Application 2020 & 2033
- Table 44: France Iron Powder Industry Volume (K Tons) Forecast, by Application 2020 & 2033
- Table 45: Germany Iron Powder Industry Revenue (Billion) Forecast, by Application 2020 & 2033
- Table 46: Germany Iron Powder Industry Volume (K Tons) Forecast, by Application 2020 & 2033
- Table 47: Italy Iron Powder Industry Revenue (Billion) Forecast, by Application 2020 & 2033
- Table 48: Italy Iron Powder Industry Volume (K Tons) Forecast, by Application 2020 & 2033
- Table 49: Rest of Europe Iron Powder Industry Revenue (Billion) Forecast, by Application 2020 & 2033
- Table 50: Rest of Europe Iron Powder Industry Volume (K Tons) Forecast, by Application 2020 & 2033
- Table 51: Global Iron Powder Industry Revenue Billion Forecast, by Type 2020 & 2033
- Table 52: Global Iron Powder Industry Volume K Tons Forecast, by Type 2020 & 2033
- Table 53: Global Iron Powder Industry Revenue Billion Forecast, by End-User 2020 & 2033
- Table 54: Global Iron Powder Industry Volume K Tons Forecast, by End-User 2020 & 2033
- Table 55: Global Iron Powder Industry Revenue Billion Forecast, by Country 2020 & 2033
- Table 56: Global Iron Powder Industry Volume K Tons Forecast, by Country 2020 & 2033
- Table 57: Brazil Iron Powder Industry Revenue (Billion) Forecast, by Application 2020 & 2033
- Table 58: Brazil Iron Powder Industry Volume (K Tons) Forecast, by Application 2020 & 2033
- Table 59: Argentina Iron Powder Industry Revenue (Billion) Forecast, by Application 2020 & 2033
- Table 60: Argentina Iron Powder Industry Volume (K Tons) Forecast, by Application 2020 & 2033
- Table 61: Rest of South America Iron Powder Industry Revenue (Billion) Forecast, by Application 2020 & 2033
- Table 62: Rest of South America Iron Powder Industry Volume (K Tons) Forecast, by Application 2020 & 2033
- Table 63: Global Iron Powder Industry Revenue Billion Forecast, by Type 2020 & 2033
- Table 64: Global Iron Powder Industry Volume K Tons Forecast, by Type 2020 & 2033
- Table 65: Global Iron Powder Industry Revenue Billion Forecast, by End-User 2020 & 2033
- Table 66: Global Iron Powder Industry Volume K Tons Forecast, by End-User 2020 & 2033
- Table 67: Global Iron Powder Industry Revenue Billion Forecast, by Country 2020 & 2033
- Table 68: Global Iron Powder Industry Volume K Tons Forecast, by Country 2020 & 2033
- Table 69: Saudi Arabia Iron Powder Industry Revenue (Billion) Forecast, by Application 2020 & 2033
- Table 70: Saudi Arabia Iron Powder Industry Volume (K Tons) Forecast, by Application 2020 & 2033
- Table 71: South Africa Iron Powder Industry Revenue (Billion) Forecast, by Application 2020 & 2033
- Table 72: South Africa Iron Powder Industry Volume (K Tons) Forecast, by Application 2020 & 2033
- Table 73: Rest of Middle East and Africa Iron Powder Industry Revenue (Billion) Forecast, by Application 2020 & 2033
- Table 74: Rest of Middle East and Africa Iron Powder Industry Volume (K Tons) Forecast, by Application 2020 & 2033
Frequently Asked Questions
1. What is the projected Compound Annual Growth Rate (CAGR) of the Iron Powder Industry?
The projected CAGR is approximately 5.2%.
2. Which companies are prominent players in the Iron Powder Industry?
Key companies in the market include Hoganas AB, American Elements, KOBE STEEL LTD, INDUSTRIAL METAL POWDERS (INDIA) PVT LTD, Laiwu Iron & Steel Group Lunan Mining Co Ltd, ATI, Ashland, Belmont Metals, BASF SE, Rio Tinto Metal Powders, CNPC POWDER, JFE Steel Corporation, Pometon Powder.
3. What are the main segments of the Iron Powder Industry?
The market segments include Type, End-User.
4. Can you provide details about the market size?
The market size is estimated to be USD 6.43 Billion as of 2022.
5. What are some drivers contributing to market growth?
Increasing Demand for Iron Powders from the Automotive Industry; Other Drivers.
6. What are the notable trends driving market growth?
High Demand from Automotive Segment.
7. Are there any restraints impacting market growth?
High Cost of Production; Other Restraints.
8. Can you provide examples of recent developments in the market?
January 2023: JFE Steel completed the acquisition of the ISO 45001 certification, an international standard for occupational health and safety management systems, for all of its Japan operations.
9. What pricing options are available for accessing the report?
Pricing options include single-user, multi-user, and enterprise licenses priced at USD 4750, USD 5250, and USD 8750 respectively.
10. Is the market size provided in terms of value or volume?
The market size is provided in terms of value, measured in Billion and volume, measured in K Tons.
11. Are there any specific market keywords associated with the report?
Yes, the market keyword associated with the report is "Iron Powder Industry," which aids in identifying and referencing the specific market segment covered.
12. How do I determine which pricing option suits my needs best?
The pricing options vary based on user requirements and access needs. Individual users may opt for single-user licenses, while businesses requiring broader access may choose multi-user or enterprise licenses for cost-effective access to the report.
13. Are there any additional resources or data provided in the Iron Powder Industry report?
While the report offers comprehensive insights, it's advisable to review the specific contents or supplementary materials provided to ascertain if additional resources or data are available.
14. How can I stay updated on further developments or reports in the Iron Powder Industry?
To stay informed about further developments, trends, and reports in the Iron Powder Industry, consider subscribing to industry newsletters, following relevant companies and organizations, or regularly checking reputable industry news sources and publications.
Methodology
Step 1 - Identification of Relevant Samples Size from Population Database


Step 2 - Approaches for Defining Global Market Size (Value, Volume* & Price*)

Note*: In applicable scenarios
Step 3 - Data Sources
Primary Research
- Web Analytics
- Survey Reports
- Research Institute
- Latest Research Reports
- Opinion Leaders
Secondary Research
- Annual Reports
- White Paper
- Latest Press Release
- Industry Association
- Paid Database
- Investor Presentations

Step 4 - Data Triangulation
Involves using different sources of information in order to increase the validity of a study
These sources are likely to be stakeholders in a program - participants, other researchers, program staff, other community members, and so on.
Then we put all data in single framework & apply various statistical tools to find out the dynamic on the market.
During the analysis stage, feedback from the stakeholder groups would be compared to determine areas of agreement as well as areas of divergence