

Key Insights
The African sodium cyanide market is projected for significant expansion, with an estimated market size of 36.58 million in 2024, and a projected Compound Annual Growth Rate (CAGR) of 4.5% from 2024 to 2033. This growth is predominantly fueled by the robust expansion of the mining sector, especially gold extraction, across key African nations including South Africa and Tanzania. Enhanced gold exploration and production activities directly drive demand for sodium cyanide, a vital chemical in this process. The chemical processing industry also contributes to market demand, though to a lesser extent. However, stringent environmental regulations governing cyanide management and disposal pose a significant challenge, prompting investments in advanced technologies and sustainable mining practices. The market is segmented by end-use industries, with mining, particularly gold mining, dominating the landscape, followed by chemical processing and other applications. Key market participants such as Honeywell International Inc., Evonik Industries AG, and Orica Limited are actively engaged in this sector, focusing on product quality and strategic partnerships for continental market penetration.
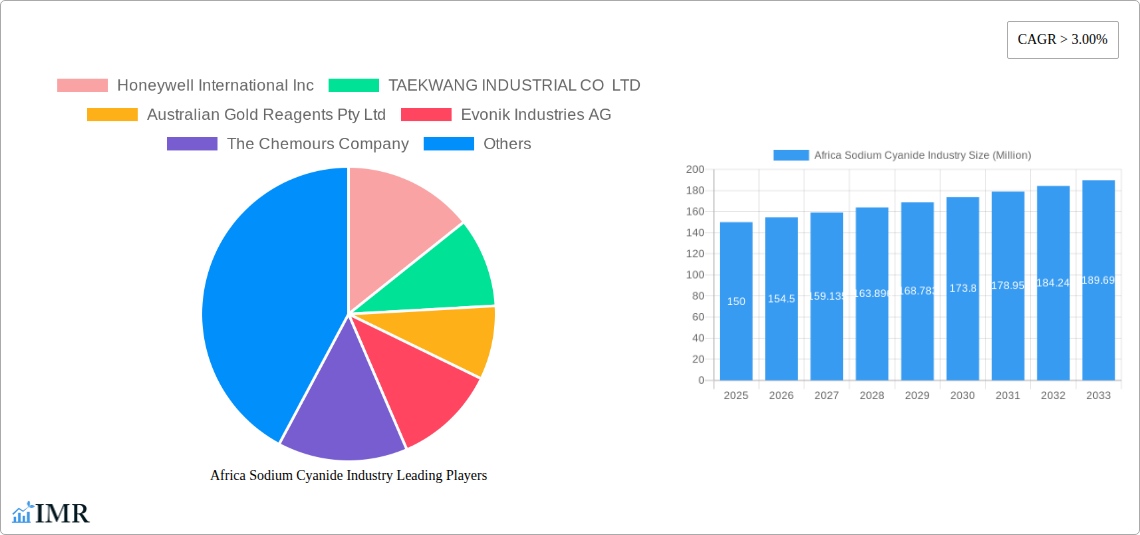
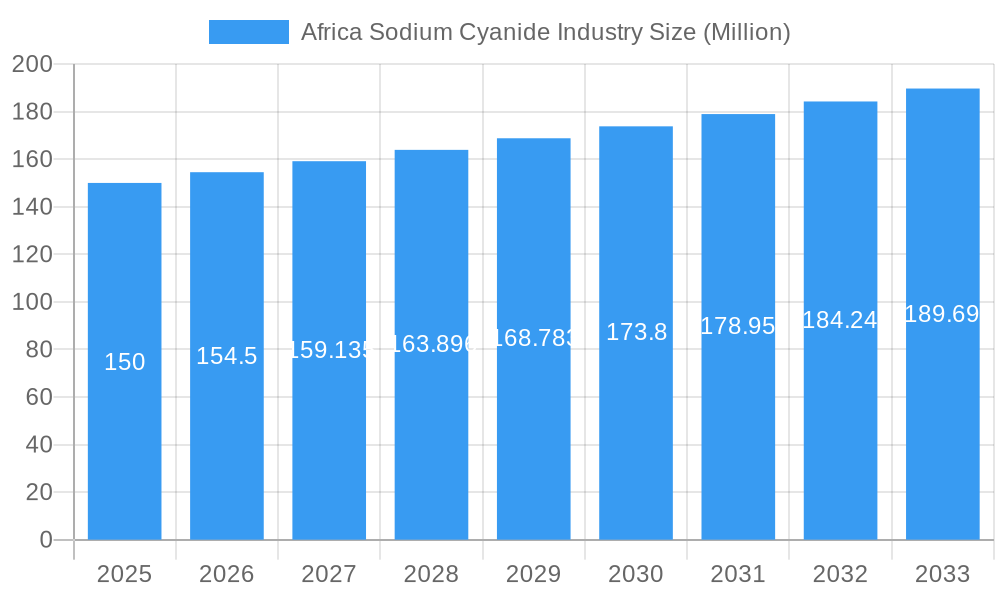
Africa Sodium Cyanide Industry Market Size (In Million)
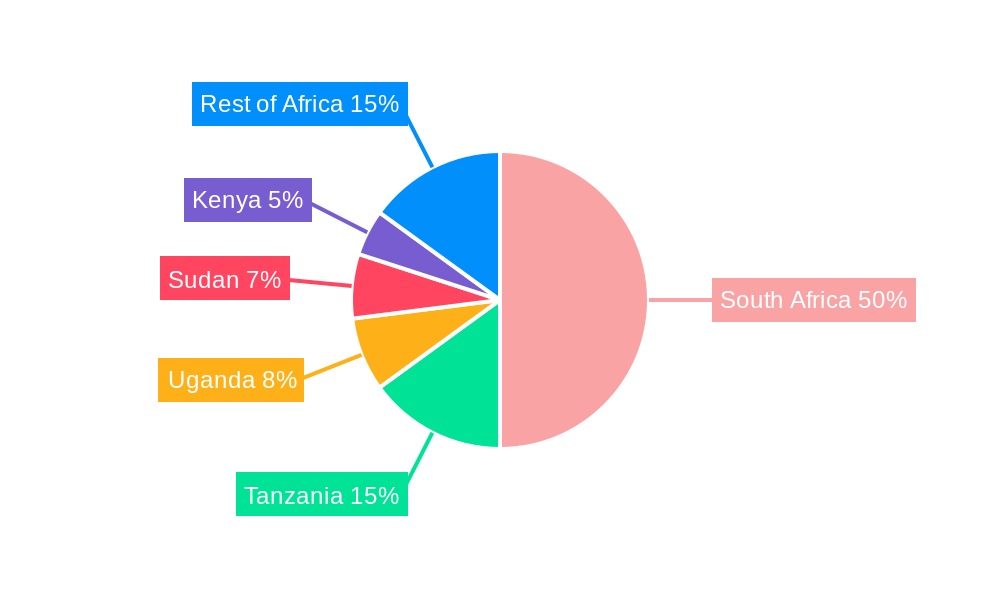
The forecast period anticipates sustained growth in sodium cyanide consumption, supported by ongoing mining operations and infrastructure development across Africa. South Africa leads as the primary consumer due to its established mining industry, while Tanzania, Uganda, and Sudan exhibit substantial growth potential driven by new gold exploration and mining projects. While raw material price volatility and supply chain disruptions present potential market risks, the positive outlook for gold mining and the increasing adoption of responsible cyanide management practices are expected to mitigate these challenges. The market features a dynamic competitive environment with both multinational corporations and regional players.
Africa Sodium Cyanide Industry Company Market Share
Africa Sodium Cyanide Industry: A Comprehensive Market Report (2019-2033)
This comprehensive report provides a detailed analysis of the Africa sodium cyanide industry, offering invaluable insights for industry professionals, investors, and strategic decision-makers. The report covers the period from 2019 to 2033, with a focus on the forecast period of 2025-2033, and utilizes 2025 as the base year. The analysis encompasses market dynamics, growth trends, key players, and emerging opportunities within the parent market of chemical manufacturing and the child market of mining chemicals. Market values are presented in millions.
Africa Sodium Cyanide Industry Market Dynamics & Structure
This section analyzes the competitive landscape of the African sodium cyanide market, considering market concentration, technological advancements, regulatory influences, substitute products, end-user demographics, and merger & acquisition (M&A) activity. The report assesses the influence of these factors on market growth and profitability.
- Market Concentration: The market is moderately concentrated, with key players holding significant market share (estimated xx%). However, the presence of several regional players indicates a competitive landscape.
- Technological Innovation: Technological advancements focus on improving cyanide production efficiency, reducing environmental impact, and enhancing safety. However, innovation is hindered by high capital investment requirements and regulatory complexities.
- Regulatory Framework: Varying regulatory landscapes across African nations impact production and distribution of sodium cyanide. Stringent environmental regulations are driving the adoption of safer handling practices.
- Competitive Product Substitutes: While limited, alternative extraction methods for gold are emerging, posing a potential threat to sodium cyanide demand.
- End-User Demographics: The mining sector, particularly gold mining, dominates the demand for sodium cyanide in Africa. Growth in this sector directly influences market demand.
- M&A Trends: The past five years have witnessed xx M&A deals in the African sodium cyanide industry, primarily driven by expansion strategies and resource consolidation.
Africa Sodium Cyanide Industry Growth Trends & Insights
This section provides a comprehensive analysis of the growth trajectory of the African sodium cyanide market, leveraging both quantitative and qualitative data. The analysis covers market size evolution, adoption rates across various segments, technological disruption, and shifts in consumer behavior.
The market witnessed a CAGR of xx% during the historical period (2019-2024), driven primarily by increased gold mining activity. The forecast period (2025-2033) projects a CAGR of xx%, influenced by factors such as expanding mining operations, infrastructure development, and growing government support for mineral exploration. Technological advancements aimed at improving efficiency and safety are also expected to drive market expansion. However, fluctuating gold prices and environmental concerns could impact market growth. Market penetration in certain regions remains limited due to logistical challenges and infrastructure limitations.
Dominant Regions, Countries, or Segments in Africa Sodium Cyanide Industry
This section pinpoints the leading regions, countries, and end-user segments driving market growth within the African sodium cyanide industry.
- Dominant Region: South Africa, followed by Ghana and Tanzania, are the leading consumers of sodium cyanide due to significant gold mining activities.
- Dominant End-user Segment: The mining sector accounts for the largest share (estimated xx%) of sodium cyanide consumption, with gold mining being the primary driver. The chemical industry represents a smaller but growing segment.
- Key Drivers:
- Growth in gold mining activities: Increased investment in gold exploration and production.
- Government policies: Supportive policies promoting mineral resource development in several African countries.
- Infrastructure development: Improvements in transportation and logistics networks facilitate easier access to sodium cyanide.
- Rising disposable incomes: Increased consumer demand for gold jewelry in certain regions.
Africa Sodium Cyanide Industry Product Landscape
The African sodium cyanide market primarily comprises solid and liquid forms, with variations in purity and packaging. Recent advancements focus on improving handling safety and environmental compatibility. These innovations aim to reduce the risk of accidental exposure and limit environmental impact during production and use. Unique selling propositions often center around superior purity, efficient packaging, and specialized formulations for specific mining applications.
Key Drivers, Barriers & Challenges in Africa Sodium Cyanide Industry
Key Drivers:
- Increased gold mining activities.
- Favorable government policies supporting mineral extraction.
- Technological advancements for enhanced production efficiency and safety.
Challenges and Restraints:
- Fluctuations in gold prices impact the demand for sodium cyanide.
- Stringent environmental regulations increase production costs.
- Supply chain disruptions can cause temporary shortages, as seen in Tanzania in January 2023.
- Competition from alternative gold extraction methods.
Emerging Opportunities in Africa Sodium Cyanide Industry
Emerging opportunities include untapped markets in less explored mining regions, development of more environmentally friendly production methods, and partnerships with mining companies to ensure a secure and sustainable supply chain. The growing demand for gold in emerging economies presents a significant growth opportunity.
Growth Accelerators in the Africa Sodium Cyanide Industry Industry
Long-term growth is projected to be fueled by technological innovations that improve safety and efficiency, strategic partnerships between producers and mining companies, and expansion into new mining regions. Furthermore, government investments in infrastructure will significantly ease logistical bottlenecks.
Key Players Shaping the Africa Sodium Cyanide Industry Market
- Honeywell International Inc
- TAEKWANG INDUSTRIAL CO LTD
- Australian Gold Reagents Pty Ltd
- Evonik Industries AG
- The Chemours Company
- Sasol
- HeBei ChengXin
- TSPC
- Orica Limited
Notable Milestones in Africa Sodium Cyanide Industry Sector
- April 2022: Australian Gold Reagents (AGR) announced a 30,000-ton increase in annual sodium cyanide production capacity.
- January 2023: Sodium cyanide shortages in Tanzania hampered mining operations.
In-Depth Africa Sodium Cyanide Industry Market Outlook
The future of the African sodium cyanide market looks promising, driven by sustained growth in gold mining, improved infrastructure, and technological advancements. Strategic partnerships and investments in sustainable practices will be crucial for long-term success. The market presents significant opportunities for both established players and new entrants, particularly those focusing on innovation and sustainability.
Africa Sodium Cyanide Industry Segmentation
-
1. End-user Industry
- 1.1. Mining
- 1.2. Chemical
- 1.3. Other End-user Industries
Africa Sodium Cyanide Industry Segmentation By Geography
- 1. Ghana
- 2. Burkina Faso
- 3. Egypt
- 4. Tanzania
- 5. Zimbabwe
- 6. Mali
- 7. Democratic Republic of Congo
- 8. Sudan
- 9. Guinea
- 10. South Africa
- 11. Rest of Africa
Africa Sodium Cyanide Industry Regional Market Share
Geographic Coverage of Africa Sodium Cyanide Industry
Africa Sodium Cyanide Industry REPORT HIGHLIGHTS
| Aspects | Details |
|---|---|
| Study Period | 2020-2034 |
| Base Year | 2025 |
| Estimated Year | 2026 |
| Forecast Period | 2026-2034 |
| Historical Period | 2020-2025 |
| Growth Rate | CAGR of 4.5% from 2020-2034 |
| Segmentation |
|
Table of Contents
- 1. Introduction
- 1.1. Research Scope
- 1.2. Market Segmentation
- 1.3. Research Methodology
- 1.4. Definitions and Assumptions
- 2. Executive Summary
- 2.1. Introduction
- 3. Market Dynamics
- 3.1. Introduction
- 3.2. Market Drivers
- 3.2.1. Increasing Demand from the Gold Mining Activities; Increasing Demand for Use in Chemical and Polymer Synthesis
- 3.3. Market Restrains
- 3.3.1. Toxicity of Sodium Cyanide
- 3.4. Market Trends
- 3.4.1. Increasing Demand from Mining Industry
- 4. Market Factor Analysis
- 4.1. Porters Five Forces
- 4.2. Supply/Value Chain
- 4.3. PESTEL analysis
- 4.4. Market Entropy
- 4.5. Patent/Trademark Analysis
- 5. Africa Sodium Cyanide Industry Analysis, Insights and Forecast, 2020-2032
- 5.1. Market Analysis, Insights and Forecast - by End-user Industry
- 5.1.1. Mining
- 5.1.2. Chemical
- 5.1.3. Other End-user Industries
- 5.2. Market Analysis, Insights and Forecast - by Region
- 5.2.1. Ghana
- 5.2.2. Burkina Faso
- 5.2.3. Egypt
- 5.2.4. Tanzania
- 5.2.5. Zimbabwe
- 5.2.6. Mali
- 5.2.7. Democratic Republic of Congo
- 5.2.8. Sudan
- 5.2.9. Guinea
- 5.2.10. South Africa
- 5.2.11. Rest of Africa
- 5.1. Market Analysis, Insights and Forecast - by End-user Industry
- 6. Ghana Africa Sodium Cyanide Industry Analysis, Insights and Forecast, 2020-2032
- 6.1. Market Analysis, Insights and Forecast - by End-user Industry
- 6.1.1. Mining
- 6.1.2. Chemical
- 6.1.3. Other End-user Industries
- 6.1. Market Analysis, Insights and Forecast - by End-user Industry
- 7. Burkina Faso Africa Sodium Cyanide Industry Analysis, Insights and Forecast, 2020-2032
- 7.1. Market Analysis, Insights and Forecast - by End-user Industry
- 7.1.1. Mining
- 7.1.2. Chemical
- 7.1.3. Other End-user Industries
- 7.1. Market Analysis, Insights and Forecast - by End-user Industry
- 8. Egypt Africa Sodium Cyanide Industry Analysis, Insights and Forecast, 2020-2032
- 8.1. Market Analysis, Insights and Forecast - by End-user Industry
- 8.1.1. Mining
- 8.1.2. Chemical
- 8.1.3. Other End-user Industries
- 8.1. Market Analysis, Insights and Forecast - by End-user Industry
- 9. Tanzania Africa Sodium Cyanide Industry Analysis, Insights and Forecast, 2020-2032
- 9.1. Market Analysis, Insights and Forecast - by End-user Industry
- 9.1.1. Mining
- 9.1.2. Chemical
- 9.1.3. Other End-user Industries
- 9.1. Market Analysis, Insights and Forecast - by End-user Industry
- 10. Zimbabwe Africa Sodium Cyanide Industry Analysis, Insights and Forecast, 2020-2032
- 10.1. Market Analysis, Insights and Forecast - by End-user Industry
- 10.1.1. Mining
- 10.1.2. Chemical
- 10.1.3. Other End-user Industries
- 10.1. Market Analysis, Insights and Forecast - by End-user Industry
- 11. Mali Africa Sodium Cyanide Industry Analysis, Insights and Forecast, 2020-2032
- 11.1. Market Analysis, Insights and Forecast - by End-user Industry
- 11.1.1. Mining
- 11.1.2. Chemical
- 11.1.3. Other End-user Industries
- 11.1. Market Analysis, Insights and Forecast - by End-user Industry
- 12. Democratic Republic of Congo Africa Sodium Cyanide Industry Analysis, Insights and Forecast, 2020-2032
- 12.1. Market Analysis, Insights and Forecast - by End-user Industry
- 12.1.1. Mining
- 12.1.2. Chemical
- 12.1.3. Other End-user Industries
- 12.1. Market Analysis, Insights and Forecast - by End-user Industry
- 13. Sudan Africa Sodium Cyanide Industry Analysis, Insights and Forecast, 2020-2032
- 13.1. Market Analysis, Insights and Forecast - by End-user Industry
- 13.1.1. Mining
- 13.1.2. Chemical
- 13.1.3. Other End-user Industries
- 13.1. Market Analysis, Insights and Forecast - by End-user Industry
- 14. Guinea Africa Sodium Cyanide Industry Analysis, Insights and Forecast, 2020-2032
- 14.1. Market Analysis, Insights and Forecast - by End-user Industry
- 14.1.1. Mining
- 14.1.2. Chemical
- 14.1.3. Other End-user Industries
- 14.1. Market Analysis, Insights and Forecast - by End-user Industry
- 15. South Africa Africa Sodium Cyanide Industry Analysis, Insights and Forecast, 2020-2032
- 15.1. Market Analysis, Insights and Forecast - by End-user Industry
- 15.1.1. Mining
- 15.1.2. Chemical
- 15.1.3. Other End-user Industries
- 15.1. Market Analysis, Insights and Forecast - by End-user Industry
- 16. Rest of Africa Africa Sodium Cyanide Industry Analysis, Insights and Forecast, 2020-2032
- 16.1. Market Analysis, Insights and Forecast - by End-user Industry
- 16.1.1. Mining
- 16.1.2. Chemical
- 16.1.3. Other End-user Industries
- 16.1. Market Analysis, Insights and Forecast - by End-user Industry
- 17. Competitive Analysis
- 17.1. Market Share Analysis 2025
- 17.2. Company Profiles
- 17.2.1 Honeywell International Inc
- 17.2.1.1. Overview
- 17.2.1.2. Products
- 17.2.1.3. SWOT Analysis
- 17.2.1.4. Recent Developments
- 17.2.1.5. Financials (Based on Availability)
- 17.2.2 TAEKWANG INDUSTRIAL CO LTD
- 17.2.2.1. Overview
- 17.2.2.2. Products
- 17.2.2.3. SWOT Analysis
- 17.2.2.4. Recent Developments
- 17.2.2.5. Financials (Based on Availability)
- 17.2.3 Australian Gold Reagents Pty Ltd
- 17.2.3.1. Overview
- 17.2.3.2. Products
- 17.2.3.3. SWOT Analysis
- 17.2.3.4. Recent Developments
- 17.2.3.5. Financials (Based on Availability)
- 17.2.4 Evonik Industries AG
- 17.2.4.1. Overview
- 17.2.4.2. Products
- 17.2.4.3. SWOT Analysis
- 17.2.4.4. Recent Developments
- 17.2.4.5. Financials (Based on Availability)
- 17.2.5 The Chemours Company
- 17.2.5.1. Overview
- 17.2.5.2. Products
- 17.2.5.3. SWOT Analysis
- 17.2.5.4. Recent Developments
- 17.2.5.5. Financials (Based on Availability)
- 17.2.6 Sasol
- 17.2.6.1. Overview
- 17.2.6.2. Products
- 17.2.6.3. SWOT Analysis
- 17.2.6.4. Recent Developments
- 17.2.6.5. Financials (Based on Availability)
- 17.2.7 HeBei ChengXin
- 17.2.7.1. Overview
- 17.2.7.2. Products
- 17.2.7.3. SWOT Analysis
- 17.2.7.4. Recent Developments
- 17.2.7.5. Financials (Based on Availability)
- 17.2.8 TSPC
- 17.2.8.1. Overview
- 17.2.8.2. Products
- 17.2.8.3. SWOT Analysis
- 17.2.8.4. Recent Developments
- 17.2.8.5. Financials (Based on Availability)
- 17.2.9 Orica Limited
- 17.2.9.1. Overview
- 17.2.9.2. Products
- 17.2.9.3. SWOT Analysis
- 17.2.9.4. Recent Developments
- 17.2.9.5. Financials (Based on Availability)
- 17.2.1 Honeywell International Inc
List of Figures
- Figure 1: Africa Sodium Cyanide Industry Revenue Breakdown (million, %) by Product 2025 & 2033
- Figure 2: Africa Sodium Cyanide Industry Share (%) by Company 2025
List of Tables
- Table 1: Africa Sodium Cyanide Industry Revenue million Forecast, by End-user Industry 2020 & 2033
- Table 2: Africa Sodium Cyanide Industry Volume K Tons Forecast, by End-user Industry 2020 & 2033
- Table 3: Africa Sodium Cyanide Industry Revenue million Forecast, by Region 2020 & 2033
- Table 4: Africa Sodium Cyanide Industry Volume K Tons Forecast, by Region 2020 & 2033
- Table 5: Africa Sodium Cyanide Industry Revenue million Forecast, by End-user Industry 2020 & 2033
- Table 6: Africa Sodium Cyanide Industry Volume K Tons Forecast, by End-user Industry 2020 & 2033
- Table 7: Africa Sodium Cyanide Industry Revenue million Forecast, by Country 2020 & 2033
- Table 8: Africa Sodium Cyanide Industry Volume K Tons Forecast, by Country 2020 & 2033
- Table 9: Africa Sodium Cyanide Industry Revenue million Forecast, by End-user Industry 2020 & 2033
- Table 10: Africa Sodium Cyanide Industry Volume K Tons Forecast, by End-user Industry 2020 & 2033
- Table 11: Africa Sodium Cyanide Industry Revenue million Forecast, by Country 2020 & 2033
- Table 12: Africa Sodium Cyanide Industry Volume K Tons Forecast, by Country 2020 & 2033
- Table 13: Africa Sodium Cyanide Industry Revenue million Forecast, by End-user Industry 2020 & 2033
- Table 14: Africa Sodium Cyanide Industry Volume K Tons Forecast, by End-user Industry 2020 & 2033
- Table 15: Africa Sodium Cyanide Industry Revenue million Forecast, by Country 2020 & 2033
- Table 16: Africa Sodium Cyanide Industry Volume K Tons Forecast, by Country 2020 & 2033
- Table 17: Africa Sodium Cyanide Industry Revenue million Forecast, by End-user Industry 2020 & 2033
- Table 18: Africa Sodium Cyanide Industry Volume K Tons Forecast, by End-user Industry 2020 & 2033
- Table 19: Africa Sodium Cyanide Industry Revenue million Forecast, by Country 2020 & 2033
- Table 20: Africa Sodium Cyanide Industry Volume K Tons Forecast, by Country 2020 & 2033
- Table 21: Africa Sodium Cyanide Industry Revenue million Forecast, by End-user Industry 2020 & 2033
- Table 22: Africa Sodium Cyanide Industry Volume K Tons Forecast, by End-user Industry 2020 & 2033
- Table 23: Africa Sodium Cyanide Industry Revenue million Forecast, by Country 2020 & 2033
- Table 24: Africa Sodium Cyanide Industry Volume K Tons Forecast, by Country 2020 & 2033
- Table 25: Africa Sodium Cyanide Industry Revenue million Forecast, by End-user Industry 2020 & 2033
- Table 26: Africa Sodium Cyanide Industry Volume K Tons Forecast, by End-user Industry 2020 & 2033
- Table 27: Africa Sodium Cyanide Industry Revenue million Forecast, by Country 2020 & 2033
- Table 28: Africa Sodium Cyanide Industry Volume K Tons Forecast, by Country 2020 & 2033
- Table 29: Africa Sodium Cyanide Industry Revenue million Forecast, by End-user Industry 2020 & 2033
- Table 30: Africa Sodium Cyanide Industry Volume K Tons Forecast, by End-user Industry 2020 & 2033
- Table 31: Africa Sodium Cyanide Industry Revenue million Forecast, by Country 2020 & 2033
- Table 32: Africa Sodium Cyanide Industry Volume K Tons Forecast, by Country 2020 & 2033
- Table 33: Africa Sodium Cyanide Industry Revenue million Forecast, by End-user Industry 2020 & 2033
- Table 34: Africa Sodium Cyanide Industry Volume K Tons Forecast, by End-user Industry 2020 & 2033
- Table 35: Africa Sodium Cyanide Industry Revenue million Forecast, by Country 2020 & 2033
- Table 36: Africa Sodium Cyanide Industry Volume K Tons Forecast, by Country 2020 & 2033
- Table 37: Africa Sodium Cyanide Industry Revenue million Forecast, by End-user Industry 2020 & 2033
- Table 38: Africa Sodium Cyanide Industry Volume K Tons Forecast, by End-user Industry 2020 & 2033
- Table 39: Africa Sodium Cyanide Industry Revenue million Forecast, by Country 2020 & 2033
- Table 40: Africa Sodium Cyanide Industry Volume K Tons Forecast, by Country 2020 & 2033
- Table 41: Africa Sodium Cyanide Industry Revenue million Forecast, by End-user Industry 2020 & 2033
- Table 42: Africa Sodium Cyanide Industry Volume K Tons Forecast, by End-user Industry 2020 & 2033
- Table 43: Africa Sodium Cyanide Industry Revenue million Forecast, by Country 2020 & 2033
- Table 44: Africa Sodium Cyanide Industry Volume K Tons Forecast, by Country 2020 & 2033
- Table 45: Africa Sodium Cyanide Industry Revenue million Forecast, by End-user Industry 2020 & 2033
- Table 46: Africa Sodium Cyanide Industry Volume K Tons Forecast, by End-user Industry 2020 & 2033
- Table 47: Africa Sodium Cyanide Industry Revenue million Forecast, by Country 2020 & 2033
- Table 48: Africa Sodium Cyanide Industry Volume K Tons Forecast, by Country 2020 & 2033
Frequently Asked Questions
1. What is the projected Compound Annual Growth Rate (CAGR) of the Africa Sodium Cyanide Industry?
The projected CAGR is approximately 4.5%.
2. Which companies are prominent players in the Africa Sodium Cyanide Industry?
Key companies in the market include Honeywell International Inc, TAEKWANG INDUSTRIAL CO LTD, Australian Gold Reagents Pty Ltd, Evonik Industries AG, The Chemours Company, Sasol, HeBei ChengXin, TSPC, Orica Limited.
3. What are the main segments of the Africa Sodium Cyanide Industry?
The market segments include End-user Industry.
4. Can you provide details about the market size?
The market size is estimated to be USD 36.58 million as of 2022.
5. What are some drivers contributing to market growth?
Increasing Demand from the Gold Mining Activities; Increasing Demand for Use in Chemical and Polymer Synthesis.
6. What are the notable trends driving market growth?
Increasing Demand from Mining Industry.
7. Are there any restraints impacting market growth?
Toxicity of Sodium Cyanide.
8. Can you provide examples of recent developments in the market?
January 2023: Shortages of sodium cyanide in Tanzania has hampered the country's large and medium sclae miners.
9. What pricing options are available for accessing the report?
Pricing options include single-user, multi-user, and enterprise licenses priced at USD 4750, USD 5250, and USD 8750 respectively.
10. Is the market size provided in terms of value or volume?
The market size is provided in terms of value, measured in million and volume, measured in K Tons.
11. Are there any specific market keywords associated with the report?
Yes, the market keyword associated with the report is "Africa Sodium Cyanide Industry," which aids in identifying and referencing the specific market segment covered.
12. How do I determine which pricing option suits my needs best?
The pricing options vary based on user requirements and access needs. Individual users may opt for single-user licenses, while businesses requiring broader access may choose multi-user or enterprise licenses for cost-effective access to the report.
13. Are there any additional resources or data provided in the Africa Sodium Cyanide Industry report?
While the report offers comprehensive insights, it's advisable to review the specific contents or supplementary materials provided to ascertain if additional resources or data are available.
14. How can I stay updated on further developments or reports in the Africa Sodium Cyanide Industry?
To stay informed about further developments, trends, and reports in the Africa Sodium Cyanide Industry, consider subscribing to industry newsletters, following relevant companies and organizations, or regularly checking reputable industry news sources and publications.
Methodology
Step 1 - Identification of Relevant Samples Size from Population Database


Step 2 - Approaches for Defining Global Market Size (Value, Volume* & Price*)

Note*: In applicable scenarios
Step 3 - Data Sources
Primary Research
- Web Analytics
- Survey Reports
- Research Institute
- Latest Research Reports
- Opinion Leaders
Secondary Research
- Annual Reports
- White Paper
- Latest Press Release
- Industry Association
- Paid Database
- Investor Presentations

Step 4 - Data Triangulation
Involves using different sources of information in order to increase the validity of a study
These sources are likely to be stakeholders in a program - participants, other researchers, program staff, other community members, and so on.
Then we put all data in single framework & apply various statistical tools to find out the dynamic on the market.
During the analysis stage, feedback from the stakeholder groups would be compared to determine areas of agreement as well as areas of divergence