

Key Insights
The global aluminum ingots market is experiencing robust growth, driven by a compound annual growth rate (CAGR) exceeding 6.50% from 2019 to 2033. This expansion is fueled by several key factors. The automotive industry's increasing demand for lightweight materials to improve fuel efficiency is a significant driver, coupled with a similar trend in the aerospace sector where aluminum's strength-to-weight ratio is highly valued. The building and construction industry also contributes substantially, using aluminum ingots in various applications, from structural components to cladding. Growth in the semiconductor and electrical and electronics sectors, requiring aluminum for heat sinks and other components, further propels market expansion. While challenges such as fluctuating aluminum prices and potential supply chain disruptions exist, the overall market outlook remains positive. Emerging markets in Asia-Pacific, particularly China and India, represent significant growth opportunities due to rapid infrastructure development and industrialization. The competitive landscape includes major players like Alcoa, Rusal, and Hindalco, along with significant regional players, fostering innovation and competition. The market is segmented by end-user industry, allowing for targeted growth strategies and market penetration. Further growth is expected as sustainable and recyclable aluminum solutions gain traction, meeting increasing environmental concerns.
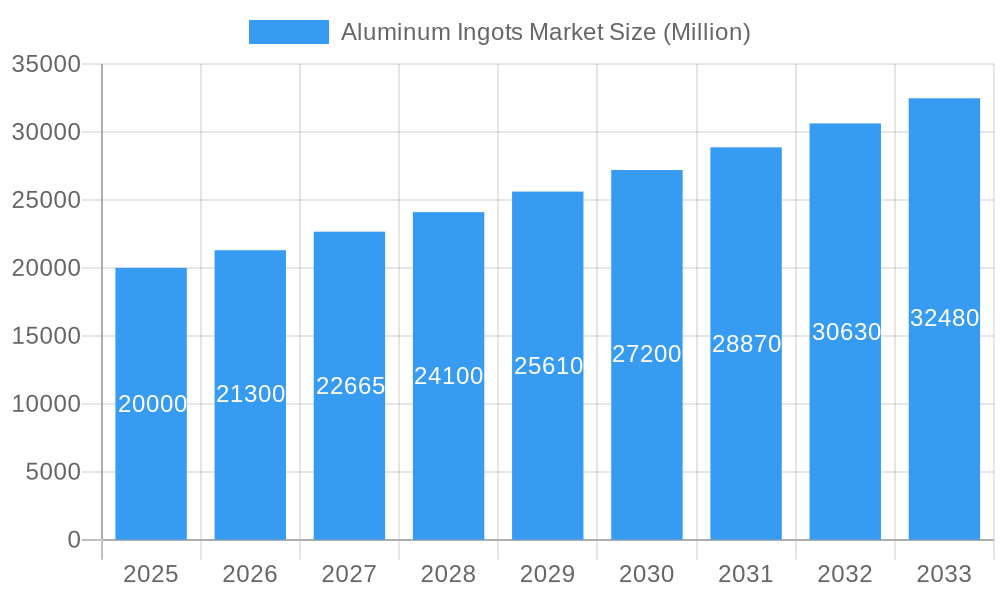
Aluminum Ingots Market Market Size (In Billion)
The forecast period of 2025-2033 is expected to witness continued growth, potentially exceeding the historical CAGR due to factors like increased adoption of electric vehicles, expansion of renewable energy infrastructure, and ongoing global industrialization. Specific regional variations will exist, with North America and Europe maintaining substantial market shares while the Asia-Pacific region demonstrates potentially higher growth rates. Industry consolidation and strategic partnerships are anticipated to shape the competitive landscape, leading to technological advancements and improved supply chain efficiencies. Companies will need to focus on innovation, cost-effective production, and sustainability to maintain a competitive edge. The strategic use of recycling and responsible sourcing practices will become increasingly important to meet environmental regulations and consumer demand. Overall, the aluminum ingots market presents a compelling investment opportunity for businesses with a long-term vision and the capability to adapt to the evolving dynamics of the global landscape.
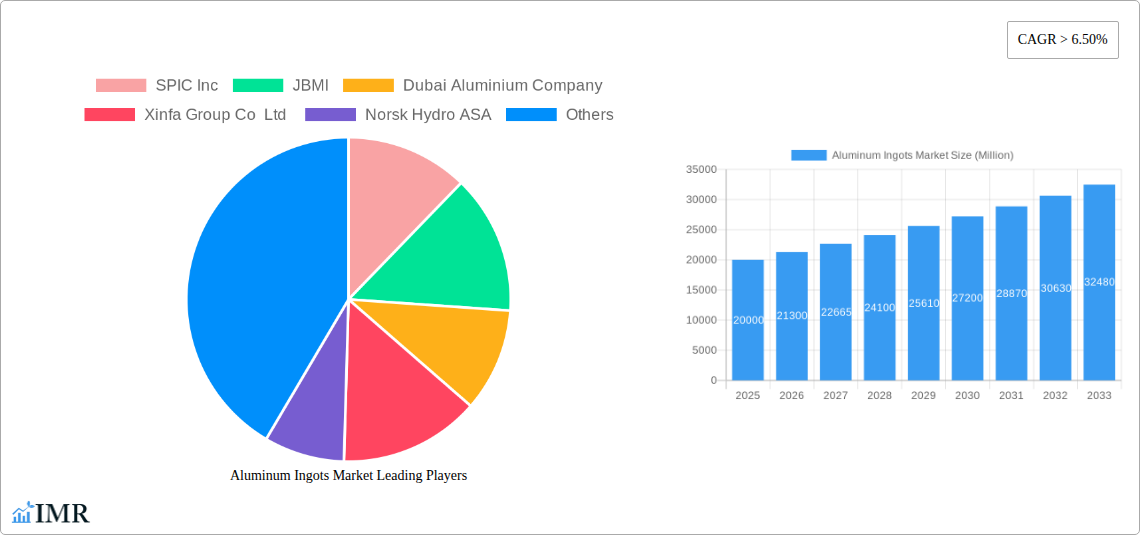
Aluminum Ingots Market Company Market Share
Aluminum Ingots Market: A Comprehensive Report (2019-2033)
This comprehensive report provides an in-depth analysis of the global Aluminum Ingots Market, encompassing market dynamics, growth trends, regional dominance, product landscape, key players, and future outlook. The report covers the period from 2019 to 2033, with a focus on the forecast period of 2025-2033 and a base year of 2025. It serves as an essential resource for industry professionals, investors, and stakeholders seeking a thorough understanding of this crucial sector within the broader non-ferrous metals market. The report analyzes the parent market of Non-ferrous Metals and the child market of Aluminum Ingots, providing a granular view of market segmentation by end-user industries.
Aluminum Ingots Market Dynamics & Structure
The Aluminum Ingots market, a key segment within the broader non-ferrous metals industry, is characterized by moderate concentration, with several major players holding significant market share. Market dynamics are influenced by technological advancements in aluminum production, evolving regulatory frameworks focused on sustainability and carbon emissions, and the competitive pressures from alternative materials. The automotive and construction sectors are primary drivers of demand, while M&A activity has been relatively consistent, with xx deals recorded between 2019 and 2024, resulting in a market share shift of approximately xx%.
- Market Concentration: Moderately concentrated, with top 5 players holding approximately xx% market share in 2024.
- Technological Innovation: Focus on reducing carbon footprint and improving production efficiency drives innovation. Barriers to entry include high capital investment and stringent environmental regulations.
- Regulatory Frameworks: Stringent emission standards and recycling mandates are shaping market dynamics, favoring sustainable production methods.
- Competitive Substitutes: Steel, plastics, and other lightweight materials pose competitive challenges.
- End-User Demographics: Growth is largely driven by the expanding automotive and construction industries in developing economies.
- M&A Trends: Consolidation through mergers and acquisitions is expected to continue, driving further market concentration.
Aluminum Ingots Market Growth Trends & Insights
The global Aluminum Ingots market experienced a CAGR of xx% during the historical period (2019-2024), reaching a market size of xx million units in 2024. Driven by robust growth in the automotive and construction sectors, particularly in Asia-Pacific and North America, the market is projected to maintain a steady growth trajectory during the forecast period (2025-2033), reaching xx million units by 2033, with a projected CAGR of xx%. Technological disruptions, such as advancements in casting and recycling technologies, are significantly impacting market growth and adoption rates. Consumer preference for lighter, more durable, and sustainable materials further fuels market expansion. Market penetration in developing economies remains high, with continued growth potential.
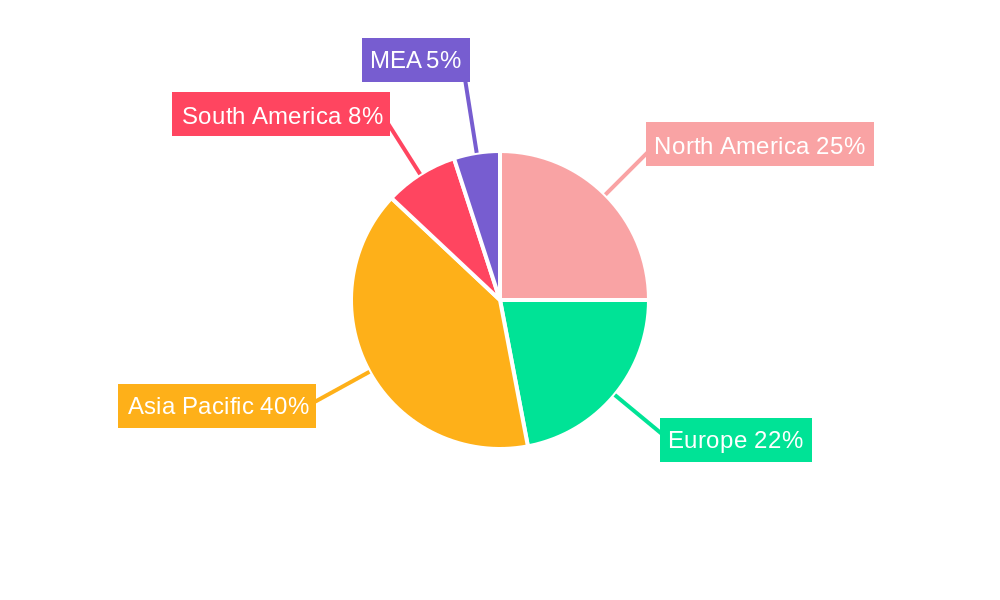
Dominant Regions, Countries, or Segments in Aluminum Ingots Market
The Asia-Pacific region dominated the Aluminum Ingots market in 2024, accounting for xx% of the global market share. This dominance is driven by robust economic growth, rapid infrastructure development, and a significant automotive and construction industry. China, India, and other Southeast Asian countries are key contributors to this regional success. North America and Europe also hold substantial market shares, although their growth rates are comparatively lower. Within end-user industries, the automotive sector is the leading consumer of aluminum ingots, followed by building and construction.
- Key Drivers in Asia-Pacific:
- Rapid industrialization and urbanization.
- Rising disposable incomes and consumer spending.
- Government initiatives promoting infrastructure development.
- Dominance Factors:
- Large and growing manufacturing base.
- Abundant raw material resources in some regions.
- Favorable government policies promoting industrial growth.
Aluminum Ingots Market Product Landscape
Aluminum ingots are available in various grades and alloys, each tailored to specific applications. Innovations focus on improving mechanical properties, enhancing corrosion resistance, and reducing production costs. High-strength alloys find increasing use in automotive and aerospace applications, while more cost-effective grades cater to the building and construction sector. The focus on lightweighting and sustainability drives the development of alloys with improved recyclability and lower carbon footprints.
Key Drivers, Barriers & Challenges in Aluminum Ingots Market
Key Drivers:
- Growing demand from the automotive and construction sectors.
- Increasing use of aluminum in lightweight applications.
- Advances in aluminum recycling technologies.
- Government support for sustainable materials and reduced carbon emissions.
Key Challenges:
- Fluctuations in raw material prices (bauxite and alumina).
- Energy costs associated with aluminum smelting.
- Stringent environmental regulations.
- Competition from alternative materials. The increased cost of raw materials has led to a price increase in aluminum ingots of approximately xx% between 2020 and 2024.
Emerging Opportunities in Aluminum Ingots Market
- Expansion into emerging markets with high growth potential.
- Development of new alloys for specific niche applications.
- Increased adoption of aluminum in renewable energy technologies (e.g., solar panels, wind turbines).
- Focus on sustainable production and recycling practices to meet environmental regulations.
Growth Accelerators in the Aluminum Ingots Market Industry
Technological advancements in aluminum smelting and casting processes are key drivers of market growth, leading to cost reduction and improved efficiency. Strategic partnerships between aluminum producers and end-user industries facilitate the development of customized alloys and promote the adoption of aluminum in new applications. Government policies supporting sustainable materials and renewable energy also contribute to long-term growth.
Key Players Shaping the Aluminum Ingots Market Market
- SPIC Inc
- JBMI
- Dubai Aluminium Company
- Xinfa Group Co Ltd
- Norsk Hydro ASA
- Aluminum Corporation of China Limited (Chalco)
- BHP Billiton
- United Company
- Rio Tinto Group
- CHINA ZHONGWANG HOLDINGS LIMITED
- RUSAL Plc
- Alcoa Inc
- Hindalco Industries Ltd
- Aluminium Bahrain
Notable Milestones in Aluminum Ingots Market Sector
- July 2022: Alcoa Corporation announced plans to expand casting capabilities at its Deschambault smelter, increasing production of standard ingots. This expansion will enhance Alcoa's capacity to meet growing market demand.
- August 2022: Rio Tinto invested USD 29 million in a new aluminum recycling facility, strengthening its commitment to sustainable aluminum solutions and expanding its offerings in the automotive, packaging, and construction sectors.
In-Depth Aluminum Ingots Market Market Outlook
The Aluminum Ingots market is poised for sustained growth, driven by continuous advancements in aluminum production technologies, increasing demand from key end-user industries, and the growing emphasis on sustainable and lightweight materials. Strategic partnerships, investments in recycling infrastructure, and expansion into new markets will further shape the industry's trajectory, presenting significant opportunities for players who can adapt to evolving market dynamics and meet the rising demand for high-quality, sustainable aluminum products.
Aluminum Ingots Market Segmentation
-
1. End-user Industry
- 1.1. Automotive
- 1.2. Aerospace
- 1.3. Building and Construction
- 1.4. Semiconductor
- 1.5. Electrical and Electronics
- 1.6. Other End-user Industries
Aluminum Ingots Market Segmentation By Geography
-
1. Asia Pacific
- 1.1. China
- 1.2. India
- 1.3. Japan
- 1.4. South Korea
- 1.5. Rest of Asia Pacific
-
2. North America
- 2.1. United States
- 2.2. Canada
- 2.3. Mexico
-
3. Europe
- 3.1. Germany
- 3.2. United Kingdom
- 3.3. Italy
- 3.4. France
- 3.5. Rest of Europe
-
4. South America
- 4.1. Brazil
- 4.2. Argentina
- 4.3. Rest of South America
-
5. Middle East and Africa
- 5.1. Saudi Arabia
- 5.2. South Africa
- 5.3. Rest of Middle East and Africa
Aluminum Ingots Market Regional Market Share
Geographic Coverage of Aluminum Ingots Market
Aluminum Ingots Market REPORT HIGHLIGHTS
| Aspects | Details |
|---|---|
| Study Period | 2020-2034 |
| Base Year | 2025 |
| Estimated Year | 2026 |
| Forecast Period | 2026-2034 |
| Historical Period | 2020-2025 |
| Growth Rate | CAGR of > 6.50% from 2020-2034 |
| Segmentation |
|
Table of Contents
- 1. Introduction
- 1.1. Research Scope
- 1.2. Market Segmentation
- 1.3. Research Objective
- 1.4. Definitions and Assumptions
- 2. Executive Summary
- 2.1. Market Snapshot
- 3. Market Dynamics
- 3.1. Market Drivers
- 3.2. Market Restrains
- 3.3. Market Trends
- 3.4. Market Opportunities
- 4. Market Factor Analysis
- 4.1. Porters Five Forces
- 4.1.1. Bargaining Power of Suppliers
- 4.1.2. Bargaining Power of Buyers
- 4.1.3. Threat of New Entrants
- 4.1.4. Threat of Substitutes
- 4.1.5. Competitive Rivalry
- 4.2. PESTEL analysis
- 4.3. BCG Analysis
- 4.3.1. Stars (High Growth, High Market Share)
- 4.3.2. Cash Cows (Low Growth, High Market Share)
- 4.3.3. Question Mark (High Growth, Low Market Share)
- 4.3.4. Dogs (Low Growth, Low Market Share)
- 4.4. Ansoff Matrix Analysis
- 4.5. Supply Chain Analysis
- 4.6. Regulatory Landscape
- 4.7. Current Market Potential and Opportunity Assessment (TAM–SAM–SOM Framework)
- 4.8. IMR Analyst Note
- 4.1. Porters Five Forces
- 5. Market Analysis, Insights and Forecast 2021-2033
- 5.1. Market Analysis, Insights and Forecast - by End-user Industry
- 5.1.1. Automotive
- 5.1.2. Aerospace
- 5.1.3. Building and Construction
- 5.1.4. Semiconductor
- 5.1.5. Electrical and Electronics
- 5.1.6. Other End-user Industries
- 5.2. Market Analysis, Insights and Forecast - by Region
- 5.2.1. Asia Pacific
- 5.2.2. North America
- 5.2.3. Europe
- 5.2.4. South America
- 5.2.5. Middle East and Africa
- 5.1. Market Analysis, Insights and Forecast - by End-user Industry
- 6. Global Aluminum Ingots Market Analysis, Insights and Forecast, 2021-2033
- 6.1. Market Analysis, Insights and Forecast - by End-user Industry
- 6.1.1. Automotive
- 6.1.2. Aerospace
- 6.1.3. Building and Construction
- 6.1.4. Semiconductor
- 6.1.5. Electrical and Electronics
- 6.1.6. Other End-user Industries
- 6.1. Market Analysis, Insights and Forecast - by End-user Industry
- 7. Asia Pacific Aluminum Ingots Market Analysis, Insights and Forecast, 2020-2032
- 7.1. Market Analysis, Insights and Forecast - by End-user Industry
- 7.1.1. Automotive
- 7.1.2. Aerospace
- 7.1.3. Building and Construction
- 7.1.4. Semiconductor
- 7.1.5. Electrical and Electronics
- 7.1.6. Other End-user Industries
- 7.1. Market Analysis, Insights and Forecast - by End-user Industry
- 8. North America Aluminum Ingots Market Analysis, Insights and Forecast, 2020-2032
- 8.1. Market Analysis, Insights and Forecast - by End-user Industry
- 8.1.1. Automotive
- 8.1.2. Aerospace
- 8.1.3. Building and Construction
- 8.1.4. Semiconductor
- 8.1.5. Electrical and Electronics
- 8.1.6. Other End-user Industries
- 8.1. Market Analysis, Insights and Forecast - by End-user Industry
- 9. Europe Aluminum Ingots Market Analysis, Insights and Forecast, 2020-2032
- 9.1. Market Analysis, Insights and Forecast - by End-user Industry
- 9.1.1. Automotive
- 9.1.2. Aerospace
- 9.1.3. Building and Construction
- 9.1.4. Semiconductor
- 9.1.5. Electrical and Electronics
- 9.1.6. Other End-user Industries
- 9.1. Market Analysis, Insights and Forecast - by End-user Industry
- 10. South America Aluminum Ingots Market Analysis, Insights and Forecast, 2020-2032
- 10.1. Market Analysis, Insights and Forecast - by End-user Industry
- 10.1.1. Automotive
- 10.1.2. Aerospace
- 10.1.3. Building and Construction
- 10.1.4. Semiconductor
- 10.1.5. Electrical and Electronics
- 10.1.6. Other End-user Industries
- 10.1. Market Analysis, Insights and Forecast - by End-user Industry
- 11. Middle East and Africa Aluminum Ingots Market Analysis, Insights and Forecast, 2020-2032
- 11.1. Market Analysis, Insights and Forecast - by End-user Industry
- 11.1.1. Automotive
- 11.1.2. Aerospace
- 11.1.3. Building and Construction
- 11.1.4. Semiconductor
- 11.1.5. Electrical and Electronics
- 11.1.6. Other End-user Industries
- 11.1. Market Analysis, Insights and Forecast - by End-user Industry
- 12. Competitive Analysis
- 12.1. Company Profiles
- 12.1.1 SPIC Inc
- 12.1.1.1. Company Overview
- 12.1.1.2. Products
- 12.1.1.3. Company Financials
- 12.1.1.4. SWOT Analysis
- 12.1.2 JBMI
- 12.1.2.1. Company Overview
- 12.1.2.2. Products
- 12.1.2.3. Company Financials
- 12.1.2.4. SWOT Analysis
- 12.1.3 Dubai Aluminium Company
- 12.1.3.1. Company Overview
- 12.1.3.2. Products
- 12.1.3.3. Company Financials
- 12.1.3.4. SWOT Analysis
- 12.1.4 Xinfa Group Co Ltd
- 12.1.4.1. Company Overview
- 12.1.4.2. Products
- 12.1.4.3. Company Financials
- 12.1.4.4. SWOT Analysis
- 12.1.5 Norsk Hydro ASA
- 12.1.5.1. Company Overview
- 12.1.5.2. Products
- 12.1.5.3. Company Financials
- 12.1.5.4. SWOT Analysis
- 12.1.6 Aluminum Corporation of China Limited (Chalco)
- 12.1.6.1. Company Overview
- 12.1.6.2. Products
- 12.1.6.3. Company Financials
- 12.1.6.4. SWOT Analysis
- 12.1.7 BHP Billiton
- 12.1.7.1. Company Overview
- 12.1.7.2. Products
- 12.1.7.3. Company Financials
- 12.1.7.4. SWOT Analysis
- 12.1.8 United Company
- 12.1.8.1. Company Overview
- 12.1.8.2. Products
- 12.1.8.3. Company Financials
- 12.1.8.4. SWOT Analysis
- 12.1.9 Rio Tinto Group
- 12.1.9.1. Company Overview
- 12.1.9.2. Products
- 12.1.9.3. Company Financials
- 12.1.9.4. SWOT Analysis
- 12.1.10 CHINA ZHONGWANG HOLDINGS LIMITED
- 12.1.10.1. Company Overview
- 12.1.10.2. Products
- 12.1.10.3. Company Financials
- 12.1.10.4. SWOT Analysis
- 12.1.11 RUSAL Plc
- 12.1.11.1. Company Overview
- 12.1.11.2. Products
- 12.1.11.3. Company Financials
- 12.1.11.4. SWOT Analysis
- 12.1.12 Alcoa Inc
- 12.1.12.1. Company Overview
- 12.1.12.2. Products
- 12.1.12.3. Company Financials
- 12.1.12.4. SWOT Analysis
- 12.1.13 Hindalco Industries Ltd
- 12.1.13.1. Company Overview
- 12.1.13.2. Products
- 12.1.13.3. Company Financials
- 12.1.13.4. SWOT Analysis
- 12.1.14 Aluminium Bahrain
- 12.1.14.1. Company Overview
- 12.1.14.2. Products
- 12.1.14.3. Company Financials
- 12.1.14.4. SWOT Analysis
- 12.1.1 SPIC Inc
- 12.2. Market Entropy
- 12.2.1 Company's Key Areas Served
- 12.2.2 Recent Developments
- 12.3. Company Market Share Analysis 2025
- 12.3.1 Top 5 Companies Market Share Analysis
- 12.3.2 Top 3 Companies Market Share Analysis
- 12.4. List of Potential Customers
- 13. Research Methodology
List of Figures
- Figure 1: Global Aluminum Ingots Market Revenue Breakdown (Million, %) by Region 2025 & 2033
- Figure 2: Global Aluminum Ingots Market Volume Breakdown (K Tons, %) by Region 2025 & 2033
- Figure 3: Asia Pacific Aluminum Ingots Market Revenue (Million), by End-user Industry 2025 & 2033
- Figure 4: Asia Pacific Aluminum Ingots Market Volume (K Tons), by End-user Industry 2025 & 2033
- Figure 5: Asia Pacific Aluminum Ingots Market Revenue Share (%), by End-user Industry 2025 & 2033
- Figure 6: Asia Pacific Aluminum Ingots Market Volume Share (%), by End-user Industry 2025 & 2033
- Figure 7: Asia Pacific Aluminum Ingots Market Revenue (Million), by Country 2025 & 2033
- Figure 8: Asia Pacific Aluminum Ingots Market Volume (K Tons), by Country 2025 & 2033
- Figure 9: Asia Pacific Aluminum Ingots Market Revenue Share (%), by Country 2025 & 2033
- Figure 10: Asia Pacific Aluminum Ingots Market Volume Share (%), by Country 2025 & 2033
- Figure 11: North America Aluminum Ingots Market Revenue (Million), by End-user Industry 2025 & 2033
- Figure 12: North America Aluminum Ingots Market Volume (K Tons), by End-user Industry 2025 & 2033
- Figure 13: North America Aluminum Ingots Market Revenue Share (%), by End-user Industry 2025 & 2033
- Figure 14: North America Aluminum Ingots Market Volume Share (%), by End-user Industry 2025 & 2033
- Figure 15: North America Aluminum Ingots Market Revenue (Million), by Country 2025 & 2033
- Figure 16: North America Aluminum Ingots Market Volume (K Tons), by Country 2025 & 2033
- Figure 17: North America Aluminum Ingots Market Revenue Share (%), by Country 2025 & 2033
- Figure 18: North America Aluminum Ingots Market Volume Share (%), by Country 2025 & 2033
- Figure 19: Europe Aluminum Ingots Market Revenue (Million), by End-user Industry 2025 & 2033
- Figure 20: Europe Aluminum Ingots Market Volume (K Tons), by End-user Industry 2025 & 2033
- Figure 21: Europe Aluminum Ingots Market Revenue Share (%), by End-user Industry 2025 & 2033
- Figure 22: Europe Aluminum Ingots Market Volume Share (%), by End-user Industry 2025 & 2033
- Figure 23: Europe Aluminum Ingots Market Revenue (Million), by Country 2025 & 2033
- Figure 24: Europe Aluminum Ingots Market Volume (K Tons), by Country 2025 & 2033
- Figure 25: Europe Aluminum Ingots Market Revenue Share (%), by Country 2025 & 2033
- Figure 26: Europe Aluminum Ingots Market Volume Share (%), by Country 2025 & 2033
- Figure 27: South America Aluminum Ingots Market Revenue (Million), by End-user Industry 2025 & 2033
- Figure 28: South America Aluminum Ingots Market Volume (K Tons), by End-user Industry 2025 & 2033
- Figure 29: South America Aluminum Ingots Market Revenue Share (%), by End-user Industry 2025 & 2033
- Figure 30: South America Aluminum Ingots Market Volume Share (%), by End-user Industry 2025 & 2033
- Figure 31: South America Aluminum Ingots Market Revenue (Million), by Country 2025 & 2033
- Figure 32: South America Aluminum Ingots Market Volume (K Tons), by Country 2025 & 2033
- Figure 33: South America Aluminum Ingots Market Revenue Share (%), by Country 2025 & 2033
- Figure 34: South America Aluminum Ingots Market Volume Share (%), by Country 2025 & 2033
- Figure 35: Middle East and Africa Aluminum Ingots Market Revenue (Million), by End-user Industry 2025 & 2033
- Figure 36: Middle East and Africa Aluminum Ingots Market Volume (K Tons), by End-user Industry 2025 & 2033
- Figure 37: Middle East and Africa Aluminum Ingots Market Revenue Share (%), by End-user Industry 2025 & 2033
- Figure 38: Middle East and Africa Aluminum Ingots Market Volume Share (%), by End-user Industry 2025 & 2033
- Figure 39: Middle East and Africa Aluminum Ingots Market Revenue (Million), by Country 2025 & 2033
- Figure 40: Middle East and Africa Aluminum Ingots Market Volume (K Tons), by Country 2025 & 2033
- Figure 41: Middle East and Africa Aluminum Ingots Market Revenue Share (%), by Country 2025 & 2033
- Figure 42: Middle East and Africa Aluminum Ingots Market Volume Share (%), by Country 2025 & 2033
List of Tables
- Table 1: Global Aluminum Ingots Market Revenue Million Forecast, by End-user Industry 2020 & 2033
- Table 2: Global Aluminum Ingots Market Volume K Tons Forecast, by End-user Industry 2020 & 2033
- Table 3: Global Aluminum Ingots Market Revenue Million Forecast, by Region 2020 & 2033
- Table 4: Global Aluminum Ingots Market Volume K Tons Forecast, by Region 2020 & 2033
- Table 5: Global Aluminum Ingots Market Revenue Million Forecast, by End-user Industry 2020 & 2033
- Table 6: Global Aluminum Ingots Market Volume K Tons Forecast, by End-user Industry 2020 & 2033
- Table 7: Global Aluminum Ingots Market Revenue Million Forecast, by Country 2020 & 2033
- Table 8: Global Aluminum Ingots Market Volume K Tons Forecast, by Country 2020 & 2033
- Table 9: China Aluminum Ingots Market Revenue (Million) Forecast, by Application 2020 & 2033
- Table 10: China Aluminum Ingots Market Volume (K Tons) Forecast, by Application 2020 & 2033
- Table 11: India Aluminum Ingots Market Revenue (Million) Forecast, by Application 2020 & 2033
- Table 12: India Aluminum Ingots Market Volume (K Tons) Forecast, by Application 2020 & 2033
- Table 13: Japan Aluminum Ingots Market Revenue (Million) Forecast, by Application 2020 & 2033
- Table 14: Japan Aluminum Ingots Market Volume (K Tons) Forecast, by Application 2020 & 2033
- Table 15: South Korea Aluminum Ingots Market Revenue (Million) Forecast, by Application 2020 & 2033
- Table 16: South Korea Aluminum Ingots Market Volume (K Tons) Forecast, by Application 2020 & 2033
- Table 17: Rest of Asia Pacific Aluminum Ingots Market Revenue (Million) Forecast, by Application 2020 & 2033
- Table 18: Rest of Asia Pacific Aluminum Ingots Market Volume (K Tons) Forecast, by Application 2020 & 2033
- Table 19: Global Aluminum Ingots Market Revenue Million Forecast, by End-user Industry 2020 & 2033
- Table 20: Global Aluminum Ingots Market Volume K Tons Forecast, by End-user Industry 2020 & 2033
- Table 21: Global Aluminum Ingots Market Revenue Million Forecast, by Country 2020 & 2033
- Table 22: Global Aluminum Ingots Market Volume K Tons Forecast, by Country 2020 & 2033
- Table 23: United States Aluminum Ingots Market Revenue (Million) Forecast, by Application 2020 & 2033
- Table 24: United States Aluminum Ingots Market Volume (K Tons) Forecast, by Application 2020 & 2033
- Table 25: Canada Aluminum Ingots Market Revenue (Million) Forecast, by Application 2020 & 2033
- Table 26: Canada Aluminum Ingots Market Volume (K Tons) Forecast, by Application 2020 & 2033
- Table 27: Mexico Aluminum Ingots Market Revenue (Million) Forecast, by Application 2020 & 2033
- Table 28: Mexico Aluminum Ingots Market Volume (K Tons) Forecast, by Application 2020 & 2033
- Table 29: Global Aluminum Ingots Market Revenue Million Forecast, by End-user Industry 2020 & 2033
- Table 30: Global Aluminum Ingots Market Volume K Tons Forecast, by End-user Industry 2020 & 2033
- Table 31: Global Aluminum Ingots Market Revenue Million Forecast, by Country 2020 & 2033
- Table 32: Global Aluminum Ingots Market Volume K Tons Forecast, by Country 2020 & 2033
- Table 33: Germany Aluminum Ingots Market Revenue (Million) Forecast, by Application 2020 & 2033
- Table 34: Germany Aluminum Ingots Market Volume (K Tons) Forecast, by Application 2020 & 2033
- Table 35: United Kingdom Aluminum Ingots Market Revenue (Million) Forecast, by Application 2020 & 2033
- Table 36: United Kingdom Aluminum Ingots Market Volume (K Tons) Forecast, by Application 2020 & 2033
- Table 37: Italy Aluminum Ingots Market Revenue (Million) Forecast, by Application 2020 & 2033
- Table 38: Italy Aluminum Ingots Market Volume (K Tons) Forecast, by Application 2020 & 2033
- Table 39: France Aluminum Ingots Market Revenue (Million) Forecast, by Application 2020 & 2033
- Table 40: France Aluminum Ingots Market Volume (K Tons) Forecast, by Application 2020 & 2033
- Table 41: Rest of Europe Aluminum Ingots Market Revenue (Million) Forecast, by Application 2020 & 2033
- Table 42: Rest of Europe Aluminum Ingots Market Volume (K Tons) Forecast, by Application 2020 & 2033
- Table 43: Global Aluminum Ingots Market Revenue Million Forecast, by End-user Industry 2020 & 2033
- Table 44: Global Aluminum Ingots Market Volume K Tons Forecast, by End-user Industry 2020 & 2033
- Table 45: Global Aluminum Ingots Market Revenue Million Forecast, by Country 2020 & 2033
- Table 46: Global Aluminum Ingots Market Volume K Tons Forecast, by Country 2020 & 2033
- Table 47: Brazil Aluminum Ingots Market Revenue (Million) Forecast, by Application 2020 & 2033
- Table 48: Brazil Aluminum Ingots Market Volume (K Tons) Forecast, by Application 2020 & 2033
- Table 49: Argentina Aluminum Ingots Market Revenue (Million) Forecast, by Application 2020 & 2033
- Table 50: Argentina Aluminum Ingots Market Volume (K Tons) Forecast, by Application 2020 & 2033
- Table 51: Rest of South America Aluminum Ingots Market Revenue (Million) Forecast, by Application 2020 & 2033
- Table 52: Rest of South America Aluminum Ingots Market Volume (K Tons) Forecast, by Application 2020 & 2033
- Table 53: Global Aluminum Ingots Market Revenue Million Forecast, by End-user Industry 2020 & 2033
- Table 54: Global Aluminum Ingots Market Volume K Tons Forecast, by End-user Industry 2020 & 2033
- Table 55: Global Aluminum Ingots Market Revenue Million Forecast, by Country 2020 & 2033
- Table 56: Global Aluminum Ingots Market Volume K Tons Forecast, by Country 2020 & 2033
- Table 57: Saudi Arabia Aluminum Ingots Market Revenue (Million) Forecast, by Application 2020 & 2033
- Table 58: Saudi Arabia Aluminum Ingots Market Volume (K Tons) Forecast, by Application 2020 & 2033
- Table 59: South Africa Aluminum Ingots Market Revenue (Million) Forecast, by Application 2020 & 2033
- Table 60: South Africa Aluminum Ingots Market Volume (K Tons) Forecast, by Application 2020 & 2033
- Table 61: Rest of Middle East and Africa Aluminum Ingots Market Revenue (Million) Forecast, by Application 2020 & 2033
- Table 62: Rest of Middle East and Africa Aluminum Ingots Market Volume (K Tons) Forecast, by Application 2020 & 2033
Frequently Asked Questions
1. What is the projected Compound Annual Growth Rate (CAGR) of the Aluminum Ingots Market?
The projected CAGR is approximately > 6.50%.
2. Which companies are prominent players in the Aluminum Ingots Market?
Key companies in the market include SPIC Inc, JBMI, Dubai Aluminium Company, Xinfa Group Co Ltd , Norsk Hydro ASA, Aluminum Corporation of China Limited (Chalco), BHP Billiton, United Company, Rio Tinto Group, CHINA ZHONGWANG HOLDINGS LIMITED, RUSAL Plc, Alcoa Inc, Hindalco Industries Ltd, Aluminium Bahrain.
3. What are the main segments of the Aluminum Ingots Market?
The market segments include End-user Industry.
4. Can you provide details about the market size?
The market size is estimated to be USD XX Million as of 2022.
5. What are some drivers contributing to market growth?
Surging Construction Activities in Developing Countries; Rising Application of Aluminum Ingots in the Automotive Industry.
6. What are the notable trends driving market growth?
Significant Growth in Building and Construction Segment.
7. Are there any restraints impacting market growth?
Fluctuating Prices of Raw Materials; Other Market Restraints.
8. Can you provide examples of recent developments in the market?
July 2022: Alcoa Corporation announced that it would soon start the project construction to increase the casting capabilities at its Deschambault smelter in Canada to include standard ingots. The new casting equipment will be constructed in an existing building, with the project fully completed in the first quarter of 2023.
9. What pricing options are available for accessing the report?
Pricing options include single-user, multi-user, and enterprise licenses priced at USD 4750, USD 5250, and USD 8750 respectively.
10. Is the market size provided in terms of value or volume?
The market size is provided in terms of value, measured in Million and volume, measured in K Tons.
11. Are there any specific market keywords associated with the report?
Yes, the market keyword associated with the report is "Aluminum Ingots Market," which aids in identifying and referencing the specific market segment covered.
12. How do I determine which pricing option suits my needs best?
The pricing options vary based on user requirements and access needs. Individual users may opt for single-user licenses, while businesses requiring broader access may choose multi-user or enterprise licenses for cost-effective access to the report.
13. Are there any additional resources or data provided in the Aluminum Ingots Market report?
While the report offers comprehensive insights, it's advisable to review the specific contents or supplementary materials provided to ascertain if additional resources or data are available.
14. How can I stay updated on further developments or reports in the Aluminum Ingots Market?
To stay informed about further developments, trends, and reports in the Aluminum Ingots Market, consider subscribing to industry newsletters, following relevant companies and organizations, or regularly checking reputable industry news sources and publications.
Methodology
Step 1 - Identification of Relevant Samples Size from Population Database


Step 2 - Approaches for Defining Global Market Size (Value, Volume* & Price*)

Note*: In applicable scenarios
Step 3 - Data Sources
Primary Research
- Web Analytics
- Survey Reports
- Research Institute
- Latest Research Reports
- Opinion Leaders
Secondary Research
- Annual Reports
- White Paper
- Latest Press Release
- Industry Association
- Paid Database
- Investor Presentations

Step 4 - Data Triangulation
Involves using different sources of information in order to increase the validity of a study
These sources are likely to be stakeholders in a program - participants, other researchers, program staff, other community members, and so on.
Then we put all data in single framework & apply various statistical tools to find out the dynamic on the market.
During the analysis stage, feedback from the stakeholder groups would be compared to determine areas of agreement as well as areas of divergence