

Key Insights
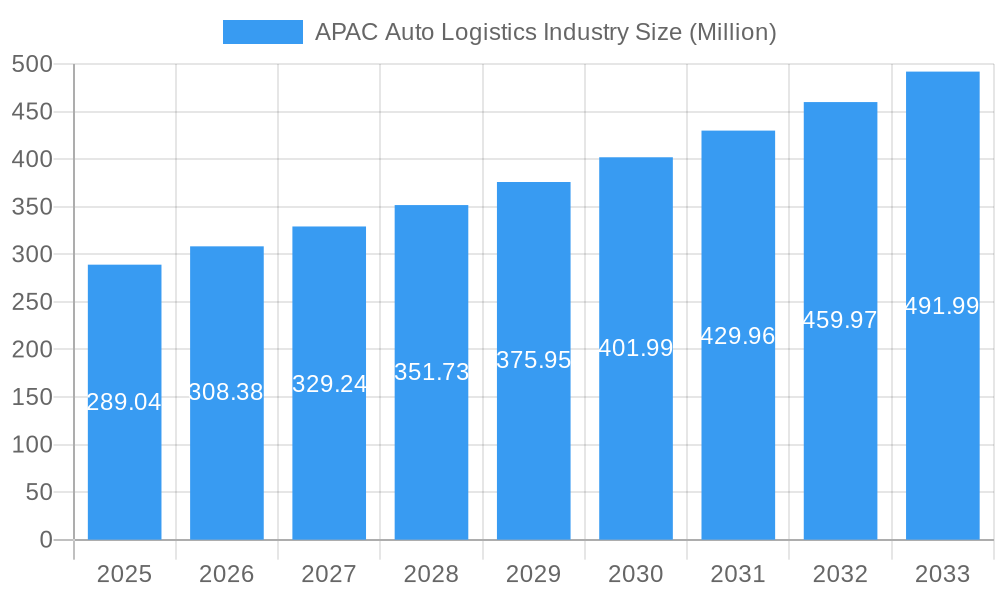
The Asia-Pacific (APAC) auto logistics market, valued at $289.04 million in 2025, is projected for robust growth, exhibiting a Compound Annual Growth Rate (CAGR) exceeding 6.50% from 2025 to 2033. This expansion is driven by several factors. The burgeoning automotive manufacturing and sales within the region, particularly in China, India, and other emerging economies, fuel significant demand for efficient transportation, warehousing, and inventory management solutions. Increasing investments in automotive infrastructure, including improved road networks and port facilities, further enhance logistics capabilities. The rise of e-commerce and the shift towards just-in-time inventory management are also key contributors to market growth. Furthermore, the growing preference for sophisticated logistics solutions, including advanced tracking and fleet management systems, is driving the adoption of technology-enabled services. Competition among established players like DB Schenker, DHL, and Nippon Express, alongside emerging logistics providers, fosters innovation and enhances service offerings, furthering market expansion.
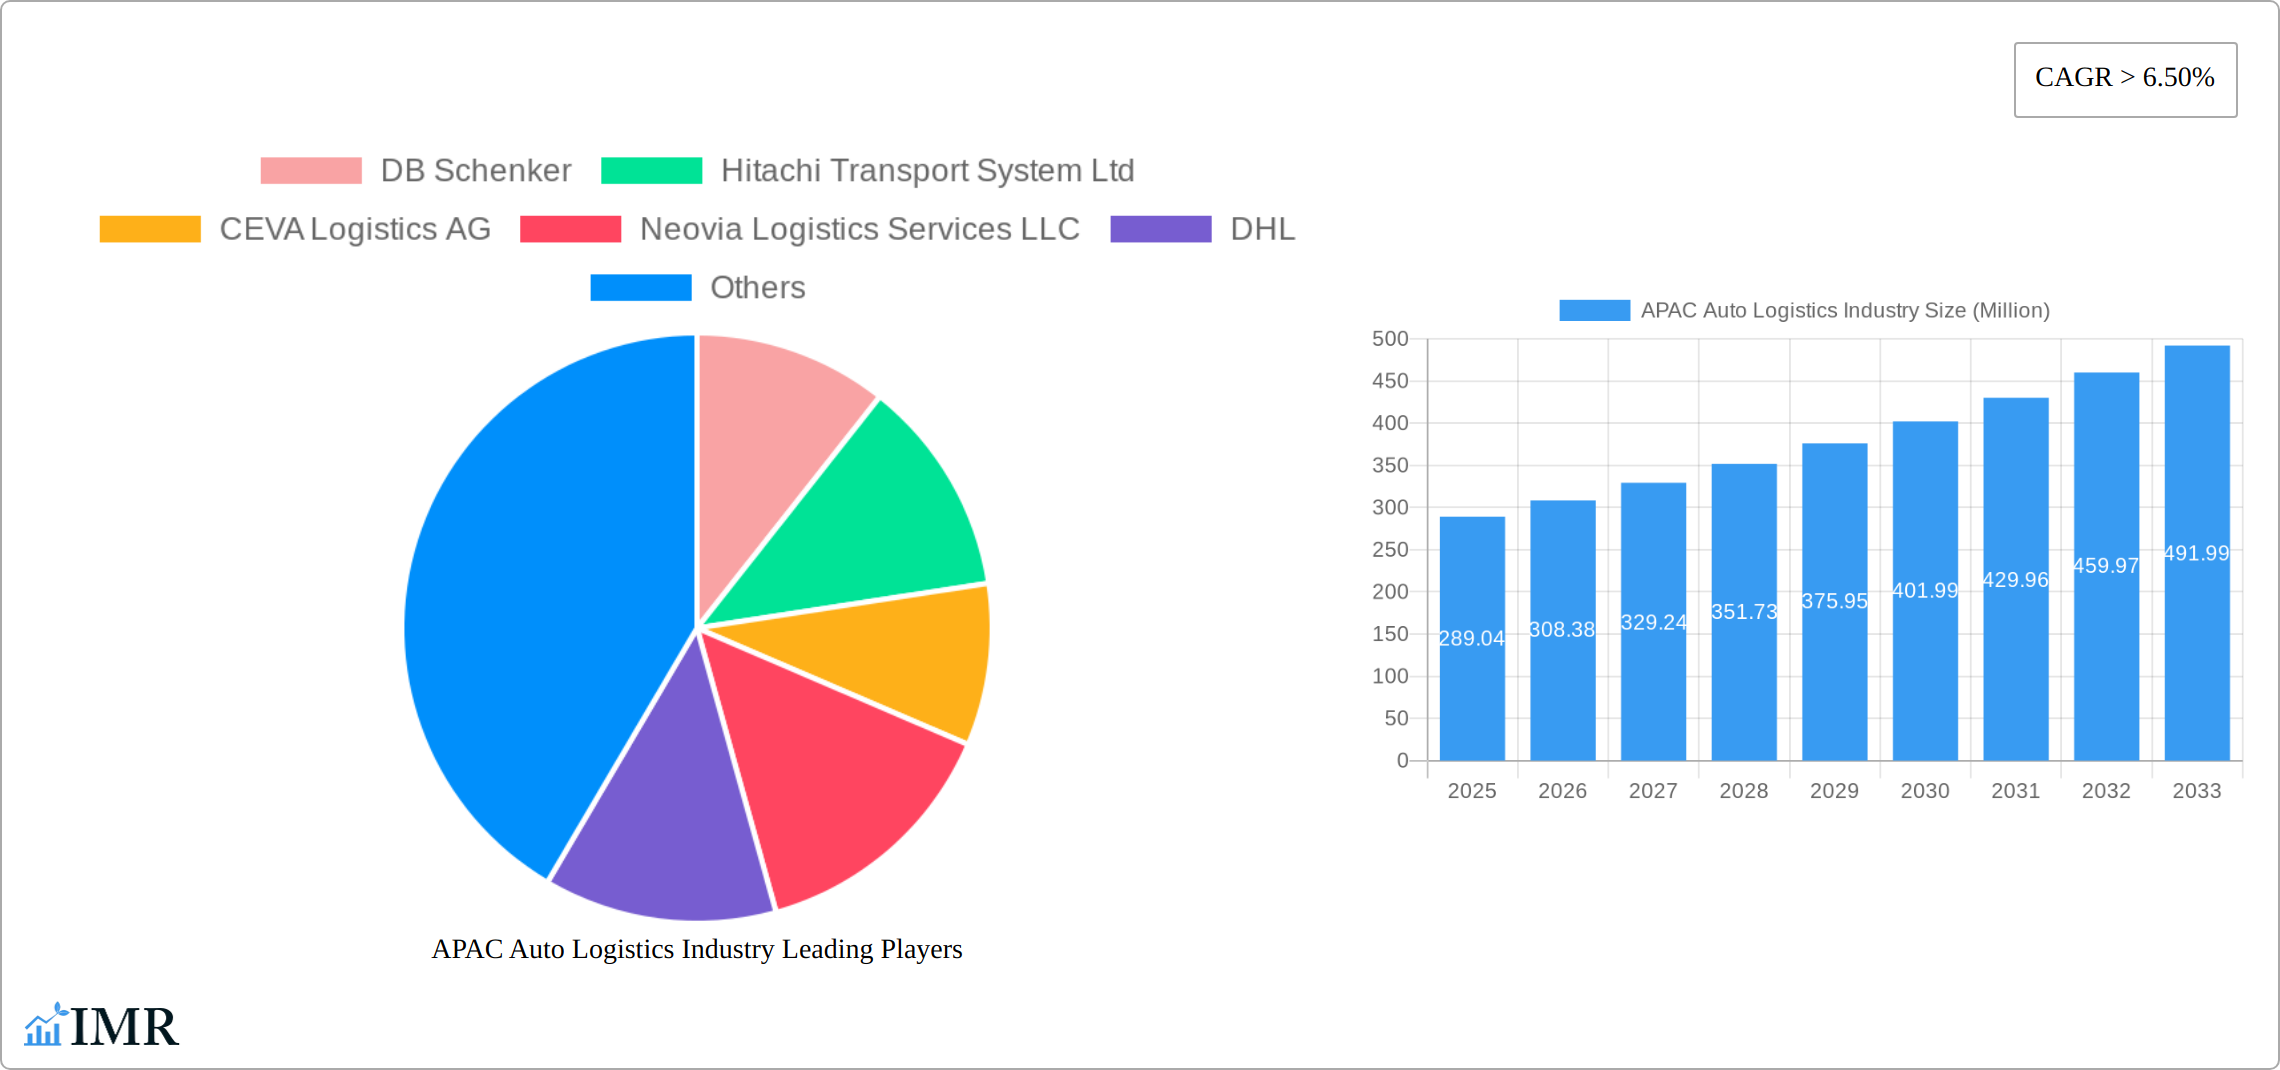
APAC Auto Logistics Industry Market Size (In Million)
Growth within specific segments varies. Finished vehicle logistics holds a substantial share, though the auto components segment is experiencing rapid growth due to the increasing complexity of modern vehicles and the need for specialized handling. China and India remain the dominant markets, fueled by their massive automotive production and consumption. However, other countries like Japan, South Korea, and Indonesia are also witnessing significant growth, contributing to the overall APAC market expansion. While challenges exist, such as infrastructure limitations in certain regions and fluctuating fuel prices, the overall outlook for the APAC auto logistics market remains positive, with considerable potential for continued growth throughout the forecast period. The market is expected to benefit from further government support for infrastructure development and the continuous adoption of advanced technologies.
APAC Auto Logistics Industry Company Market Share
APAC Auto Logistics Industry Market Report: 2019-2033
This comprehensive report provides an in-depth analysis of the Asia-Pacific (APAC) auto logistics industry, covering market dynamics, growth trends, key players, and future outlook. With a study period spanning 2019-2033, a base year of 2025, and a forecast period of 2025-2033, this report is an essential resource for industry professionals, investors, and strategic planners. The report analyzes the market across various segments, including by service, vehicle type, and country. The market size is expressed in Million units throughout.
APAC Auto Logistics Industry Market Dynamics & Structure
The APAC auto logistics market is characterized by a moderately concentrated landscape with several multinational players and a significant number of regional operators. Market share is dynamic, with ongoing mergers and acquisitions (M&A) activity reshaping the competitive structure. Technological innovation, particularly in areas such as autonomous vehicles, fleet management software, and supply chain optimization technologies, is a key driver of growth. Regulatory frameworks, varying significantly across APAC nations, influence operational costs and compliance requirements. The rise of electric vehicles (EVs) is creating new demands and opportunities, while the industry also faces challenges from substitute transportation modes and increasing environmental regulations.
- Market Concentration: Moderately concentrated, with top 5 players holding approximately xx% market share in 2024.
- Technological Innovation: Focus on automation, AI-powered logistics, and sustainable solutions.
- Regulatory Landscape: Complex and varied across APAC countries, impacting operational efficiency.
- M&A Activity: Significant activity observed in recent years, with xx major deals concluded in the 2019-2024 period.
- Substitute Products: Growing competition from alternative transportation modes and delivery methods.
- End-User Demographics: Shifting towards younger demographics and increased preference for convenient delivery services.
APAC Auto Logistics Industry Growth Trends & Insights
The APAC auto logistics market demonstrated robust growth from 2019 to 2024, driven by a surge in vehicle production, the expansion of e-commerce, and increased cross-border trade. This momentum is projected to continue, with a significant Compound Annual Growth Rate (CAGR) of [Insert Projected CAGR]% anticipated from 2025 to 2033. Several key factors underpin this growth trajectory: the rise of urbanization and disposable incomes across the region, the burgeoning automotive manufacturing sector – particularly in Southeast Asia – and the accelerating adoption of advanced technologies. The integration of sophisticated tracking systems and automation solutions is streamlining operations and boosting efficiency. Furthermore, evolving consumer preferences, including a shift towards online vehicle purchases and the growing demand for rapid, reliable delivery, are significantly impacting the sector's expansion. Market penetration is expected to reach [Insert Projected Market Penetration]% by 2033.
Dominant Regions, Countries, or Segments in APAC Auto Logistics Industry
China maintains its position as the dominant force in the APAC auto logistics sector, commanding [Insert Percentage]% of the total market value in 2024. This leadership stems from its immense automotive production capacity and robust consumer demand. India is experiencing remarkable growth, emerging as a key contributor with a projected CAGR of [Insert Projected CAGR]% during the forecast period. Japan and South Korea retain substantial market share, leveraging their advanced technological infrastructure and highly efficient logistics networks. Within the market segmentation, the finished vehicle segment holds the largest share, followed closely by auto components. Transportation services represent the most significant portion of the overall market, outpacing warehousing and distribution.
- Key Drivers for China: Massive automotive production, strong domestic demand, extensive infrastructure, and government support for the automotive industry.
- Key Drivers for India: Rapid economic growth, increasing vehicle ownership, government initiatives promoting infrastructure development, and a growing middle class with increased purchasing power.
- Key Drivers for Japan & South Korea: Advanced technology adoption, efficient and well-established logistics systems, high automotive exports, and a focus on innovation in automotive technology.
- Segment Dominance: Finished vehicles ([Insert Number] Million units) and Transportation services ([Insert Number] Million units) dominate the market, reflecting the significant volume of vehicle movement and the reliance on efficient transportation networks.
APAP Auto Logistics Industry Product Landscape
The APAC auto logistics industry showcases significant product innovation, focusing on enhanced tracking and tracing technologies, real-time visibility solutions, and integrated logistics platforms. These advancements improve efficiency, reduce costs, and enhance security. The integration of AI and machine learning is becoming increasingly prominent, enabling predictive analytics and optimized route planning. Unique selling propositions include customized solutions tailored to specific client needs, end-to-end visibility, and sustainable transportation options.
Key Drivers, Barriers & Challenges in APAP Auto Logistics Industry
Key Drivers: Rising automotive production, increasing e-commerce penetration, expanding infrastructure, and government support for logistics development. The growth of the EV market is also a significant driver.
Challenges: Supply chain disruptions caused by geopolitical instability and natural disasters, increasing fuel costs, stringent environmental regulations, and intense competition amongst logistics providers. These factors contribute to unpredictable operational costs and increased pressure on profit margins. For instance, the xx% increase in fuel prices in 2022 significantly impacted operational expenses for many companies.
Emerging Opportunities in APAP Auto Logistics Industry
Emerging opportunities include the growth of last-mile delivery solutions for EVs and auto parts, the increasing demand for specialized transportation for high-value vehicles, and the expansion into untapped markets within Southeast Asia. The adoption of blockchain technology for enhanced supply chain transparency and the development of sustainable logistics solutions present further growth avenues.
Growth Accelerators in the APAC Auto Logistics Industry
Strategic partnerships between auto manufacturers and logistics providers, investments in advanced technologies, and the expansion into new markets will accelerate growth. The development of integrated logistics platforms and the adoption of sustainable practices are key strategies for long-term success in this dynamic industry.
Key Players Shaping the APAC Auto Logistics Industry Market
- DB Schenker
- Hitachi Transport System Ltd
- CEVA Logistics AG
- Neovia Logistics Services LLC
- DHL
- Yusen Logistics Co Ltd
- GEODIS
- Nippon Express Co Ltd
- United Parcel Service Inc
- XPO Logistics Inc
- KUEHNE + NAGEL International AG
- DSV
- Ryder System Inc
Notable Milestones in APAC Auto Logistics Industry Sector
- March 2023: Tata Motors received a significant order for 1000 XPRES-T EVs from OHM E Logistics, highlighting the growing demand for electric vehicles and the associated logistical requirements.
- December 2022: Tata Motors signed a contract with Everest Fleet Pvt. Ltd. for the delivery of 5,000 XPRES-T EVs, further solidifying the expanding EV market and its impact on the auto logistics sector.
- [Add more recent milestones and briefly describe their significance to the industry. Include dates and brief descriptions. For example: mention any significant investments in infrastructure, technological advancements, mergers, acquisitions, or regulatory changes.]
In-Depth APAC Auto Logistics Industry Market Outlook
The APAC auto logistics market is poised for continued strong growth, driven by technological advancements, expanding infrastructure, and increasing demand. Strategic partnerships, investments in sustainable solutions, and expansion into new markets will be crucial for companies to capitalize on the significant opportunities within this sector. The market is expected to reach xx Million units by 2033, presenting substantial potential for both established and emerging players.
APAC Auto Logistics Industry Segmentation
-
1. Service
- 1.1. Transportation
- 1.2. Warehousing, Distribution and Inventory Management
- 1.3. Other Services
-
2. Type
- 2.1. Finished Vehicle
- 2.2. Auto Components
- 2.3. Other types
APAC Auto Logistics Industry Segmentation By Geography
-
1. North America
- 1.1. United States
- 1.2. Canada
- 1.3. Mexico
-
2. South America
- 2.1. Brazil
- 2.2. Argentina
- 2.3. Rest of South America
-
3. Europe
- 3.1. United Kingdom
- 3.2. Germany
- 3.3. France
- 3.4. Italy
- 3.5. Spain
- 3.6. Russia
- 3.7. Benelux
- 3.8. Nordics
- 3.9. Rest of Europe
-
4. Middle East & Africa
- 4.1. Turkey
- 4.2. Israel
- 4.3. GCC
- 4.4. North Africa
- 4.5. South Africa
- 4.6. Rest of Middle East & Africa
-
5. Asia Pacific
- 5.1. China
- 5.2. India
- 5.3. Japan
- 5.4. South Korea
- 5.5. ASEAN
- 5.6. Oceania
- 5.7. Rest of Asia Pacific
APAC Auto Logistics Industry Regional Market Share
Geographic Coverage of APAC Auto Logistics Industry
APAC Auto Logistics Industry REPORT HIGHLIGHTS
| Aspects | Details |
|---|---|
| Study Period | 2020-2034 |
| Base Year | 2025 |
| Estimated Year | 2026 |
| Forecast Period | 2026-2034 |
| Historical Period | 2020-2025 |
| Growth Rate | CAGR of > 6.50% from 2020-2034 |
| Segmentation |
|
Table of Contents
- 1. Introduction
- 1.1. Research Scope
- 1.2. Market Segmentation
- 1.3. Research Objective
- 1.4. Definitions and Assumptions
- 2. Executive Summary
- 2.1. Market Snapshot
- 3. Market Dynamics
- 3.1. Market Drivers
- 3.2. Market Restrains
- 3.3. Market Trends
- 3.4. Market Opportunities
- 4. Market Factor Analysis
- 4.1. Porters Five Forces
- 4.1.1. Bargaining Power of Suppliers
- 4.1.2. Bargaining Power of Buyers
- 4.1.3. Threat of New Entrants
- 4.1.4. Threat of Substitutes
- 4.1.5. Competitive Rivalry
- 4.2. PESTEL analysis
- 4.3. BCG Analysis
- 4.3.1. Stars (High Growth, High Market Share)
- 4.3.2. Cash Cows (Low Growth, High Market Share)
- 4.3.3. Question Mark (High Growth, Low Market Share)
- 4.3.4. Dogs (Low Growth, Low Market Share)
- 4.4. Ansoff Matrix Analysis
- 4.5. Supply Chain Analysis
- 4.6. Regulatory Landscape
- 4.7. Current Market Potential and Opportunity Assessment (TAM–SAM–SOM Framework)
- 4.8. IMR Analyst Note
- 4.1. Porters Five Forces
- 5. Market Analysis, Insights and Forecast 2021-2033
- 5.1. Market Analysis, Insights and Forecast - by Service
- 5.1.1. Transportation
- 5.1.2. Warehousing, Distribution and Inventory Management
- 5.1.3. Other Services
- 5.2. Market Analysis, Insights and Forecast - by Type
- 5.2.1. Finished Vehicle
- 5.2.2. Auto Components
- 5.2.3. Other types
- 5.3. Market Analysis, Insights and Forecast - by Region
- 5.3.1. North America
- 5.3.2. South America
- 5.3.3. Europe
- 5.3.4. Middle East & Africa
- 5.3.5. Asia Pacific
- 5.1. Market Analysis, Insights and Forecast - by Service
- 6. Global APAC Auto Logistics Industry Analysis, Insights and Forecast, 2021-2033
- 6.1. Market Analysis, Insights and Forecast - by Service
- 6.1.1. Transportation
- 6.1.2. Warehousing, Distribution and Inventory Management
- 6.1.3. Other Services
- 6.2. Market Analysis, Insights and Forecast - by Type
- 6.2.1. Finished Vehicle
- 6.2.2. Auto Components
- 6.2.3. Other types
- 6.1. Market Analysis, Insights and Forecast - by Service
- 7. North America APAC Auto Logistics Industry Analysis, Insights and Forecast, 2020-2032
- 7.1. Market Analysis, Insights and Forecast - by Service
- 7.1.1. Transportation
- 7.1.2. Warehousing, Distribution and Inventory Management
- 7.1.3. Other Services
- 7.2. Market Analysis, Insights and Forecast - by Type
- 7.2.1. Finished Vehicle
- 7.2.2. Auto Components
- 7.2.3. Other types
- 7.1. Market Analysis, Insights and Forecast - by Service
- 8. South America APAC Auto Logistics Industry Analysis, Insights and Forecast, 2020-2032
- 8.1. Market Analysis, Insights and Forecast - by Service
- 8.1.1. Transportation
- 8.1.2. Warehousing, Distribution and Inventory Management
- 8.1.3. Other Services
- 8.2. Market Analysis, Insights and Forecast - by Type
- 8.2.1. Finished Vehicle
- 8.2.2. Auto Components
- 8.2.3. Other types
- 8.1. Market Analysis, Insights and Forecast - by Service
- 9. Europe APAC Auto Logistics Industry Analysis, Insights and Forecast, 2020-2032
- 9.1. Market Analysis, Insights and Forecast - by Service
- 9.1.1. Transportation
- 9.1.2. Warehousing, Distribution and Inventory Management
- 9.1.3. Other Services
- 9.2. Market Analysis, Insights and Forecast - by Type
- 9.2.1. Finished Vehicle
- 9.2.2. Auto Components
- 9.2.3. Other types
- 9.1. Market Analysis, Insights and Forecast - by Service
- 10. Middle East & Africa APAC Auto Logistics Industry Analysis, Insights and Forecast, 2020-2032
- 10.1. Market Analysis, Insights and Forecast - by Service
- 10.1.1. Transportation
- 10.1.2. Warehousing, Distribution and Inventory Management
- 10.1.3. Other Services
- 10.2. Market Analysis, Insights and Forecast - by Type
- 10.2.1. Finished Vehicle
- 10.2.2. Auto Components
- 10.2.3. Other types
- 10.1. Market Analysis, Insights and Forecast - by Service
- 11. Asia Pacific APAC Auto Logistics Industry Analysis, Insights and Forecast, 2020-2032
- 11.1. Market Analysis, Insights and Forecast - by Service
- 11.1.1. Transportation
- 11.1.2. Warehousing, Distribution and Inventory Management
- 11.1.3. Other Services
- 11.2. Market Analysis, Insights and Forecast - by Type
- 11.2.1. Finished Vehicle
- 11.2.2. Auto Components
- 11.2.3. Other types
- 11.1. Market Analysis, Insights and Forecast - by Service
- 12. Competitive Analysis
- 12.1. Company Profiles
- 12.1.1 DB Schenker
- 12.1.1.1. Company Overview
- 12.1.1.2. Products
- 12.1.1.3. Company Financials
- 12.1.1.4. SWOT Analysis
- 12.1.2 Hitachi Transport System Ltd
- 12.1.2.1. Company Overview
- 12.1.2.2. Products
- 12.1.2.3. Company Financials
- 12.1.2.4. SWOT Analysis
- 12.1.3 CEVA Logistics AG
- 12.1.3.1. Company Overview
- 12.1.3.2. Products
- 12.1.3.3. Company Financials
- 12.1.3.4. SWOT Analysis
- 12.1.4 Neovia Logistics Services LLC
- 12.1.4.1. Company Overview
- 12.1.4.2. Products
- 12.1.4.3. Company Financials
- 12.1.4.4. SWOT Analysis
- 12.1.5 DHL
- 12.1.5.1. Company Overview
- 12.1.5.2. Products
- 12.1.5.3. Company Financials
- 12.1.5.4. SWOT Analysis
- 12.1.6 Yusen Logistics Co Ltd
- 12.1.6.1. Company Overview
- 12.1.6.2. Products
- 12.1.6.3. Company Financials
- 12.1.6.4. SWOT Analysis
- 12.1.7 GEODIS
- 12.1.7.1. Company Overview
- 12.1.7.2. Products
- 12.1.7.3. Company Financials
- 12.1.7.4. SWOT Analysis
- 12.1.8 Nippon Express Co Ltd
- 12.1.8.1. Company Overview
- 12.1.8.2. Products
- 12.1.8.3. Company Financials
- 12.1.8.4. SWOT Analysis
- 12.1.9 United Parcel Service Inc**List Not Exhaustive
- 12.1.9.1. Company Overview
- 12.1.9.2. Products
- 12.1.9.3. Company Financials
- 12.1.9.4. SWOT Analysis
- 12.1.10 XPO Logistics Inc
- 12.1.10.1. Company Overview
- 12.1.10.2. Products
- 12.1.10.3. Company Financials
- 12.1.10.4. SWOT Analysis
- 12.1.11 KUEHNE + NAGEL International AG
- 12.1.11.1. Company Overview
- 12.1.11.2. Products
- 12.1.11.3. Company Financials
- 12.1.11.4. SWOT Analysis
- 12.1.12 DSV
- 12.1.12.1. Company Overview
- 12.1.12.2. Products
- 12.1.12.3. Company Financials
- 12.1.12.4. SWOT Analysis
- 12.1.13 Ryder System Inc
- 12.1.13.1. Company Overview
- 12.1.13.2. Products
- 12.1.13.3. Company Financials
- 12.1.13.4. SWOT Analysis
- 12.1.1 DB Schenker
- 12.2. Market Entropy
- 12.2.1 Company's Key Areas Served
- 12.2.2 Recent Developments
- 12.3. Company Market Share Analysis 2025
- 12.3.1 Top 5 Companies Market Share Analysis
- 12.3.2 Top 3 Companies Market Share Analysis
- 12.4. List of Potential Customers
- 13. Research Methodology
List of Figures
- Figure 1: Global APAC Auto Logistics Industry Revenue Breakdown (Million, %) by Region 2025 & 2033
- Figure 2: North America APAC Auto Logistics Industry Revenue (Million), by Service 2025 & 2033
- Figure 3: North America APAC Auto Logistics Industry Revenue Share (%), by Service 2025 & 2033
- Figure 4: North America APAC Auto Logistics Industry Revenue (Million), by Type 2025 & 2033
- Figure 5: North America APAC Auto Logistics Industry Revenue Share (%), by Type 2025 & 2033
- Figure 6: North America APAC Auto Logistics Industry Revenue (Million), by Country 2025 & 2033
- Figure 7: North America APAC Auto Logistics Industry Revenue Share (%), by Country 2025 & 2033
- Figure 8: South America APAC Auto Logistics Industry Revenue (Million), by Service 2025 & 2033
- Figure 9: South America APAC Auto Logistics Industry Revenue Share (%), by Service 2025 & 2033
- Figure 10: South America APAC Auto Logistics Industry Revenue (Million), by Type 2025 & 2033
- Figure 11: South America APAC Auto Logistics Industry Revenue Share (%), by Type 2025 & 2033
- Figure 12: South America APAC Auto Logistics Industry Revenue (Million), by Country 2025 & 2033
- Figure 13: South America APAC Auto Logistics Industry Revenue Share (%), by Country 2025 & 2033
- Figure 14: Europe APAC Auto Logistics Industry Revenue (Million), by Service 2025 & 2033
- Figure 15: Europe APAC Auto Logistics Industry Revenue Share (%), by Service 2025 & 2033
- Figure 16: Europe APAC Auto Logistics Industry Revenue (Million), by Type 2025 & 2033
- Figure 17: Europe APAC Auto Logistics Industry Revenue Share (%), by Type 2025 & 2033
- Figure 18: Europe APAC Auto Logistics Industry Revenue (Million), by Country 2025 & 2033
- Figure 19: Europe APAC Auto Logistics Industry Revenue Share (%), by Country 2025 & 2033
- Figure 20: Middle East & Africa APAC Auto Logistics Industry Revenue (Million), by Service 2025 & 2033
- Figure 21: Middle East & Africa APAC Auto Logistics Industry Revenue Share (%), by Service 2025 & 2033
- Figure 22: Middle East & Africa APAC Auto Logistics Industry Revenue (Million), by Type 2025 & 2033
- Figure 23: Middle East & Africa APAC Auto Logistics Industry Revenue Share (%), by Type 2025 & 2033
- Figure 24: Middle East & Africa APAC Auto Logistics Industry Revenue (Million), by Country 2025 & 2033
- Figure 25: Middle East & Africa APAC Auto Logistics Industry Revenue Share (%), by Country 2025 & 2033
- Figure 26: Asia Pacific APAC Auto Logistics Industry Revenue (Million), by Service 2025 & 2033
- Figure 27: Asia Pacific APAC Auto Logistics Industry Revenue Share (%), by Service 2025 & 2033
- Figure 28: Asia Pacific APAC Auto Logistics Industry Revenue (Million), by Type 2025 & 2033
- Figure 29: Asia Pacific APAC Auto Logistics Industry Revenue Share (%), by Type 2025 & 2033
- Figure 30: Asia Pacific APAC Auto Logistics Industry Revenue (Million), by Country 2025 & 2033
- Figure 31: Asia Pacific APAC Auto Logistics Industry Revenue Share (%), by Country 2025 & 2033
List of Tables
- Table 1: Global APAC Auto Logistics Industry Revenue Million Forecast, by Service 2020 & 2033
- Table 2: Global APAC Auto Logistics Industry Revenue Million Forecast, by Type 2020 & 2033
- Table 3: Global APAC Auto Logistics Industry Revenue Million Forecast, by Region 2020 & 2033
- Table 4: Global APAC Auto Logistics Industry Revenue Million Forecast, by Service 2020 & 2033
- Table 5: Global APAC Auto Logistics Industry Revenue Million Forecast, by Type 2020 & 2033
- Table 6: Global APAC Auto Logistics Industry Revenue Million Forecast, by Country 2020 & 2033
- Table 7: United States APAC Auto Logistics Industry Revenue (Million) Forecast, by Application 2020 & 2033
- Table 8: Canada APAC Auto Logistics Industry Revenue (Million) Forecast, by Application 2020 & 2033
- Table 9: Mexico APAC Auto Logistics Industry Revenue (Million) Forecast, by Application 2020 & 2033
- Table 10: Global APAC Auto Logistics Industry Revenue Million Forecast, by Service 2020 & 2033
- Table 11: Global APAC Auto Logistics Industry Revenue Million Forecast, by Type 2020 & 2033
- Table 12: Global APAC Auto Logistics Industry Revenue Million Forecast, by Country 2020 & 2033
- Table 13: Brazil APAC Auto Logistics Industry Revenue (Million) Forecast, by Application 2020 & 2033
- Table 14: Argentina APAC Auto Logistics Industry Revenue (Million) Forecast, by Application 2020 & 2033
- Table 15: Rest of South America APAC Auto Logistics Industry Revenue (Million) Forecast, by Application 2020 & 2033
- Table 16: Global APAC Auto Logistics Industry Revenue Million Forecast, by Service 2020 & 2033
- Table 17: Global APAC Auto Logistics Industry Revenue Million Forecast, by Type 2020 & 2033
- Table 18: Global APAC Auto Logistics Industry Revenue Million Forecast, by Country 2020 & 2033
- Table 19: United Kingdom APAC Auto Logistics Industry Revenue (Million) Forecast, by Application 2020 & 2033
- Table 20: Germany APAC Auto Logistics Industry Revenue (Million) Forecast, by Application 2020 & 2033
- Table 21: France APAC Auto Logistics Industry Revenue (Million) Forecast, by Application 2020 & 2033
- Table 22: Italy APAC Auto Logistics Industry Revenue (Million) Forecast, by Application 2020 & 2033
- Table 23: Spain APAC Auto Logistics Industry Revenue (Million) Forecast, by Application 2020 & 2033
- Table 24: Russia APAC Auto Logistics Industry Revenue (Million) Forecast, by Application 2020 & 2033
- Table 25: Benelux APAC Auto Logistics Industry Revenue (Million) Forecast, by Application 2020 & 2033
- Table 26: Nordics APAC Auto Logistics Industry Revenue (Million) Forecast, by Application 2020 & 2033
- Table 27: Rest of Europe APAC Auto Logistics Industry Revenue (Million) Forecast, by Application 2020 & 2033
- Table 28: Global APAC Auto Logistics Industry Revenue Million Forecast, by Service 2020 & 2033
- Table 29: Global APAC Auto Logistics Industry Revenue Million Forecast, by Type 2020 & 2033
- Table 30: Global APAC Auto Logistics Industry Revenue Million Forecast, by Country 2020 & 2033
- Table 31: Turkey APAC Auto Logistics Industry Revenue (Million) Forecast, by Application 2020 & 2033
- Table 32: Israel APAC Auto Logistics Industry Revenue (Million) Forecast, by Application 2020 & 2033
- Table 33: GCC APAC Auto Logistics Industry Revenue (Million) Forecast, by Application 2020 & 2033
- Table 34: North Africa APAC Auto Logistics Industry Revenue (Million) Forecast, by Application 2020 & 2033
- Table 35: South Africa APAC Auto Logistics Industry Revenue (Million) Forecast, by Application 2020 & 2033
- Table 36: Rest of Middle East & Africa APAC Auto Logistics Industry Revenue (Million) Forecast, by Application 2020 & 2033
- Table 37: Global APAC Auto Logistics Industry Revenue Million Forecast, by Service 2020 & 2033
- Table 38: Global APAC Auto Logistics Industry Revenue Million Forecast, by Type 2020 & 2033
- Table 39: Global APAC Auto Logistics Industry Revenue Million Forecast, by Country 2020 & 2033
- Table 40: China APAC Auto Logistics Industry Revenue (Million) Forecast, by Application 2020 & 2033
- Table 41: India APAC Auto Logistics Industry Revenue (Million) Forecast, by Application 2020 & 2033
- Table 42: Japan APAC Auto Logistics Industry Revenue (Million) Forecast, by Application 2020 & 2033
- Table 43: South Korea APAC Auto Logistics Industry Revenue (Million) Forecast, by Application 2020 & 2033
- Table 44: ASEAN APAC Auto Logistics Industry Revenue (Million) Forecast, by Application 2020 & 2033
- Table 45: Oceania APAC Auto Logistics Industry Revenue (Million) Forecast, by Application 2020 & 2033
- Table 46: Rest of Asia Pacific APAC Auto Logistics Industry Revenue (Million) Forecast, by Application 2020 & 2033
Frequently Asked Questions
1. What is the projected Compound Annual Growth Rate (CAGR) of the APAC Auto Logistics Industry?
The projected CAGR is approximately > 6.50%.
2. Which companies are prominent players in the APAC Auto Logistics Industry?
Key companies in the market include DB Schenker, Hitachi Transport System Ltd, CEVA Logistics AG, Neovia Logistics Services LLC, DHL, Yusen Logistics Co Ltd, GEODIS, Nippon Express Co Ltd, United Parcel Service Inc**List Not Exhaustive, XPO Logistics Inc, KUEHNE + NAGEL International AG, DSV, Ryder System Inc.
3. What are the main segments of the APAC Auto Logistics Industry?
The market segments include Service, Type.
4. Can you provide details about the market size?
The market size is estimated to be USD 289.04 Million as of 2022.
5. What are some drivers contributing to market growth?
Rising Number of Partnerships among Automobile Manufacturers and Logistics Partners; Growth in international trade.
6. What are the notable trends driving market growth?
Demand for Electric Vehicles are increasing in the region.
7. Are there any restraints impacting market growth?
Nature of Supply Chain Business.
8. Can you provide examples of recent developments in the market?
March 2023: Tata Motors, One of India’s leading automobile manufacturers and the pioneer of India’s EV evolution, received an order for providing 1000 XPRES-T EVs to OHM E Logistics Pvt. Ltd. in Hyderabad for their electric cab transportation services. These cars will be delivered to OHM E Logistics in a phased manner.
9. What pricing options are available for accessing the report?
Pricing options include single-user, multi-user, and enterprise licenses priced at USD 4750, USD 4950, and USD 6800 respectively.
10. Is the market size provided in terms of value or volume?
The market size is provided in terms of value, measured in Million.
11. Are there any specific market keywords associated with the report?
Yes, the market keyword associated with the report is "APAC Auto Logistics Industry," which aids in identifying and referencing the specific market segment covered.
12. How do I determine which pricing option suits my needs best?
The pricing options vary based on user requirements and access needs. Individual users may opt for single-user licenses, while businesses requiring broader access may choose multi-user or enterprise licenses for cost-effective access to the report.
13. Are there any additional resources or data provided in the APAC Auto Logistics Industry report?
While the report offers comprehensive insights, it's advisable to review the specific contents or supplementary materials provided to ascertain if additional resources or data are available.
14. How can I stay updated on further developments or reports in the APAC Auto Logistics Industry?
To stay informed about further developments, trends, and reports in the APAC Auto Logistics Industry, consider subscribing to industry newsletters, following relevant companies and organizations, or regularly checking reputable industry news sources and publications.
Methodology
Step 1 - Identification of Relevant Samples Size from Population Database


Step 2 - Approaches for Defining Global Market Size (Value, Volume* & Price*)

Note*: In applicable scenarios
Step 3 - Data Sources
Primary Research
- Web Analytics
- Survey Reports
- Research Institute
- Latest Research Reports
- Opinion Leaders
Secondary Research
- Annual Reports
- White Paper
- Latest Press Release
- Industry Association
- Paid Database
- Investor Presentations

Step 4 - Data Triangulation
Involves using different sources of information in order to increase the validity of a study
These sources are likely to be stakeholders in a program - participants, other researchers, program staff, other community members, and so on.
Then we put all data in single framework & apply various statistical tools to find out the dynamic on the market.
During the analysis stage, feedback from the stakeholder groups would be compared to determine areas of agreement as well as areas of divergence