

Key Insights
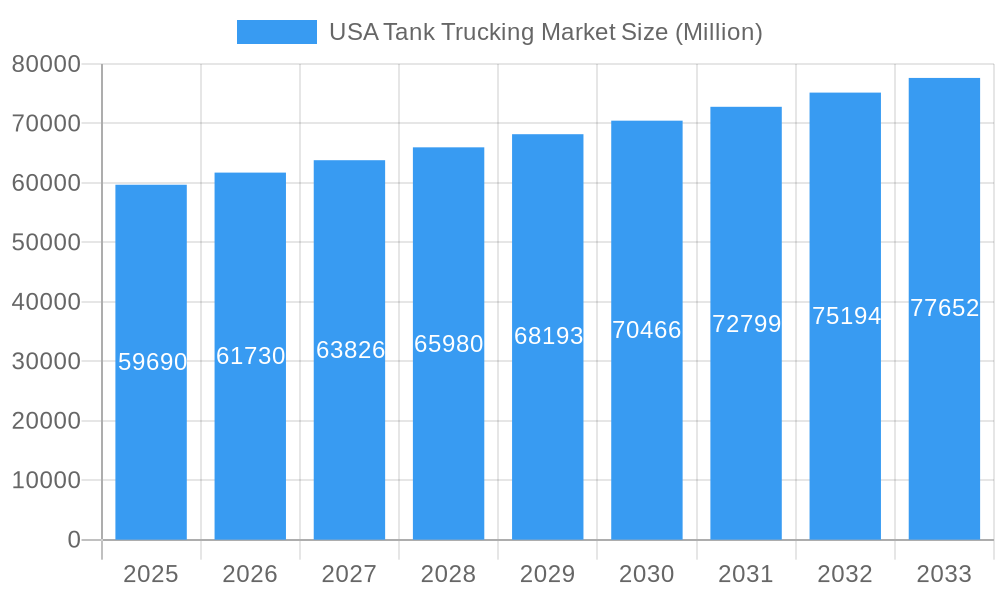
The US tank trucking market, valued at $59.69 billion in 2025, is projected to experience steady growth, driven primarily by the expanding chemical, food and beverage, and petroleum industries. The increasing demand for efficient transportation of bulk liquids across diverse sectors fuels this expansion. The market is segmented by fleet type (for-hire and private), capacity (light, medium, and heavy-duty), and product category (crude petroleum, petroleum products, chemicals, food and beverages, fertilizers, and others). The for-hire segment is expected to dominate, reflecting the growing preference for outsourced logistics solutions among businesses. Heavy-duty trucks will likely hold the largest share of the capacity segment due to their ability to transport large volumes efficiently. Growth will be further influenced by technological advancements such as telematics and driver assistance systems improving operational efficiency and safety. However, challenges such as driver shortages, stringent environmental regulations, and fluctuating fuel prices are expected to moderate growth. Regional variations exist, with the Southeast and Midwest potentially showing stronger growth due to robust manufacturing and agricultural activity. Major players like Trimac Transportation, Foodliner/Quest Liner, and others are vying for market share through strategic expansions, acquisitions, and technological innovations. The competitive landscape is characterized by both large national players and smaller regional operators.
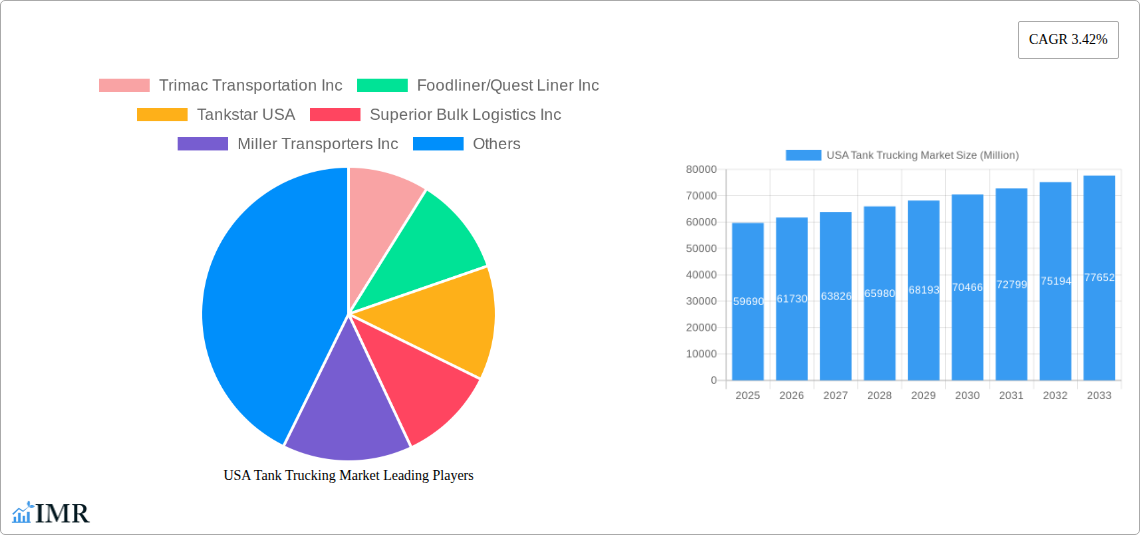
USA Tank Trucking Market Market Size (In Billion)
The forecast period from 2025 to 2033 anticipates a continued expansion of the US tank trucking market, albeit at a moderate pace. This growth will be underpinned by the aforementioned industry drivers but will also be subject to ongoing economic conditions. The market's resilience hinges on the ability of companies to adapt to changing regulatory landscapes and address persistent industry challenges like driver retention and fuel costs. Innovation and efficiency gains will become increasingly crucial for competitiveness. As the US economy evolves, the demand for efficient liquid bulk transportation will remain a critical factor determining market size and growth trajectory, with regional differences reflective of economic disparities and industry concentration across states.
USA Tank Trucking Market Company Market Share
USA Tank Trucking Market: A Comprehensive Report (2019-2033)
This comprehensive report provides an in-depth analysis of the USA Tank Trucking Market, encompassing market size, growth trends, competitive landscape, and future outlook. The study covers the period from 2019 to 2033, with 2025 serving as the base year and estimated year. Key segments analyzed include fleet type (for-hire, private), capacity (light, medium, heavy duty), and product category (crude petroleum, petroleum products, chemicals, food & beverages, fertilizers, others). The report features prominent players such as Trimac Transportation Inc, Foodliner/Quest Liner Inc, Tankstar USA, and many more, offering crucial insights for industry professionals, investors, and strategic decision-makers. The market is valued at xx Million in 2025 and is projected to reach xx Million by 2033.
USA Tank Trucking Market Market Dynamics & Structure
The US Tank Trucking market is a fragmented yet consolidating industry, characterized by a mix of large national carriers and smaller regional players. Market concentration is moderate, with the top 5 players holding an estimated xx% market share in 2025. Technological innovation, particularly in telematics, route optimization software, and fuel-efficient vehicles, is a key driver of efficiency and cost reduction. Stringent government regulations concerning safety, emissions, and driver hours significantly impact operational costs and strategies. Competitive pressures from alternative transportation modes (rail, pipelines) and the increasing adoption of intermodal transport present ongoing challenges. The market also witnesses frequent mergers and acquisitions (M&A) activity, reflecting consolidation trends and a quest for economies of scale. In 2024, M&A activity reached xx deals, a xx% increase compared to 2023.
- Market Concentration: Moderately fragmented, top 5 players holding approximately xx% market share (2025).
- Technological Innovation: Telematics, route optimization, fuel-efficient vehicles driving efficiency.
- Regulatory Framework: Stringent safety, emissions, and driver hour regulations impacting costs.
- Competitive Substitutes: Rail, pipelines, and intermodal transport posing competitive pressures.
- M&A Trends: Consolidation through acquisitions; xx deals in 2024, indicating a xx% increase from 2023.
- End-User Demographics: Diverse, spanning various industries including energy, chemicals, food & beverage, and agriculture.
USA Tank Trucking Market Growth Trends & Insights
The USA Tank Trucking market experienced a CAGR of xx% during the historical period (2019-2024), driven by robust economic growth and increased demand across various sectors. Adoption of advanced technologies like telematics and GPS tracking systems is improving efficiency and reducing operational costs, leading to market expansion. However, fluctuating fuel prices, driver shortages, and stringent regulations pose challenges to consistent growth. Consumer behavior shifts towards just-in-time delivery and enhanced supply chain transparency further influence market dynamics. The market is expected to maintain a steady growth trajectory, with a projected CAGR of xx% during the forecast period (2025-2033), reaching a market value of xx Million by 2033. Increased investments in infrastructure and the growing adoption of sustainable transportation solutions are expected to further stimulate market growth. This section leverages detailed market data and analysis to provide a more comprehensive view.
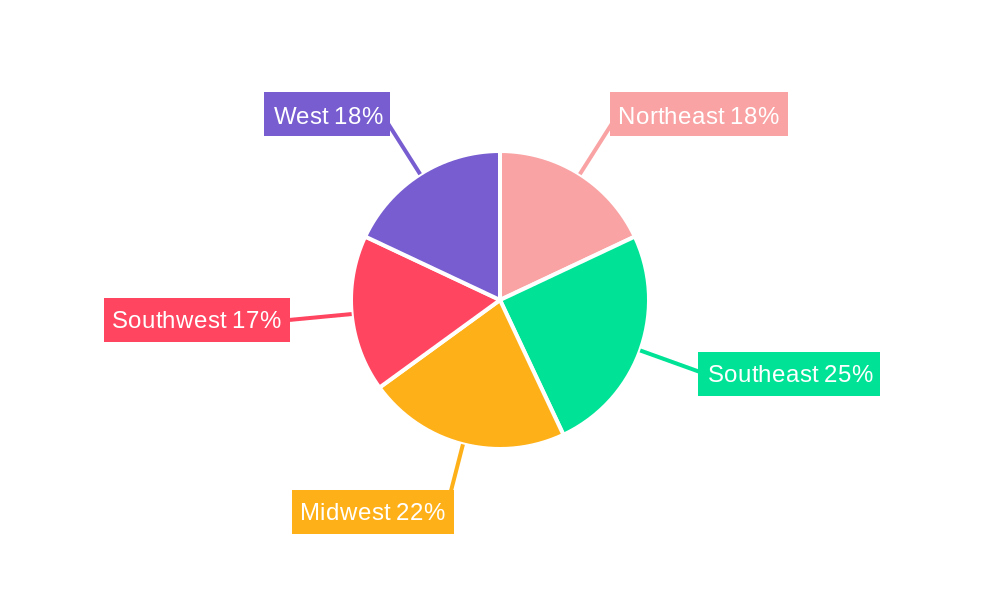
Dominant Regions, Countries, or Segments in USA Tank Trucking Market
The dominant segment in the USA Tank Trucking market is the Heavy Duty category within the capacity segment, accounting for approximately xx% of the market in 2025, reflecting the high demand for transporting large volumes of goods. Within fleet type, the For-hire segment holds a larger market share (xx%) compared to the private segment. Geographically, the Southeastern and South Central regions demonstrate robust growth, driven by strong industrial activity and burgeoning energy sectors. The Crude Petroleum and Petroleum Products category under product type dominates the market due to high demand in the energy sector.
- Key Drivers: Strong industrial activity, significant energy sector presence in specific regions, and high demand for bulk transportation.
- Dominant Segments: Heavy-duty capacity (xx% market share in 2025), For-hire fleet type (xx% market share in 2025), Crude Petroleum and Petroleum Products.
- Growth Potential: High growth potential in regions with robust infrastructural development and emerging industries.
USA Tank Trucking Market Product Landscape
The product landscape is characterized by a wide range of specialized tank trailers designed to transport various goods safely and efficiently. Innovations focus on enhanced safety features, improved fuel efficiency, and advanced tracking and monitoring systems. Technological advancements, such as the integration of telematics and IoT (Internet of Things) devices, are becoming increasingly common, providing real-time data on location, temperature, and other critical parameters. The development of specialized tankers for specific materials like cryogenic liquids and hazardous chemicals continues to shape the market.
Key Drivers, Barriers & Challenges in USA Tank Trucking Market
Key Drivers: Growing demand for efficient logistics across various sectors, increasing investments in infrastructure, and technological advancements in vehicle design and tracking systems. The expanding e-commerce sector further fuels the demand for efficient delivery solutions, contributing significantly to the market's growth.
Challenges: Driver shortages remain a significant constraint, impacting operational efficiency and increasing labor costs. Fluctuating fuel prices and stringent emission regulations add to operational costs. Intense competition from other modes of transportation and increasing regulatory hurdles also pose challenges. These factors collectively result in reduced profitability and operational complexities for businesses in the industry. Driver shortage costs the industry an estimated xx Million annually in 2025.
Emerging Opportunities in USA Tank Trucking Market
Emerging trends include the increasing adoption of electric and alternative fuel vehicles, focusing on sustainability and reduced carbon emissions. The growing demand for specialized transportation services catering to niche industries like pharmaceuticals and food-grade products offers significant opportunities. Advancements in predictive maintenance and route optimization technologies present opportunities for enhanced efficiency and reduced downtime. Expansion into underserved regions and leveraging technology to streamline operations and improve supply chain transparency also represent promising avenues.
Growth Accelerators in the USA Tank Trucking Market Industry
Long-term growth is fueled by the continuous development and adoption of advanced technologies, including autonomous driving and improved fleet management systems. Strategic partnerships with technology companies and logistics providers enhance operational efficiency and expand service offerings. The ongoing expansion of e-commerce and increasing cross-border trade drive the demand for efficient and reliable transportation services. Investments in infrastructure development and government initiatives promoting sustainable transportation further accelerate market growth.
Key Players Shaping the USA Tank Trucking Market Market
- Trimac Transportation Inc
- Foodliner/Quest Liner Inc
- Tankstar USA
- Superior Bulk Logistics Inc
- Miller Transporters Inc
- Groendyke Transport Inc
- Martin Transport Inc
- Florida Rock & Tank Lines Inc
- Slay Transportation Co Inc
- Apex Logistics LLC
- Mission Petroleum Carriers
- Genox Transportation Inc
- J&M Tank Lines Inc
- CLI Transport LP
- Tidewater Transit Co Inc
- Herman R Ewell Inc
- Service Transport Company
- Schilli Bulk Carriers Group
- Andrews Logistics
- CTL Transportation LLC
- Eagle Transport Corp
- Ruan Transportation Management Systems
- Kenan Advantage Group
- Dupre Logistics LLC
Notable Milestones in USA Tank Trucking Market Sector
- April 2023: Trimac Transportation acquired AIP Logistics, expanding its bulk terminal services and warehousing capabilities. This added 13 tractors, 119 trailers, and a 52-acre facility to its operations.
- February 2024: Kenan Advantage Group acquired Northern Dry Bulk, strengthening its position in plastic resin transportation and storage. This acquisition included 36 tractors, 91 trailers, and two terminals.
In-Depth USA Tank Trucking Market Market Outlook
The future of the USA Tank Trucking market appears promising, driven by the confluence of technological advancements, evolving consumer demands, and infrastructure improvements. Strategic opportunities lie in embracing sustainable transportation solutions, leveraging data analytics for improved efficiency, and expanding into niche markets. The continued focus on enhancing safety standards and optimizing supply chain processes will shape the industry’s trajectory in the coming years. The market's robust growth potential is poised to attract further investments and innovation, leading to a more efficient and sustainable transportation sector.
USA Tank Trucking Market Segmentation
-
1. Fleet Type
- 1.1. For-hire
- 1.2. Private
-
2. Capacity
- 2.1. Light Duty
- 2.2. Medium Duty
- 2.3. Heavy Duty
-
3. Product Category
- 3.1. Crude Petroleum
- 3.2. Petroleu
- 3.3. Chemicals
- 3.4. Food and Beverages
- 3.5. Fertilizers
- 3.6. Other Product Categories
USA Tank Trucking Market Segmentation By Geography
-
1. North America
- 1.1. United States
- 1.2. Canada
- 1.3. Mexico
-
2. South America
- 2.1. Brazil
- 2.2. Argentina
- 2.3. Rest of South America
-
3. Europe
- 3.1. United Kingdom
- 3.2. Germany
- 3.3. France
- 3.4. Italy
- 3.5. Spain
- 3.6. Russia
- 3.7. Benelux
- 3.8. Nordics
- 3.9. Rest of Europe
-
4. Middle East & Africa
- 4.1. Turkey
- 4.2. Israel
- 4.3. GCC
- 4.4. North Africa
- 4.5. South Africa
- 4.6. Rest of Middle East & Africa
-
5. Asia Pacific
- 5.1. China
- 5.2. India
- 5.3. Japan
- 5.4. South Korea
- 5.5. ASEAN
- 5.6. Oceania
- 5.7. Rest of Asia Pacific
USA Tank Trucking Market Regional Market Share
Geographic Coverage of USA Tank Trucking Market
USA Tank Trucking Market REPORT HIGHLIGHTS
| Aspects | Details |
|---|---|
| Study Period | 2020-2034 |
| Base Year | 2025 |
| Estimated Year | 2026 |
| Forecast Period | 2026-2034 |
| Historical Period | 2020-2025 |
| Growth Rate | CAGR of 3.42% from 2020-2034 |
| Segmentation |
|
Table of Contents
- 1. Introduction
- 1.1. Research Scope
- 1.2. Market Segmentation
- 1.3. Research Objective
- 1.4. Definitions and Assumptions
- 2. Executive Summary
- 2.1. Market Snapshot
- 3. Market Dynamics
- 3.1. Market Drivers
- 3.2. Market Restrains
- 3.3. Market Trends
- 3.4. Market Opportunities
- 4. Market Factor Analysis
- 4.1. Porters Five Forces
- 4.1.1. Bargaining Power of Suppliers
- 4.1.2. Bargaining Power of Buyers
- 4.1.3. Threat of New Entrants
- 4.1.4. Threat of Substitutes
- 4.1.5. Competitive Rivalry
- 4.2. PESTEL analysis
- 4.3. BCG Analysis
- 4.3.1. Stars (High Growth, High Market Share)
- 4.3.2. Cash Cows (Low Growth, High Market Share)
- 4.3.3. Question Mark (High Growth, Low Market Share)
- 4.3.4. Dogs (Low Growth, Low Market Share)
- 4.4. Ansoff Matrix Analysis
- 4.5. Supply Chain Analysis
- 4.6. Regulatory Landscape
- 4.7. Current Market Potential and Opportunity Assessment (TAM–SAM–SOM Framework)
- 4.8. IMR Analyst Note
- 4.1. Porters Five Forces
- 5. Market Analysis, Insights and Forecast 2021-2033
- 5.1. Market Analysis, Insights and Forecast - by Fleet Type
- 5.1.1. For-hire
- 5.1.2. Private
- 5.2. Market Analysis, Insights and Forecast - by Capacity
- 5.2.1. Light Duty
- 5.2.2. Medium Duty
- 5.2.3. Heavy Duty
- 5.3. Market Analysis, Insights and Forecast - by Product Category
- 5.3.1. Crude Petroleum
- 5.3.2. Petroleu
- 5.3.3. Chemicals
- 5.3.4. Food and Beverages
- 5.3.5. Fertilizers
- 5.3.6. Other Product Categories
- 5.4. Market Analysis, Insights and Forecast - by Region
- 5.4.1. North America
- 5.4.2. South America
- 5.4.3. Europe
- 5.4.4. Middle East & Africa
- 5.4.5. Asia Pacific
- 5.1. Market Analysis, Insights and Forecast - by Fleet Type
- 6. Global USA Tank Trucking Market Analysis, Insights and Forecast, 2021-2033
- 6.1. Market Analysis, Insights and Forecast - by Fleet Type
- 6.1.1. For-hire
- 6.1.2. Private
- 6.2. Market Analysis, Insights and Forecast - by Capacity
- 6.2.1. Light Duty
- 6.2.2. Medium Duty
- 6.2.3. Heavy Duty
- 6.3. Market Analysis, Insights and Forecast - by Product Category
- 6.3.1. Crude Petroleum
- 6.3.2. Petroleu
- 6.3.3. Chemicals
- 6.3.4. Food and Beverages
- 6.3.5. Fertilizers
- 6.3.6. Other Product Categories
- 6.1. Market Analysis, Insights and Forecast - by Fleet Type
- 7. North America USA Tank Trucking Market Analysis, Insights and Forecast, 2020-2032
- 7.1. Market Analysis, Insights and Forecast - by Fleet Type
- 7.1.1. For-hire
- 7.1.2. Private
- 7.2. Market Analysis, Insights and Forecast - by Capacity
- 7.2.1. Light Duty
- 7.2.2. Medium Duty
- 7.2.3. Heavy Duty
- 7.3. Market Analysis, Insights and Forecast - by Product Category
- 7.3.1. Crude Petroleum
- 7.3.2. Petroleu
- 7.3.3. Chemicals
- 7.3.4. Food and Beverages
- 7.3.5. Fertilizers
- 7.3.6. Other Product Categories
- 7.1. Market Analysis, Insights and Forecast - by Fleet Type
- 8. South America USA Tank Trucking Market Analysis, Insights and Forecast, 2020-2032
- 8.1. Market Analysis, Insights and Forecast - by Fleet Type
- 8.1.1. For-hire
- 8.1.2. Private
- 8.2. Market Analysis, Insights and Forecast - by Capacity
- 8.2.1. Light Duty
- 8.2.2. Medium Duty
- 8.2.3. Heavy Duty
- 8.3. Market Analysis, Insights and Forecast - by Product Category
- 8.3.1. Crude Petroleum
- 8.3.2. Petroleu
- 8.3.3. Chemicals
- 8.3.4. Food and Beverages
- 8.3.5. Fertilizers
- 8.3.6. Other Product Categories
- 8.1. Market Analysis, Insights and Forecast - by Fleet Type
- 9. Europe USA Tank Trucking Market Analysis, Insights and Forecast, 2020-2032
- 9.1. Market Analysis, Insights and Forecast - by Fleet Type
- 9.1.1. For-hire
- 9.1.2. Private
- 9.2. Market Analysis, Insights and Forecast - by Capacity
- 9.2.1. Light Duty
- 9.2.2. Medium Duty
- 9.2.3. Heavy Duty
- 9.3. Market Analysis, Insights and Forecast - by Product Category
- 9.3.1. Crude Petroleum
- 9.3.2. Petroleu
- 9.3.3. Chemicals
- 9.3.4. Food and Beverages
- 9.3.5. Fertilizers
- 9.3.6. Other Product Categories
- 9.1. Market Analysis, Insights and Forecast - by Fleet Type
- 10. Middle East & Africa USA Tank Trucking Market Analysis, Insights and Forecast, 2020-2032
- 10.1. Market Analysis, Insights and Forecast - by Fleet Type
- 10.1.1. For-hire
- 10.1.2. Private
- 10.2. Market Analysis, Insights and Forecast - by Capacity
- 10.2.1. Light Duty
- 10.2.2. Medium Duty
- 10.2.3. Heavy Duty
- 10.3. Market Analysis, Insights and Forecast - by Product Category
- 10.3.1. Crude Petroleum
- 10.3.2. Petroleu
- 10.3.3. Chemicals
- 10.3.4. Food and Beverages
- 10.3.5. Fertilizers
- 10.3.6. Other Product Categories
- 10.1. Market Analysis, Insights and Forecast - by Fleet Type
- 11. Asia Pacific USA Tank Trucking Market Analysis, Insights and Forecast, 2020-2032
- 11.1. Market Analysis, Insights and Forecast - by Fleet Type
- 11.1.1. For-hire
- 11.1.2. Private
- 11.2. Market Analysis, Insights and Forecast - by Capacity
- 11.2.1. Light Duty
- 11.2.2. Medium Duty
- 11.2.3. Heavy Duty
- 11.3. Market Analysis, Insights and Forecast - by Product Category
- 11.3.1. Crude Petroleum
- 11.3.2. Petroleu
- 11.3.3. Chemicals
- 11.3.4. Food and Beverages
- 11.3.5. Fertilizers
- 11.3.6. Other Product Categories
- 11.1. Market Analysis, Insights and Forecast - by Fleet Type
- 12. Competitive Analysis
- 12.1. Company Profiles
- 12.1.1 Trimac Transportation Inc
- 12.1.1.1. Company Overview
- 12.1.1.2. Products
- 12.1.1.3. Company Financials
- 12.1.1.4. SWOT Analysis
- 12.1.2 Foodliner/Quest Liner Inc
- 12.1.2.1. Company Overview
- 12.1.2.2. Products
- 12.1.2.3. Company Financials
- 12.1.2.4. SWOT Analysis
- 12.1.3 Tankstar USA
- 12.1.3.1. Company Overview
- 12.1.3.2. Products
- 12.1.3.3. Company Financials
- 12.1.3.4. SWOT Analysis
- 12.1.4 Superior Bulk Logistics Inc
- 12.1.4.1. Company Overview
- 12.1.4.2. Products
- 12.1.4.3. Company Financials
- 12.1.4.4. SWOT Analysis
- 12.1.5 Miller Transporters Inc
- 12.1.5.1. Company Overview
- 12.1.5.2. Products
- 12.1.5.3. Company Financials
- 12.1.5.4. SWOT Analysis
- 12.1.6 Groendyke Transport Inc
- 12.1.6.1. Company Overview
- 12.1.6.2. Products
- 12.1.6.3. Company Financials
- 12.1.6.4. SWOT Analysis
- 12.1.7 Martin Transport Inc
- 12.1.7.1. Company Overview
- 12.1.7.2. Products
- 12.1.7.3. Company Financials
- 12.1.7.4. SWOT Analysis
- 12.1.8 Florida Rock & Tank Lines Inc **List Not Exhaustive 7 3 Other Companies (Slay Transportation Co Inc Apex Logistics LLC Mission Petroleum Carriers Genox Transportation Inc J&M Tank Lines Inc CLI Transport LP Tidewater Transit Co Inc Herman R Ewell Inc Service Transport Company Schilli Bulk Carriers Group Andrews Logistics and CTL Transportation LLC
- 12.1.8.1. Company Overview
- 12.1.8.2. Products
- 12.1.8.3. Company Financials
- 12.1.8.4. SWOT Analysis
- 12.1.9 Eagle Transport Corp
- 12.1.9.1. Company Overview
- 12.1.9.2. Products
- 12.1.9.3. Company Financials
- 12.1.9.4. SWOT Analysis
- 12.1.10 Ruan Transportation Management Systems
- 12.1.10.1. Company Overview
- 12.1.10.2. Products
- 12.1.10.3. Company Financials
- 12.1.10.4. SWOT Analysis
- 12.1.11 Kenan Advantage Group
- 12.1.11.1. Company Overview
- 12.1.11.2. Products
- 12.1.11.3. Company Financials
- 12.1.11.4. SWOT Analysis
- 12.1.12 Dupre Logistics LLC
- 12.1.12.1. Company Overview
- 12.1.12.2. Products
- 12.1.12.3. Company Financials
- 12.1.12.4. SWOT Analysis
- 12.1.1 Trimac Transportation Inc
- 12.2. Market Entropy
- 12.2.1 Company's Key Areas Served
- 12.2.2 Recent Developments
- 12.3. Company Market Share Analysis 2025
- 12.3.1 Top 5 Companies Market Share Analysis
- 12.3.2 Top 3 Companies Market Share Analysis
- 12.4. List of Potential Customers
- 13. Research Methodology
List of Figures
- Figure 1: Global USA Tank Trucking Market Revenue Breakdown (Million, %) by Region 2025 & 2033
- Figure 2: North America USA Tank Trucking Market Revenue (Million), by Fleet Type 2025 & 2033
- Figure 3: North America USA Tank Trucking Market Revenue Share (%), by Fleet Type 2025 & 2033
- Figure 4: North America USA Tank Trucking Market Revenue (Million), by Capacity 2025 & 2033
- Figure 5: North America USA Tank Trucking Market Revenue Share (%), by Capacity 2025 & 2033
- Figure 6: North America USA Tank Trucking Market Revenue (Million), by Product Category 2025 & 2033
- Figure 7: North America USA Tank Trucking Market Revenue Share (%), by Product Category 2025 & 2033
- Figure 8: North America USA Tank Trucking Market Revenue (Million), by Country 2025 & 2033
- Figure 9: North America USA Tank Trucking Market Revenue Share (%), by Country 2025 & 2033
- Figure 10: South America USA Tank Trucking Market Revenue (Million), by Fleet Type 2025 & 2033
- Figure 11: South America USA Tank Trucking Market Revenue Share (%), by Fleet Type 2025 & 2033
- Figure 12: South America USA Tank Trucking Market Revenue (Million), by Capacity 2025 & 2033
- Figure 13: South America USA Tank Trucking Market Revenue Share (%), by Capacity 2025 & 2033
- Figure 14: South America USA Tank Trucking Market Revenue (Million), by Product Category 2025 & 2033
- Figure 15: South America USA Tank Trucking Market Revenue Share (%), by Product Category 2025 & 2033
- Figure 16: South America USA Tank Trucking Market Revenue (Million), by Country 2025 & 2033
- Figure 17: South America USA Tank Trucking Market Revenue Share (%), by Country 2025 & 2033
- Figure 18: Europe USA Tank Trucking Market Revenue (Million), by Fleet Type 2025 & 2033
- Figure 19: Europe USA Tank Trucking Market Revenue Share (%), by Fleet Type 2025 & 2033
- Figure 20: Europe USA Tank Trucking Market Revenue (Million), by Capacity 2025 & 2033
- Figure 21: Europe USA Tank Trucking Market Revenue Share (%), by Capacity 2025 & 2033
- Figure 22: Europe USA Tank Trucking Market Revenue (Million), by Product Category 2025 & 2033
- Figure 23: Europe USA Tank Trucking Market Revenue Share (%), by Product Category 2025 & 2033
- Figure 24: Europe USA Tank Trucking Market Revenue (Million), by Country 2025 & 2033
- Figure 25: Europe USA Tank Trucking Market Revenue Share (%), by Country 2025 & 2033
- Figure 26: Middle East & Africa USA Tank Trucking Market Revenue (Million), by Fleet Type 2025 & 2033
- Figure 27: Middle East & Africa USA Tank Trucking Market Revenue Share (%), by Fleet Type 2025 & 2033
- Figure 28: Middle East & Africa USA Tank Trucking Market Revenue (Million), by Capacity 2025 & 2033
- Figure 29: Middle East & Africa USA Tank Trucking Market Revenue Share (%), by Capacity 2025 & 2033
- Figure 30: Middle East & Africa USA Tank Trucking Market Revenue (Million), by Product Category 2025 & 2033
- Figure 31: Middle East & Africa USA Tank Trucking Market Revenue Share (%), by Product Category 2025 & 2033
- Figure 32: Middle East & Africa USA Tank Trucking Market Revenue (Million), by Country 2025 & 2033
- Figure 33: Middle East & Africa USA Tank Trucking Market Revenue Share (%), by Country 2025 & 2033
- Figure 34: Asia Pacific USA Tank Trucking Market Revenue (Million), by Fleet Type 2025 & 2033
- Figure 35: Asia Pacific USA Tank Trucking Market Revenue Share (%), by Fleet Type 2025 & 2033
- Figure 36: Asia Pacific USA Tank Trucking Market Revenue (Million), by Capacity 2025 & 2033
- Figure 37: Asia Pacific USA Tank Trucking Market Revenue Share (%), by Capacity 2025 & 2033
- Figure 38: Asia Pacific USA Tank Trucking Market Revenue (Million), by Product Category 2025 & 2033
- Figure 39: Asia Pacific USA Tank Trucking Market Revenue Share (%), by Product Category 2025 & 2033
- Figure 40: Asia Pacific USA Tank Trucking Market Revenue (Million), by Country 2025 & 2033
- Figure 41: Asia Pacific USA Tank Trucking Market Revenue Share (%), by Country 2025 & 2033
List of Tables
- Table 1: Global USA Tank Trucking Market Revenue Million Forecast, by Fleet Type 2020 & 2033
- Table 2: Global USA Tank Trucking Market Revenue Million Forecast, by Capacity 2020 & 2033
- Table 3: Global USA Tank Trucking Market Revenue Million Forecast, by Product Category 2020 & 2033
- Table 4: Global USA Tank Trucking Market Revenue Million Forecast, by Region 2020 & 2033
- Table 5: Global USA Tank Trucking Market Revenue Million Forecast, by Fleet Type 2020 & 2033
- Table 6: Global USA Tank Trucking Market Revenue Million Forecast, by Capacity 2020 & 2033
- Table 7: Global USA Tank Trucking Market Revenue Million Forecast, by Product Category 2020 & 2033
- Table 8: Global USA Tank Trucking Market Revenue Million Forecast, by Country 2020 & 2033
- Table 9: United States USA Tank Trucking Market Revenue (Million) Forecast, by Application 2020 & 2033
- Table 10: Canada USA Tank Trucking Market Revenue (Million) Forecast, by Application 2020 & 2033
- Table 11: Mexico USA Tank Trucking Market Revenue (Million) Forecast, by Application 2020 & 2033
- Table 12: Global USA Tank Trucking Market Revenue Million Forecast, by Fleet Type 2020 & 2033
- Table 13: Global USA Tank Trucking Market Revenue Million Forecast, by Capacity 2020 & 2033
- Table 14: Global USA Tank Trucking Market Revenue Million Forecast, by Product Category 2020 & 2033
- Table 15: Global USA Tank Trucking Market Revenue Million Forecast, by Country 2020 & 2033
- Table 16: Brazil USA Tank Trucking Market Revenue (Million) Forecast, by Application 2020 & 2033
- Table 17: Argentina USA Tank Trucking Market Revenue (Million) Forecast, by Application 2020 & 2033
- Table 18: Rest of South America USA Tank Trucking Market Revenue (Million) Forecast, by Application 2020 & 2033
- Table 19: Global USA Tank Trucking Market Revenue Million Forecast, by Fleet Type 2020 & 2033
- Table 20: Global USA Tank Trucking Market Revenue Million Forecast, by Capacity 2020 & 2033
- Table 21: Global USA Tank Trucking Market Revenue Million Forecast, by Product Category 2020 & 2033
- Table 22: Global USA Tank Trucking Market Revenue Million Forecast, by Country 2020 & 2033
- Table 23: United Kingdom USA Tank Trucking Market Revenue (Million) Forecast, by Application 2020 & 2033
- Table 24: Germany USA Tank Trucking Market Revenue (Million) Forecast, by Application 2020 & 2033
- Table 25: France USA Tank Trucking Market Revenue (Million) Forecast, by Application 2020 & 2033
- Table 26: Italy USA Tank Trucking Market Revenue (Million) Forecast, by Application 2020 & 2033
- Table 27: Spain USA Tank Trucking Market Revenue (Million) Forecast, by Application 2020 & 2033
- Table 28: Russia USA Tank Trucking Market Revenue (Million) Forecast, by Application 2020 & 2033
- Table 29: Benelux USA Tank Trucking Market Revenue (Million) Forecast, by Application 2020 & 2033
- Table 30: Nordics USA Tank Trucking Market Revenue (Million) Forecast, by Application 2020 & 2033
- Table 31: Rest of Europe USA Tank Trucking Market Revenue (Million) Forecast, by Application 2020 & 2033
- Table 32: Global USA Tank Trucking Market Revenue Million Forecast, by Fleet Type 2020 & 2033
- Table 33: Global USA Tank Trucking Market Revenue Million Forecast, by Capacity 2020 & 2033
- Table 34: Global USA Tank Trucking Market Revenue Million Forecast, by Product Category 2020 & 2033
- Table 35: Global USA Tank Trucking Market Revenue Million Forecast, by Country 2020 & 2033
- Table 36: Turkey USA Tank Trucking Market Revenue (Million) Forecast, by Application 2020 & 2033
- Table 37: Israel USA Tank Trucking Market Revenue (Million) Forecast, by Application 2020 & 2033
- Table 38: GCC USA Tank Trucking Market Revenue (Million) Forecast, by Application 2020 & 2033
- Table 39: North Africa USA Tank Trucking Market Revenue (Million) Forecast, by Application 2020 & 2033
- Table 40: South Africa USA Tank Trucking Market Revenue (Million) Forecast, by Application 2020 & 2033
- Table 41: Rest of Middle East & Africa USA Tank Trucking Market Revenue (Million) Forecast, by Application 2020 & 2033
- Table 42: Global USA Tank Trucking Market Revenue Million Forecast, by Fleet Type 2020 & 2033
- Table 43: Global USA Tank Trucking Market Revenue Million Forecast, by Capacity 2020 & 2033
- Table 44: Global USA Tank Trucking Market Revenue Million Forecast, by Product Category 2020 & 2033
- Table 45: Global USA Tank Trucking Market Revenue Million Forecast, by Country 2020 & 2033
- Table 46: China USA Tank Trucking Market Revenue (Million) Forecast, by Application 2020 & 2033
- Table 47: India USA Tank Trucking Market Revenue (Million) Forecast, by Application 2020 & 2033
- Table 48: Japan USA Tank Trucking Market Revenue (Million) Forecast, by Application 2020 & 2033
- Table 49: South Korea USA Tank Trucking Market Revenue (Million) Forecast, by Application 2020 & 2033
- Table 50: ASEAN USA Tank Trucking Market Revenue (Million) Forecast, by Application 2020 & 2033
- Table 51: Oceania USA Tank Trucking Market Revenue (Million) Forecast, by Application 2020 & 2033
- Table 52: Rest of Asia Pacific USA Tank Trucking Market Revenue (Million) Forecast, by Application 2020 & 2033
Frequently Asked Questions
1. What is the projected Compound Annual Growth Rate (CAGR) of the USA Tank Trucking Market?
The projected CAGR is approximately 3.42%.
2. Which companies are prominent players in the USA Tank Trucking Market?
Key companies in the market include Trimac Transportation Inc, Foodliner/Quest Liner Inc, Tankstar USA, Superior Bulk Logistics Inc, Miller Transporters Inc, Groendyke Transport Inc, Martin Transport Inc, Florida Rock & Tank Lines Inc **List Not Exhaustive 7 3 Other Companies (Slay Transportation Co Inc Apex Logistics LLC Mission Petroleum Carriers Genox Transportation Inc J&M Tank Lines Inc CLI Transport LP Tidewater Transit Co Inc Herman R Ewell Inc Service Transport Company Schilli Bulk Carriers Group Andrews Logistics and CTL Transportation LLC, Eagle Transport Corp, Ruan Transportation Management Systems, Kenan Advantage Group, Dupre Logistics LLC.
3. What are the main segments of the USA Tank Trucking Market?
The market segments include Fleet Type, Capacity, Product Category.
4. Can you provide details about the market size?
The market size is estimated to be USD 59.69 Million as of 2022.
5. What are some drivers contributing to market growth?
Rise in Demand for Oil and Natural Gas; Technological Advancements.
6. What are the notable trends driving market growth?
Fuel Tank Trailers as Petroleum Carriers are Boosting the Market's Growth in the United States.
7. Are there any restraints impacting market growth?
Increasing Regulatory Burden and Compliance Costs; Volatility of Fuel Prices.
8. Can you provide examples of recent developments in the market?
February 2024: Kenan Advantage Group, the largest tank truck transporter and logistics provider in North America, acquired Northern Dry Bulk, a company specializing in the transportation and storage of plastic resins for clients in the automotive, packaging, and electronics sectors across the United States and Canada. This acquisition brought 36 tractors, 91 trailers, and two terminals with two maintenance bays, along with warehouse space and trans-loading capabilities, into the KAG portfolio.
9. What pricing options are available for accessing the report?
Pricing options include single-user, multi-user, and enterprise licenses priced at USD 3800, USD 4500, and USD 5800 respectively.
10. Is the market size provided in terms of value or volume?
The market size is provided in terms of value, measured in Million.
11. Are there any specific market keywords associated with the report?
Yes, the market keyword associated with the report is "USA Tank Trucking Market," which aids in identifying and referencing the specific market segment covered.
12. How do I determine which pricing option suits my needs best?
The pricing options vary based on user requirements and access needs. Individual users may opt for single-user licenses, while businesses requiring broader access may choose multi-user or enterprise licenses for cost-effective access to the report.
13. Are there any additional resources or data provided in the USA Tank Trucking Market report?
While the report offers comprehensive insights, it's advisable to review the specific contents or supplementary materials provided to ascertain if additional resources or data are available.
14. How can I stay updated on further developments or reports in the USA Tank Trucking Market?
To stay informed about further developments, trends, and reports in the USA Tank Trucking Market, consider subscribing to industry newsletters, following relevant companies and organizations, or regularly checking reputable industry news sources and publications.
Methodology
Step 1 - Identification of Relevant Samples Size from Population Database


Step 2 - Approaches for Defining Global Market Size (Value, Volume* & Price*)

Note*: In applicable scenarios
Step 3 - Data Sources
Primary Research
- Web Analytics
- Survey Reports
- Research Institute
- Latest Research Reports
- Opinion Leaders
Secondary Research
- Annual Reports
- White Paper
- Latest Press Release
- Industry Association
- Paid Database
- Investor Presentations

Step 4 - Data Triangulation
Involves using different sources of information in order to increase the validity of a study
These sources are likely to be stakeholders in a program - participants, other researchers, program staff, other community members, and so on.
Then we put all data in single framework & apply various statistical tools to find out the dynamic on the market.
During the analysis stage, feedback from the stakeholder groups would be compared to determine areas of agreement as well as areas of divergence