

Key Insights
The South African 3PL (Third-Party Logistics) industry is experiencing robust growth, driven by the increasing adoption of e-commerce, the expansion of manufacturing and automotive sectors, and a need for efficient supply chain management. The market, valued at approximately $5.99 billion in 2025, is projected to maintain a Compound Annual Growth Rate (CAGR) of 6.64% through 2033. This growth is fueled by several key factors. Firstly, the rise of e-commerce necessitates sophisticated logistics solutions for last-mile delivery and efficient order fulfillment, pushing companies to outsource these functions to 3PL providers. Secondly, the manufacturing and automotive sectors, significant contributors to the South African economy, rely heavily on efficient transportation and warehousing to manage their complex supply chains. The growth of the Oil & Gas and Chemicals sectors also contributes significantly to the demand for specialized 3PL services. Furthermore, the expanding pharmaceutical and healthcare industries require secure and temperature-controlled logistics, further bolstering the 3PL market. The increasing preference for outsourcing logistics operations due to cost optimization and improved efficiency also contributes to market expansion. While potential constraints such as infrastructure limitations and fluctuating fuel prices might exist, the overall positive economic outlook and increasing demand for streamlined logistics suggest sustained growth for the South African 3PL market in the coming years. Competition remains intense amongst established players like DHL, DB Schenker, and Kuehne + Nagel, alongside local providers like Bidvest International Logistics and Transnova, indicating a dynamic and evolving landscape. The diverse range of services offered, including domestic and international transportation management, value-added warehousing, and distribution, caters to a wide spectrum of end-user needs across various sectors.
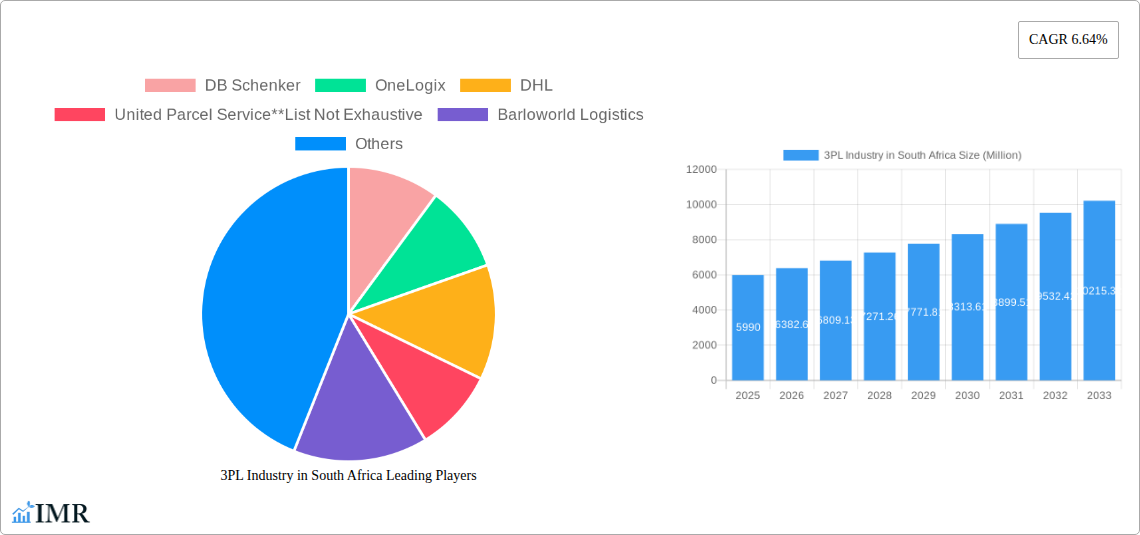
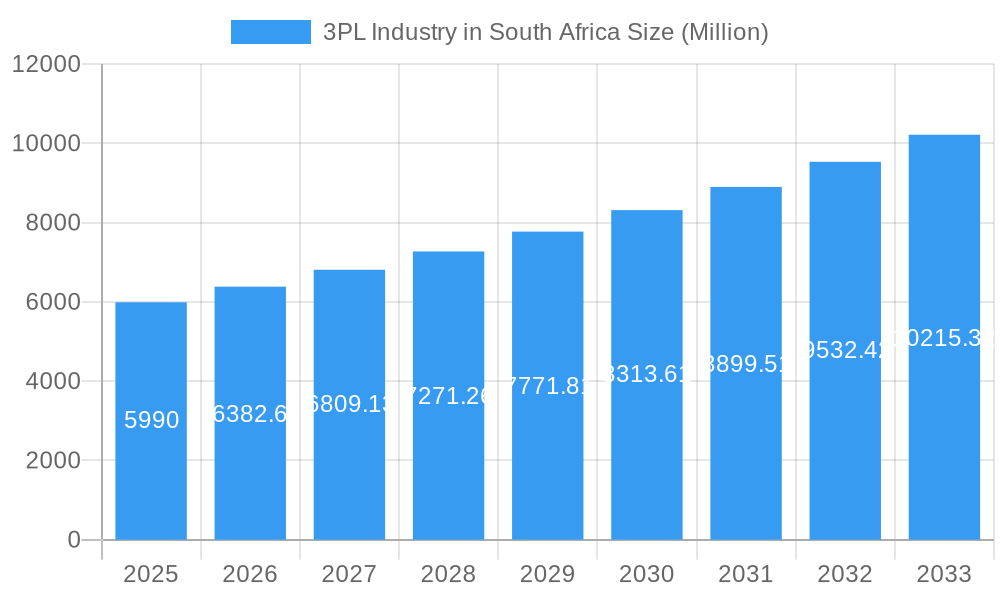
3PL Industry in South Africa Market Size (In Billion)
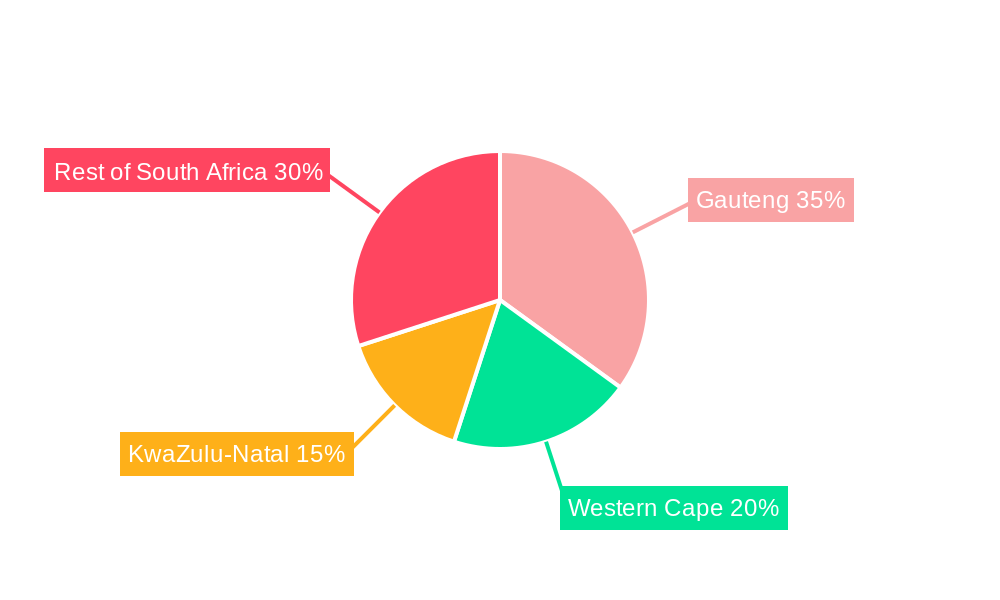
The segmentation of the South African 3PL market reveals significant opportunities across various sectors. The Manufacturing & Automotive, Oil & Gas and Chemicals, and Distributive Trade (including e-commerce) segments are projected to be the primary growth drivers. Growth within the Pharma & Healthcare sector is expected due to the stringent requirements for handling sensitive pharmaceutical products. The construction sector's demand for efficient material handling and delivery is another contributing factor. While data for specific regional market shares within South Africa (e.g., Gauteng, Western Cape) is unavailable, it’s reasonable to expect that the major metropolitan areas and economic hubs will experience the most significant market activity. The forecast period of 2025-2033 presents a lucrative period for both established and emerging players in the South African 3PL industry, requiring strategic planning and adaptation to meet evolving customer needs and market dynamics.
3PL Industry in South Africa Company Market Share
3PL Industry in South Africa: A Comprehensive Market Report (2019-2033)
This comprehensive report provides a detailed analysis of the South African 3PL (Third-Party Logistics) industry, covering market dynamics, growth trends, key players, and future outlook. The study period spans from 2019 to 2033, with 2025 serving as the base and estimated year. The report utilizes a robust methodology, incorporating both qualitative and quantitative data to deliver actionable insights for industry professionals, investors, and strategic decision-makers. The South African 3PL market is segmented by service (Domestic Transportation Management, International Transportation Management, Value-added Warehousing and Distribution) and end-user (Manufacturing & Automotive, Oil & Gas and Chemicals, Distributive Trade, Pharma & Healthcare, Construction, Other End Users). The market size is valued in millions of units (ZAR).
3PL Industry in South Africa Market Dynamics & Structure
The South African 3PL market is characterized by a moderately concentrated structure, with several large international and domestic players competing alongside numerous smaller, specialized providers. The market size in 2025 is estimated at ZAR xx million, projected to reach ZAR xx million by 2033. Technological innovation, particularly in areas like automation, data analytics, and digitalization, is a key driver of growth. However, challenges remain, including infrastructure limitations, regulatory complexities, and skills shortages. Mergers and acquisitions (M&A) activity has been moderate, with larger players seeking to expand their service offerings and geographical reach.
- Market Concentration: Moderate, with a few dominant players holding significant market share (e.g., DHL, DB Schenker holding a combined xx% market share in 2025).
- Technological Innovation: Strong driver, with increasing adoption of automation, AI, and IoT in warehousing and transportation.
- Regulatory Framework: Relatively stable, but evolving regulations related to data privacy and transportation compliance present ongoing challenges.
- Competitive Substitutes: Limited direct substitutes, but increasing internalization of logistics functions by some companies poses a competitive threat.
- End-User Demographics: Diverse, with manufacturing, retail, and healthcare sectors being significant users of 3PL services.
- M&A Trends: Moderate activity, driven by consolidation and expansion strategies among major players. An estimated xx M&A deals were concluded in the period 2019-2024.
3PL Industry in South Africa Growth Trends & Insights
The South African 3PL market has experienced steady growth over the past five years (2019-2024), driven by factors such as the rise of e-commerce, increasing outsourcing of logistics functions, and growing demand for efficient and cost-effective supply chain solutions. The market is projected to grow at a CAGR of xx% during the forecast period (2025-2033), reaching a value of ZAR xx million by 2033. This growth is further fueled by technological advancements, evolving consumer expectations, and improving infrastructure in certain regions. Market penetration of 3PL services is steadily increasing across various industry segments.
(Note: This section requires data from source XXX to populate the specific metrics and detailed growth narrative.)
Dominant Regions, Countries, or Segments in 3PL Industry in South Africa
The Gauteng province dominates the South African 3PL market due to its established industrial base, central location, and superior infrastructure. Within the service segments, Value-added Warehousing and Distribution shows the strongest growth potential, driven by the expanding e-commerce sector. The Manufacturing & Automotive, and Distributive Trade (Wholesale and Retail including e-commerce) end-user segments are the largest consumers of 3PL services.
- Gauteng Province: Dominant due to its concentration of industries and superior infrastructure.
- Value-added Warehousing & Distribution: Fastest-growing service segment, driven by e-commerce expansion.
- Manufacturing & Automotive: Largest end-user segment, demanding efficient and reliable logistics solutions.
- Distributive Trade (e-commerce included): Significant growth potential driven by the booming e-commerce sector.
- Key Drivers: Government initiatives to improve infrastructure, growing e-commerce market, and increasing focus on supply chain efficiency.
3PL Industry in South Africa Product Landscape
The 3PL service landscape is evolving rapidly, with a growing emphasis on integrated solutions, advanced technology, and customized service offerings. Innovations include the adoption of warehouse management systems (WMS), transportation management systems (TMS), and data analytics platforms to enhance efficiency and visibility throughout the supply chain. Companies are increasingly offering value-added services like packaging, labeling, and reverse logistics to meet the specific needs of their clients. The key selling propositions revolve around improved efficiency, cost optimization, and enhanced supply chain visibility.
Key Drivers, Barriers & Challenges in 3PL Industry in South Africa
Key Drivers:
- Increased outsourcing of logistics functions by businesses seeking to focus on core competencies.
- Growth of e-commerce driving demand for efficient last-mile delivery solutions.
- Technological advancements improving supply chain visibility and efficiency.
Challenges & Restraints:
- Infrastructure limitations, particularly in some regions outside of major urban centers.
- Skills shortage in logistics and related technology areas.
- Intense competition among 3PL providers leading to price pressure. Competition has led to a ZAR xx million reduction in average pricing in 2025.
- Regulatory hurdles and compliance costs.
Emerging Opportunities in 3PL Industry in South Africa
- Growth of e-commerce presents significant opportunities for last-mile delivery and fulfillment services.
- Increasing demand for specialized 3PL solutions for sectors such as pharmaceuticals and healthcare.
- Adoption of emerging technologies like blockchain and AI to enhance supply chain security and efficiency.
- Expansion into underserved regional markets.
Growth Accelerators in the 3PL Industry in South Africa Industry
Continued investment in infrastructure, technological advancements in automation and data analytics, strategic partnerships between 3PL providers and technology companies, and expansion into new market segments will fuel long-term growth. The increasing adoption of sustainable and green logistics practices presents a significant opportunity for differentiation and market leadership.
Key Players Shaping the 3PL Industry in South Africa Market
- DB Schenker
- OneLogix
- DHL
- United Parcel Service
- Barloworld Logistics
- Vital Distribution
- CEVA Logistics
- Kuehne + Nagel
- Transnova
- Bidvest International Logistics
- Bollore Logistics
- DPD Laser Express Logistics
- Value Logistics
- DSV
- City Logistics
Notable Milestones in 3PL Industry in South Africa Sector
- 2020: Increased adoption of digital technologies to manage supply chain disruptions.
- 2021: Several major 3PL companies invested heavily in warehouse automation.
- 2022: Government initiatives launched to improve logistics infrastructure.
- 2023: Several M&A transactions leading to market consolidation.
- 2024: Focus on sustainable and environmentally friendly logistics solutions.
In-Depth 3PL Industry in South Africa Market Outlook
The South African 3PL market is poised for significant growth over the next decade, driven by technological advancements, expanding e-commerce, and increased focus on supply chain optimization. Companies that invest in technology, build strong partnerships, and offer specialized solutions will be best positioned to capture market share. Focus on sustainable and resilient supply chain solutions will become increasingly important in the years to come. The market's potential is significant, with further growth opportunities arising from infrastructure improvements and economic expansion.
3PL Industry in South Africa Segmentation
-
1. Service
- 1.1. Domestic Transportation Management
- 1.2. International Transportation Management
- 1.3. Value-added Warehousing and Distribution
-
2. End-User
- 2.1. Manufacturing & Automotive
- 2.2. Oil & Gas and Chemicals
- 2.3. Distribu
- 2.4. Pharma & Healthcare
- 2.5. Construction
- 2.6. Other End Users
3PL Industry in South Africa Segmentation By Geography
-
1. North America
- 1.1. United States
- 1.2. Canada
- 1.3. Mexico
-
2. South America
- 2.1. Brazil
- 2.2. Argentina
- 2.3. Rest of South America
-
3. Europe
- 3.1. United Kingdom
- 3.2. Germany
- 3.3. France
- 3.4. Italy
- 3.5. Spain
- 3.6. Russia
- 3.7. Benelux
- 3.8. Nordics
- 3.9. Rest of Europe
-
4. Middle East & Africa
- 4.1. Turkey
- 4.2. Israel
- 4.3. GCC
- 4.4. North Africa
- 4.5. South Africa
- 4.6. Rest of Middle East & Africa
-
5. Asia Pacific
- 5.1. China
- 5.2. India
- 5.3. Japan
- 5.4. South Korea
- 5.5. ASEAN
- 5.6. Oceania
- 5.7. Rest of Asia Pacific
3PL Industry in South Africa Regional Market Share
Geographic Coverage of 3PL Industry in South Africa
3PL Industry in South Africa REPORT HIGHLIGHTS
| Aspects | Details |
|---|---|
| Study Period | 2020-2034 |
| Base Year | 2025 |
| Estimated Year | 2026 |
| Forecast Period | 2026-2034 |
| Historical Period | 2020-2025 |
| Growth Rate | CAGR of 6.64% from 2020-2034 |
| Segmentation |
|
Table of Contents
- 1. Introduction
- 1.1. Research Scope
- 1.2. Market Segmentation
- 1.3. Research Objective
- 1.4. Definitions and Assumptions
- 2. Executive Summary
- 2.1. Market Snapshot
- 3. Market Dynamics
- 3.1. Market Drivers
- 3.2. Market Restrains
- 3.3. Market Trends
- 3.4. Market Opportunities
- 4. Market Factor Analysis
- 4.1. Porters Five Forces
- 4.1.1. Bargaining Power of Suppliers
- 4.1.2. Bargaining Power of Buyers
- 4.1.3. Threat of New Entrants
- 4.1.4. Threat of Substitutes
- 4.1.5. Competitive Rivalry
- 4.2. PESTEL analysis
- 4.3. BCG Analysis
- 4.3.1. Stars (High Growth, High Market Share)
- 4.3.2. Cash Cows (Low Growth, High Market Share)
- 4.3.3. Question Mark (High Growth, Low Market Share)
- 4.3.4. Dogs (Low Growth, Low Market Share)
- 4.4. Ansoff Matrix Analysis
- 4.5. Supply Chain Analysis
- 4.6. Regulatory Landscape
- 4.7. Current Market Potential and Opportunity Assessment (TAM–SAM–SOM Framework)
- 4.8. IMR Analyst Note
- 4.1. Porters Five Forces
- 5. Market Analysis, Insights and Forecast 2021-2033
- 5.1. Market Analysis, Insights and Forecast - by Service
- 5.1.1. Domestic Transportation Management
- 5.1.2. International Transportation Management
- 5.1.3. Value-added Warehousing and Distribution
- 5.2. Market Analysis, Insights and Forecast - by End-User
- 5.2.1. Manufacturing & Automotive
- 5.2.2. Oil & Gas and Chemicals
- 5.2.3. Distribu
- 5.2.4. Pharma & Healthcare
- 5.2.5. Construction
- 5.2.6. Other End Users
- 5.3. Market Analysis, Insights and Forecast - by Region
- 5.3.1. North America
- 5.3.2. South America
- 5.3.3. Europe
- 5.3.4. Middle East & Africa
- 5.3.5. Asia Pacific
- 5.1. Market Analysis, Insights and Forecast - by Service
- 6. Global 3PL Industry in South Africa Analysis, Insights and Forecast, 2021-2033
- 6.1. Market Analysis, Insights and Forecast - by Service
- 6.1.1. Domestic Transportation Management
- 6.1.2. International Transportation Management
- 6.1.3. Value-added Warehousing and Distribution
- 6.2. Market Analysis, Insights and Forecast - by End-User
- 6.2.1. Manufacturing & Automotive
- 6.2.2. Oil & Gas and Chemicals
- 6.2.3. Distribu
- 6.2.4. Pharma & Healthcare
- 6.2.5. Construction
- 6.2.6. Other End Users
- 6.1. Market Analysis, Insights and Forecast - by Service
- 7. North America 3PL Industry in South Africa Analysis, Insights and Forecast, 2020-2032
- 7.1. Market Analysis, Insights and Forecast - by Service
- 7.1.1. Domestic Transportation Management
- 7.1.2. International Transportation Management
- 7.1.3. Value-added Warehousing and Distribution
- 7.2. Market Analysis, Insights and Forecast - by End-User
- 7.2.1. Manufacturing & Automotive
- 7.2.2. Oil & Gas and Chemicals
- 7.2.3. Distribu
- 7.2.4. Pharma & Healthcare
- 7.2.5. Construction
- 7.2.6. Other End Users
- 7.1. Market Analysis, Insights and Forecast - by Service
- 8. South America 3PL Industry in South Africa Analysis, Insights and Forecast, 2020-2032
- 8.1. Market Analysis, Insights and Forecast - by Service
- 8.1.1. Domestic Transportation Management
- 8.1.2. International Transportation Management
- 8.1.3. Value-added Warehousing and Distribution
- 8.2. Market Analysis, Insights and Forecast - by End-User
- 8.2.1. Manufacturing & Automotive
- 8.2.2. Oil & Gas and Chemicals
- 8.2.3. Distribu
- 8.2.4. Pharma & Healthcare
- 8.2.5. Construction
- 8.2.6. Other End Users
- 8.1. Market Analysis, Insights and Forecast - by Service
- 9. Europe 3PL Industry in South Africa Analysis, Insights and Forecast, 2020-2032
- 9.1. Market Analysis, Insights and Forecast - by Service
- 9.1.1. Domestic Transportation Management
- 9.1.2. International Transportation Management
- 9.1.3. Value-added Warehousing and Distribution
- 9.2. Market Analysis, Insights and Forecast - by End-User
- 9.2.1. Manufacturing & Automotive
- 9.2.2. Oil & Gas and Chemicals
- 9.2.3. Distribu
- 9.2.4. Pharma & Healthcare
- 9.2.5. Construction
- 9.2.6. Other End Users
- 9.1. Market Analysis, Insights and Forecast - by Service
- 10. Middle East & Africa 3PL Industry in South Africa Analysis, Insights and Forecast, 2020-2032
- 10.1. Market Analysis, Insights and Forecast - by Service
- 10.1.1. Domestic Transportation Management
- 10.1.2. International Transportation Management
- 10.1.3. Value-added Warehousing and Distribution
- 10.2. Market Analysis, Insights and Forecast - by End-User
- 10.2.1. Manufacturing & Automotive
- 10.2.2. Oil & Gas and Chemicals
- 10.2.3. Distribu
- 10.2.4. Pharma & Healthcare
- 10.2.5. Construction
- 10.2.6. Other End Users
- 10.1. Market Analysis, Insights and Forecast - by Service
- 11. Asia Pacific 3PL Industry in South Africa Analysis, Insights and Forecast, 2020-2032
- 11.1. Market Analysis, Insights and Forecast - by Service
- 11.1.1. Domestic Transportation Management
- 11.1.2. International Transportation Management
- 11.1.3. Value-added Warehousing and Distribution
- 11.2. Market Analysis, Insights and Forecast - by End-User
- 11.2.1. Manufacturing & Automotive
- 11.2.2. Oil & Gas and Chemicals
- 11.2.3. Distribu
- 11.2.4. Pharma & Healthcare
- 11.2.5. Construction
- 11.2.6. Other End Users
- 11.1. Market Analysis, Insights and Forecast - by Service
- 12. Competitive Analysis
- 12.1. Company Profiles
- 12.1.1 DB Schenker
- 12.1.1.1. Company Overview
- 12.1.1.2. Products
- 12.1.1.3. Company Financials
- 12.1.1.4. SWOT Analysis
- 12.1.2 OneLogix
- 12.1.2.1. Company Overview
- 12.1.2.2. Products
- 12.1.2.3. Company Financials
- 12.1.2.4. SWOT Analysis
- 12.1.3 DHL
- 12.1.3.1. Company Overview
- 12.1.3.2. Products
- 12.1.3.3. Company Financials
- 12.1.3.4. SWOT Analysis
- 12.1.4 United Parcel Service**List Not Exhaustive
- 12.1.4.1. Company Overview
- 12.1.4.2. Products
- 12.1.4.3. Company Financials
- 12.1.4.4. SWOT Analysis
- 12.1.5 Barloworld Logistics
- 12.1.5.1. Company Overview
- 12.1.5.2. Products
- 12.1.5.3. Company Financials
- 12.1.5.4. SWOT Analysis
- 12.1.6 Vital Distribution
- 12.1.6.1. Company Overview
- 12.1.6.2. Products
- 12.1.6.3. Company Financials
- 12.1.6.4. SWOT Analysis
- 12.1.7 CEVA Logistics
- 12.1.7.1. Company Overview
- 12.1.7.2. Products
- 12.1.7.3. Company Financials
- 12.1.7.4. SWOT Analysis
- 12.1.8 Kuehne + Nagel
- 12.1.8.1. Company Overview
- 12.1.8.2. Products
- 12.1.8.3. Company Financials
- 12.1.8.4. SWOT Analysis
- 12.1.9 Transnova
- 12.1.9.1. Company Overview
- 12.1.9.2. Products
- 12.1.9.3. Company Financials
- 12.1.9.4. SWOT Analysis
- 12.1.10 Bidvest International Logistics
- 12.1.10.1. Company Overview
- 12.1.10.2. Products
- 12.1.10.3. Company Financials
- 12.1.10.4. SWOT Analysis
- 12.1.11 Bollore Logistics
- 12.1.11.1. Company Overview
- 12.1.11.2. Products
- 12.1.11.3. Company Financials
- 12.1.11.4. SWOT Analysis
- 12.1.12 DPD Laser Express Logistics
- 12.1.12.1. Company Overview
- 12.1.12.2. Products
- 12.1.12.3. Company Financials
- 12.1.12.4. SWOT Analysis
- 12.1.13 Value Logistics
- 12.1.13.1. Company Overview
- 12.1.13.2. Products
- 12.1.13.3. Company Financials
- 12.1.13.4. SWOT Analysis
- 12.1.14 DSV
- 12.1.14.1. Company Overview
- 12.1.14.2. Products
- 12.1.14.3. Company Financials
- 12.1.14.4. SWOT Analysis
- 12.1.15 City Logistics
- 12.1.15.1. Company Overview
- 12.1.15.2. Products
- 12.1.15.3. Company Financials
- 12.1.15.4. SWOT Analysis
- 12.1.1 DB Schenker
- 12.2. Market Entropy
- 12.2.1 Company's Key Areas Served
- 12.2.2 Recent Developments
- 12.3. Company Market Share Analysis 2025
- 12.3.1 Top 5 Companies Market Share Analysis
- 12.3.2 Top 3 Companies Market Share Analysis
- 12.4. List of Potential Customers
- 13. Research Methodology
List of Figures
- Figure 1: Global 3PL Industry in South Africa Revenue Breakdown (Million, %) by Region 2025 & 2033
- Figure 2: North America 3PL Industry in South Africa Revenue (Million), by Service 2025 & 2033
- Figure 3: North America 3PL Industry in South Africa Revenue Share (%), by Service 2025 & 2033
- Figure 4: North America 3PL Industry in South Africa Revenue (Million), by End-User 2025 & 2033
- Figure 5: North America 3PL Industry in South Africa Revenue Share (%), by End-User 2025 & 2033
- Figure 6: North America 3PL Industry in South Africa Revenue (Million), by Country 2025 & 2033
- Figure 7: North America 3PL Industry in South Africa Revenue Share (%), by Country 2025 & 2033
- Figure 8: South America 3PL Industry in South Africa Revenue (Million), by Service 2025 & 2033
- Figure 9: South America 3PL Industry in South Africa Revenue Share (%), by Service 2025 & 2033
- Figure 10: South America 3PL Industry in South Africa Revenue (Million), by End-User 2025 & 2033
- Figure 11: South America 3PL Industry in South Africa Revenue Share (%), by End-User 2025 & 2033
- Figure 12: South America 3PL Industry in South Africa Revenue (Million), by Country 2025 & 2033
- Figure 13: South America 3PL Industry in South Africa Revenue Share (%), by Country 2025 & 2033
- Figure 14: Europe 3PL Industry in South Africa Revenue (Million), by Service 2025 & 2033
- Figure 15: Europe 3PL Industry in South Africa Revenue Share (%), by Service 2025 & 2033
- Figure 16: Europe 3PL Industry in South Africa Revenue (Million), by End-User 2025 & 2033
- Figure 17: Europe 3PL Industry in South Africa Revenue Share (%), by End-User 2025 & 2033
- Figure 18: Europe 3PL Industry in South Africa Revenue (Million), by Country 2025 & 2033
- Figure 19: Europe 3PL Industry in South Africa Revenue Share (%), by Country 2025 & 2033
- Figure 20: Middle East & Africa 3PL Industry in South Africa Revenue (Million), by Service 2025 & 2033
- Figure 21: Middle East & Africa 3PL Industry in South Africa Revenue Share (%), by Service 2025 & 2033
- Figure 22: Middle East & Africa 3PL Industry in South Africa Revenue (Million), by End-User 2025 & 2033
- Figure 23: Middle East & Africa 3PL Industry in South Africa Revenue Share (%), by End-User 2025 & 2033
- Figure 24: Middle East & Africa 3PL Industry in South Africa Revenue (Million), by Country 2025 & 2033
- Figure 25: Middle East & Africa 3PL Industry in South Africa Revenue Share (%), by Country 2025 & 2033
- Figure 26: Asia Pacific 3PL Industry in South Africa Revenue (Million), by Service 2025 & 2033
- Figure 27: Asia Pacific 3PL Industry in South Africa Revenue Share (%), by Service 2025 & 2033
- Figure 28: Asia Pacific 3PL Industry in South Africa Revenue (Million), by End-User 2025 & 2033
- Figure 29: Asia Pacific 3PL Industry in South Africa Revenue Share (%), by End-User 2025 & 2033
- Figure 30: Asia Pacific 3PL Industry in South Africa Revenue (Million), by Country 2025 & 2033
- Figure 31: Asia Pacific 3PL Industry in South Africa Revenue Share (%), by Country 2025 & 2033
List of Tables
- Table 1: Global 3PL Industry in South Africa Revenue Million Forecast, by Service 2020 & 2033
- Table 2: Global 3PL Industry in South Africa Revenue Million Forecast, by End-User 2020 & 2033
- Table 3: Global 3PL Industry in South Africa Revenue Million Forecast, by Region 2020 & 2033
- Table 4: Global 3PL Industry in South Africa Revenue Million Forecast, by Service 2020 & 2033
- Table 5: Global 3PL Industry in South Africa Revenue Million Forecast, by End-User 2020 & 2033
- Table 6: Global 3PL Industry in South Africa Revenue Million Forecast, by Country 2020 & 2033
- Table 7: United States 3PL Industry in South Africa Revenue (Million) Forecast, by Application 2020 & 2033
- Table 8: Canada 3PL Industry in South Africa Revenue (Million) Forecast, by Application 2020 & 2033
- Table 9: Mexico 3PL Industry in South Africa Revenue (Million) Forecast, by Application 2020 & 2033
- Table 10: Global 3PL Industry in South Africa Revenue Million Forecast, by Service 2020 & 2033
- Table 11: Global 3PL Industry in South Africa Revenue Million Forecast, by End-User 2020 & 2033
- Table 12: Global 3PL Industry in South Africa Revenue Million Forecast, by Country 2020 & 2033
- Table 13: Brazil 3PL Industry in South Africa Revenue (Million) Forecast, by Application 2020 & 2033
- Table 14: Argentina 3PL Industry in South Africa Revenue (Million) Forecast, by Application 2020 & 2033
- Table 15: Rest of South America 3PL Industry in South Africa Revenue (Million) Forecast, by Application 2020 & 2033
- Table 16: Global 3PL Industry in South Africa Revenue Million Forecast, by Service 2020 & 2033
- Table 17: Global 3PL Industry in South Africa Revenue Million Forecast, by End-User 2020 & 2033
- Table 18: Global 3PL Industry in South Africa Revenue Million Forecast, by Country 2020 & 2033
- Table 19: United Kingdom 3PL Industry in South Africa Revenue (Million) Forecast, by Application 2020 & 2033
- Table 20: Germany 3PL Industry in South Africa Revenue (Million) Forecast, by Application 2020 & 2033
- Table 21: France 3PL Industry in South Africa Revenue (Million) Forecast, by Application 2020 & 2033
- Table 22: Italy 3PL Industry in South Africa Revenue (Million) Forecast, by Application 2020 & 2033
- Table 23: Spain 3PL Industry in South Africa Revenue (Million) Forecast, by Application 2020 & 2033
- Table 24: Russia 3PL Industry in South Africa Revenue (Million) Forecast, by Application 2020 & 2033
- Table 25: Benelux 3PL Industry in South Africa Revenue (Million) Forecast, by Application 2020 & 2033
- Table 26: Nordics 3PL Industry in South Africa Revenue (Million) Forecast, by Application 2020 & 2033
- Table 27: Rest of Europe 3PL Industry in South Africa Revenue (Million) Forecast, by Application 2020 & 2033
- Table 28: Global 3PL Industry in South Africa Revenue Million Forecast, by Service 2020 & 2033
- Table 29: Global 3PL Industry in South Africa Revenue Million Forecast, by End-User 2020 & 2033
- Table 30: Global 3PL Industry in South Africa Revenue Million Forecast, by Country 2020 & 2033
- Table 31: Turkey 3PL Industry in South Africa Revenue (Million) Forecast, by Application 2020 & 2033
- Table 32: Israel 3PL Industry in South Africa Revenue (Million) Forecast, by Application 2020 & 2033
- Table 33: GCC 3PL Industry in South Africa Revenue (Million) Forecast, by Application 2020 & 2033
- Table 34: North Africa 3PL Industry in South Africa Revenue (Million) Forecast, by Application 2020 & 2033
- Table 35: South Africa 3PL Industry in South Africa Revenue (Million) Forecast, by Application 2020 & 2033
- Table 36: Rest of Middle East & Africa 3PL Industry in South Africa Revenue (Million) Forecast, by Application 2020 & 2033
- Table 37: Global 3PL Industry in South Africa Revenue Million Forecast, by Service 2020 & 2033
- Table 38: Global 3PL Industry in South Africa Revenue Million Forecast, by End-User 2020 & 2033
- Table 39: Global 3PL Industry in South Africa Revenue Million Forecast, by Country 2020 & 2033
- Table 40: China 3PL Industry in South Africa Revenue (Million) Forecast, by Application 2020 & 2033
- Table 41: India 3PL Industry in South Africa Revenue (Million) Forecast, by Application 2020 & 2033
- Table 42: Japan 3PL Industry in South Africa Revenue (Million) Forecast, by Application 2020 & 2033
- Table 43: South Korea 3PL Industry in South Africa Revenue (Million) Forecast, by Application 2020 & 2033
- Table 44: ASEAN 3PL Industry in South Africa Revenue (Million) Forecast, by Application 2020 & 2033
- Table 45: Oceania 3PL Industry in South Africa Revenue (Million) Forecast, by Application 2020 & 2033
- Table 46: Rest of Asia Pacific 3PL Industry in South Africa Revenue (Million) Forecast, by Application 2020 & 2033
Frequently Asked Questions
1. What is the projected Compound Annual Growth Rate (CAGR) of the 3PL Industry in South Africa?
The projected CAGR is approximately 6.64%.
2. Which companies are prominent players in the 3PL Industry in South Africa?
Key companies in the market include DB Schenker, OneLogix, DHL, United Parcel Service**List Not Exhaustive, Barloworld Logistics, Vital Distribution, CEVA Logistics, Kuehne + Nagel, Transnova, Bidvest International Logistics, Bollore Logistics, DPD Laser Express Logistics, Value Logistics, DSV, City Logistics.
3. What are the main segments of the 3PL Industry in South Africa?
The market segments include Service, End-User.
4. Can you provide details about the market size?
The market size is estimated to be USD 5.99 Million as of 2022.
5. What are some drivers contributing to market growth?
E-commerce Fueling the Growth of 3PL Market.
6. What are the notable trends driving market growth?
AfCFTA to Increase Intra Regional Trade.
7. Are there any restraints impacting market growth?
Slow Infrastructure Development.
8. Can you provide examples of recent developments in the market?
N/A
9. What pricing options are available for accessing the report?
Pricing options include single-user, multi-user, and enterprise licenses priced at USD 3800, USD 4500, and USD 5800 respectively.
10. Is the market size provided in terms of value or volume?
The market size is provided in terms of value, measured in Million.
11. Are there any specific market keywords associated with the report?
Yes, the market keyword associated with the report is "3PL Industry in South Africa," which aids in identifying and referencing the specific market segment covered.
12. How do I determine which pricing option suits my needs best?
The pricing options vary based on user requirements and access needs. Individual users may opt for single-user licenses, while businesses requiring broader access may choose multi-user or enterprise licenses for cost-effective access to the report.
13. Are there any additional resources or data provided in the 3PL Industry in South Africa report?
While the report offers comprehensive insights, it's advisable to review the specific contents or supplementary materials provided to ascertain if additional resources or data are available.
14. How can I stay updated on further developments or reports in the 3PL Industry in South Africa?
To stay informed about further developments, trends, and reports in the 3PL Industry in South Africa, consider subscribing to industry newsletters, following relevant companies and organizations, or regularly checking reputable industry news sources and publications.
Methodology
Step 1 - Identification of Relevant Samples Size from Population Database


Step 2 - Approaches for Defining Global Market Size (Value, Volume* & Price*)

Note*: In applicable scenarios
Step 3 - Data Sources
Primary Research
- Web Analytics
- Survey Reports
- Research Institute
- Latest Research Reports
- Opinion Leaders
Secondary Research
- Annual Reports
- White Paper
- Latest Press Release
- Industry Association
- Paid Database
- Investor Presentations

Step 4 - Data Triangulation
Involves using different sources of information in order to increase the validity of a study
These sources are likely to be stakeholders in a program - participants, other researchers, program staff, other community members, and so on.
Then we put all data in single framework & apply various statistical tools to find out the dynamic on the market.
During the analysis stage, feedback from the stakeholder groups would be compared to determine areas of agreement as well as areas of divergence