

Key Insights
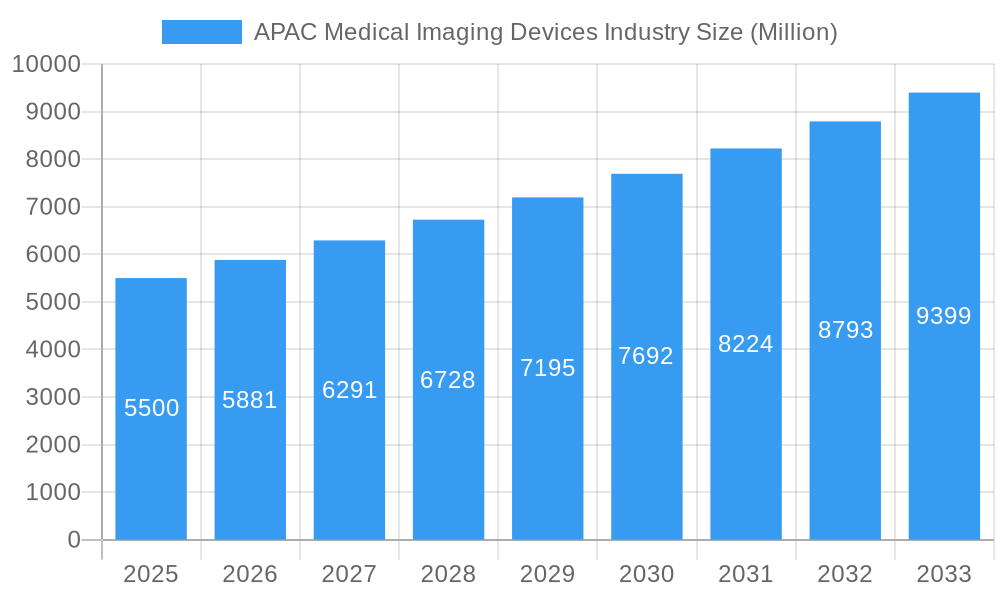
The Asia Pacific (APAC) Medical Imaging Devices market is projected for significant expansion, with an estimated market size of $143.12 billion in the base year 2025. The market is anticipated to grow at a Compound Annual Growth Rate (CAGR) of 8% through 2033. This robust growth is driven by the escalating prevalence of chronic diseases, including cardiovascular, oncological, and neurological disorders, necessitating advanced diagnostic tools. Increased healthcare expenditure from both public and private sectors, alongside growing public awareness of early disease detection and the adoption of sophisticated imaging technologies, are major accelerators. The diverse APAC population offers substantial market potential, especially in developing economies with improving healthcare access. Technological advancements, such as AI-powered imaging analysis, portable MRI systems, and enhanced resolution modalities, are also pivotal in shaping market dynamics and fostering innovation.
APAC Medical Imaging Devices Industry Market Size (In Billion)
Within this dynamic landscape, the MRI segment is expected to experience substantial growth, with a particular focus on Low and Mid-field MRI systems. The demand for these systems is fueled by their cost-effectiveness and suitability for a wider array of clinical applications, including point-of-care diagnostics and settings with limited infrastructure. Key growth drivers include the increasing adoption of advanced imaging techniques for enhanced diagnostic accuracy, the rising demand for minimally invasive procedures requiring precise imaging guidance, and a growing preference for refurbished imaging equipment due to cost considerations. However, market restraints include high initial investment and maintenance costs for sophisticated equipment, stringent regulatory approvals, and a limited availability of skilled radiographers and technicians in some developing nations. Despite these challenges, the market is poised for sustained expansion, driven by demographic shifts, technological innovation, and improving healthcare access across the APAC region.
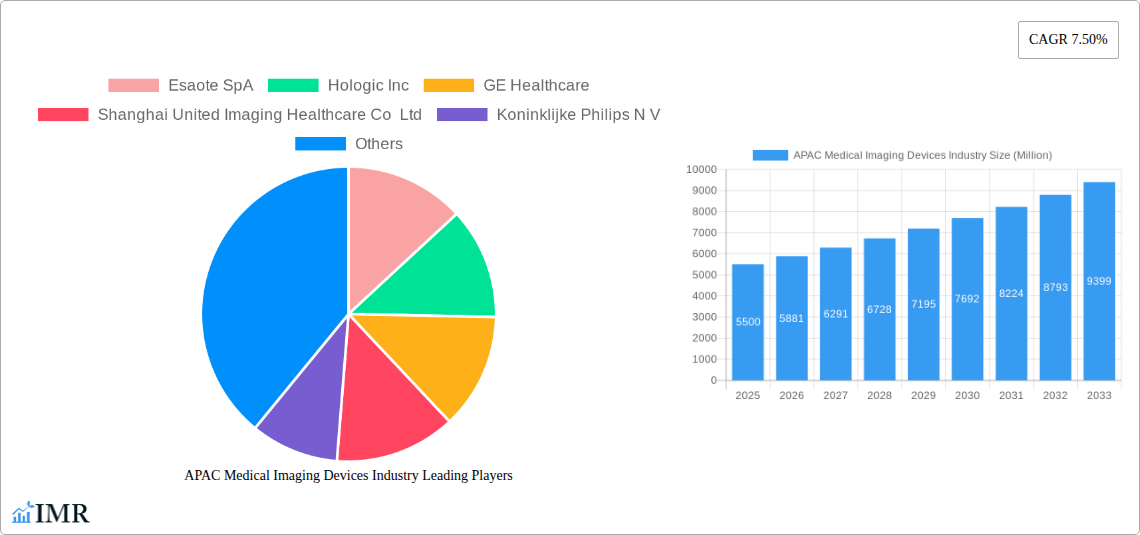
APAC Medical Imaging Devices Industry Company Market Share
APAC Medical Imaging Devices Industry: Comprehensive Market Analysis & Growth Forecast (2019-2033)
This in-depth report provides a definitive analysis of the APAC Medical Imaging Devices Industry, focusing on the crucial MRI segment, specifically Low and Mid-Field MRI systems. With a detailed study period from 2019 to 2033, and a base year of 2025, this report offers unparalleled insights into market dynamics, growth trends, competitive landscape, and future opportunities. We present all quantitative values in Million units for clarity and direct comparison. This report is ready for immediate use without any further modification.
APAC Medical Imaging Devices Industry Market Dynamics & Structure
The APAC Medical Imaging Devices Industry is characterized by a moderately concentrated market, with major players like GE Healthcare, Siemens AG, and Koninklijke Philips N.V. holding significant shares, particularly in the advanced imaging modalities. Technological innovation remains a primary driver, with ongoing advancements in AI-powered image analysis, miniaturization of devices, and increased adoption of digital imaging solutions propelling market growth. Regulatory frameworks across different APAC nations, while evolving, present both opportunities for compliant new entrants and barriers for those with less advanced technologies. Competitive product substitutes, such as advanced ultrasound and CT scanners, pose a constant challenge, forcing manufacturers to innovate and differentiate their MRI offerings. End-user demographics are shifting, with an aging population in many APAC countries and a growing middle class demanding more accessible and advanced healthcare, including superior diagnostic imaging. Mergers and acquisitions (M&A) are also a notable trend, as larger companies seek to expand their product portfolios and geographical reach, strengthening their competitive positions. For instance, the volume of M&A deals in the APAC medical device sector has seen a steady increase, averaging around xx deals annually in the past five years. Innovation barriers are primarily related to high R&D costs and the stringent approval processes in key markets like China and Japan.
- Market Concentration: Moderately concentrated, with top 5 players accounting for approximately 65% of the market share in the Low and Mid-Field MRI systems segment.
- Technological Innovation: Driven by AI, portable MRI development, and improved image resolution.
- Regulatory Landscape: Varied across countries, with China and Japan having the most stringent approval processes.
- Competitive Landscape: Intense competition from advanced CT and ultrasound technologies.
- End-User Demographics: Aging population and increasing demand for advanced diagnostics.
- M&A Trends: Active consolidation and strategic partnerships to expand market presence.
APAC Medical Imaging Devices Industry Growth Trends & Insights
The APAC Medical Imaging Devices Industry, with a specific focus on Low and Mid-Field MRI systems, is poised for robust growth. Market size evolution is expected to be driven by increasing healthcare expenditure, rising prevalence of chronic diseases requiring advanced imaging, and government initiatives to improve healthcare infrastructure. The adoption rates for MRI, particularly in emerging economies within APAC, are projected to increase significantly. Technological disruptions, including the development of more affordable and portable MRI systems, are anticipated to democratize access to this critical diagnostic tool. Consumer behavior shifts are evident, with a growing awareness among patients about the benefits of early and accurate diagnosis, leading to higher demand for MRI scans. We project the APAC Medical Imaging Devices Industry for Low and Mid-Field MRI systems to witness a Compound Annual Growth Rate (CAGR) of xx% over the forecast period. The market penetration of MRI, currently at approximately xx% for the overall APAC region, is expected to rise to xx% by 2033, driven by expanding healthcare access in countries like India, Vietnam, and Indonesia. The base year market size for Low and Mid-Field MRI systems in APAC is estimated at $xxxx Million units in 2025. The projected market size for Low and Mid-Field MRI systems in APAC is expected to reach $xxxx Million units by the end of the forecast period in 2033. The adoption of AI-driven diagnostic tools within MRI systems will further enhance their utility and drive demand. The increasing disposable income in key APAC markets is also contributing to a growing demand for private healthcare services, which often include advanced imaging. The ongoing shift towards value-based healthcare is compelling providers to invest in technologies that offer better diagnostic accuracy and patient outcomes, further accelerating the adoption of advanced MRI solutions. The expansion of telehealth and remote diagnostics infrastructure will also play a crucial role in expanding the reach of MRI services to underserved areas.
Dominant Regions, Countries, or Segments in APAC Medical Imaging Devices Industry
The APAC Medical Imaging Devices Industry, specifically within the Modality: MRI (Low and Mid-Field MRI Systems) segment, is dominated by China. This dominance is attributed to its massive population, rapidly growing healthcare expenditure, increasing number of healthcare facilities, and significant government investment in upgrading medical infrastructure. The country’s proactive approach to adopting new medical technologies and its large domestic market provide a fertile ground for manufacturers of Low and Mid-Field MRI systems.
APAC Medical Imaging Devices Industry Product Landscape
The APAC Medical Imaging Devices Industry product landscape for Low and Mid-Field MRI systems is characterized by a surge in innovations focused on enhanced affordability, portability, and ease of use. Manufacturers are increasingly developing compact MRI scanners that require less infrastructure and can be deployed in smaller clinics and remote areas. These systems offer improved image quality for specific diagnostic needs, such as musculoskeletal imaging and neurological assessments, at a lower cost compared to high-field MRI. Key advancements include the integration of AI for faster scan times and optimized image acquisition, as well as user-friendly interfaces designed for less specialized operators. The unique selling propositions revolve around their cost-effectiveness and accessibility, addressing the significant unmet need for advanced diagnostic imaging across the vast APAC region. Technological advancements are also focusing on reduced helium consumption and superconducting magnet technologies to lower operational costs.
Key Drivers, Barriers & Challenges in APAC Medical Imaging Devices Industry
The APAC Medical Imaging Devices Industry is propelled by several key drivers. Increasing healthcare expenditure across the region, coupled with a rising burden of chronic diseases like cancer and neurological disorders, necessitates advanced diagnostic tools like MRI. Government initiatives to expand healthcare access and upgrade medical infrastructure further fuel market growth. The growing awareness among the population about the importance of early diagnosis and the increasing adoption of advanced technologies by healthcare providers are significant economic and policy-driven factors. For instance, the Indonesian government's "Healthy Indonesia" program aims to expand access to quality healthcare services, indirectly boosting demand for medical imaging.
However, the industry faces significant challenges. The high cost of sophisticated MRI systems, even low and mid-field ones, remains a barrier for many developing nations within APAC. Stringent and varying regulatory approval processes across different countries can lead to extended market entry timelines and increased compliance costs. Supply chain disruptions, as witnessed in recent global events, can impact the availability and pricing of critical components. Intense competition from alternative imaging modalities like CT and ultrasound also poses a restraint. For example, the average regulatory approval time for a new medical device in China can range from 12 to 24 months.
Emerging Opportunities in APAC Medical Imaging Devices Industry
Emerging opportunities in the APAC Medical Imaging Devices Industry are abundant. The untapped potential in tier 2 and tier 3 cities across countries like India, Vietnam, and the Philippines presents a significant market for affordable and portable MRI solutions. Innovative applications of AI in MRI, such as automated image interpretation and predictive diagnostics, are creating new avenues for value creation. Evolving consumer preferences for preventative healthcare and early disease detection are driving demand for accessible diagnostic services. The development of specialized MRI systems for niche applications, such as point-of-care diagnostics and mobile imaging units, also represents a promising growth area.
Growth Accelerators in the APAC Medical Imaging Devices Industry Industry
Several catalysts are accelerating long-term growth in the APAC Medical Imaging Devices Industry. Technological breakthroughs in superconductivity, AI integration, and digital imaging are enhancing the capabilities and reducing the cost of MRI systems. Strategic partnerships between global manufacturers and local distributors are crucial for navigating diverse market landscapes and expanding geographical reach. Market expansion strategies, including the development of tiered product offerings tailored to different economic segments within APAC, will be key. The increasing focus on value-based healthcare, where outcomes and efficiency are paramount, will favor advanced imaging technologies that demonstrate superior diagnostic accuracy and cost-effectiveness.
Key Players Shaping the APAC Medical Imaging Devices Industry Market
- Esaote SpA
- Hologic Inc
- GE Healthcare
- Shanghai United Imaging Healthcare Co Ltd
- Koninklijke Philips N V
- Siemens AG
- FUJIFILM Holdings Corporation
- Carestream Health
- J Morita Corporation
- Canon Medical Systems Corporation
- Teknova Medical Systems Limited
- Shimadzu Corporation
Notable Milestones in APAC Medical Imaging Devices Industry Sector
- October 2022: Luxonus Inc. received approval to market its photoacoustic 3D imaging system in Japan, signaling innovation in advanced imaging technologies within the region.
- February 2022: Siemens Healthineers and Universal Medical Imaging signed a strategic collaboration agreement to improve image screening and disease diagnosis in China's primary healthcare facilities, highlighting the trend of global and local partnerships to enhance diagnostic capabilities.
In-Depth APAC Medical Imaging Devices Industry Market Outlook
The APAC Medical Imaging Devices Industry is projected to experience sustained and significant growth, driven by a convergence of favorable market dynamics and strategic opportunities. Future market potential is immense, particularly for Low and Mid-Field MRI systems, due to the vast unmet demand for advanced diagnostics across the region's diverse economies. Growth accelerators such as AI integration, advancements in portable MRI technology, and increasing healthcare infrastructure investments will continue to shape the market. Strategic opportunities lie in focusing on emerging economies, developing cost-effective solutions, and forging robust partnerships to navigate regulatory complexities and distribution challenges. The expanding middle class and the growing emphasis on preventative healthcare will further fuel the demand for accessible and reliable medical imaging services, positioning the APAC region as a critical hub for the global medical imaging devices industry.
APAC Medical Imaging Devices Industry Segmentation
-
1. Modality
-
1.1. MRI
- 1.1.1. Low and mid field MRI systems (<1.5 T)
- 1.1.2. High field MRI systems (1.5-3 T)
- 1.1.3. Very Hig
-
1.2. Computed Tomography
- 1.2.1. Low End Scanners (~16-Slice)
- 1.2.2. Mid Range Scanners (~64-Slice)
- 1.2.3. High End Scanners (128-Slice and More)
-
1.3. Ultrasound
- 1.3.1. 2D Ultrasound
- 1.3.2. 3D Ultrasound
- 1.3.3. Other Types of Ultrasound
-
1.4. X-Ray
- 1.4.1. Analog Systems
- 1.4.2. Digital Systems
-
1.5. Nuclear Imaging
- 1.5.1. Positron Emission Tomography (PET)
- 1.5.2. Single Photon Emission Computed Tomography (SPECT)
- 1.6. Fluoroscopy
- 1.7. Mammography
-
1.1. MRI
-
2. Application
- 2.1. Cardiology
- 2.2. Oncology
- 2.3. Neurology
- 2.4. Orthopedics
- 2.5. Gastroenterology
- 2.6. Gynecology
- 2.7. Other Applications
-
3. End-User
- 3.1. Hospital
- 3.2. Diagnostic Centers
- 3.3. Other End-Users
-
4. Geography
- 4.1. China
- 4.2. Japan
- 4.3. India
- 4.4. Australia
- 4.5. South Korea
- 4.6. Rest of Asia-Pacific
APAC Medical Imaging Devices Industry Segmentation By Geography
- 1. China
- 2. Japan
- 3. India
- 4. Australia
- 5. South Korea
- 6. Rest of Asia Pacific
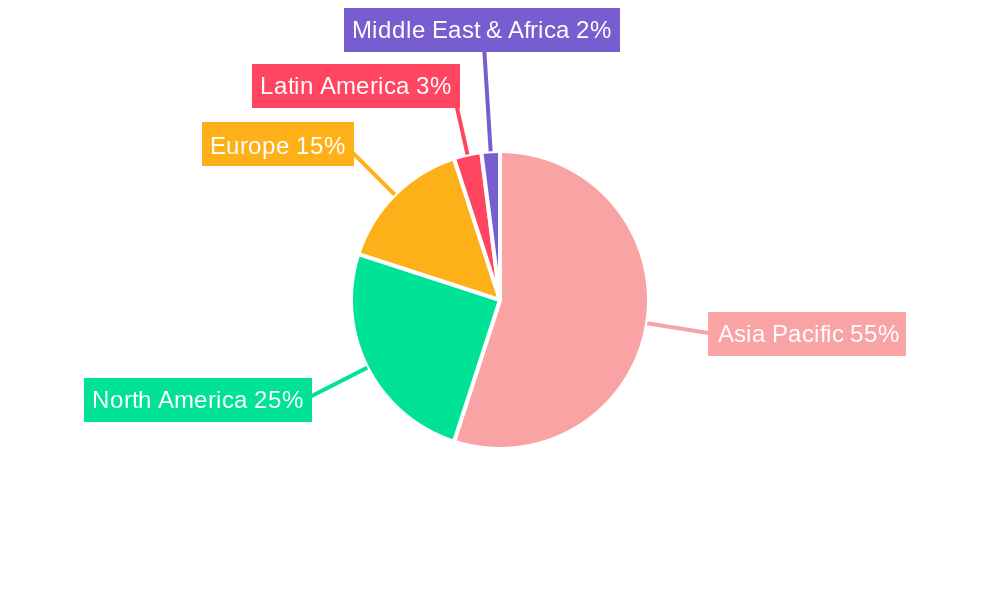
APAC Medical Imaging Devices Industry Regional Market Share
Geographic Coverage of APAC Medical Imaging Devices Industry
APAC Medical Imaging Devices Industry REPORT HIGHLIGHTS
| Aspects | Details |
|---|---|
| Study Period | 2020-2034 |
| Base Year | 2025 |
| Estimated Year | 2026 |
| Forecast Period | 2026-2034 |
| Historical Period | 2020-2025 |
| Growth Rate | CAGR of 8% from 2020-2034 |
| Segmentation |
|
Table of Contents
- 1. Introduction
- 1.1. Research Scope
- 1.2. Market Segmentation
- 1.3. Research Methodology
- 1.4. Definitions and Assumptions
- 2. Executive Summary
- 2.1. Introduction
- 3. Market Dynamics
- 3.1. Introduction
- 3.2. Market Drivers
- 3.2.1. Rising Prevalence of Chronic Diseases; Technological Advancement in Imaging Modalities; Growing Emphasis on Early Diagnosis
- 3.3. Market Restrains
- 3.3.1. Lack of Skilled Radiologist; High Cost of Advanced Diagnostic Imaging Devices
- 3.4. Market Trends
- 3.4.1. Oncology Segment is Expected to Witness a Healthy Growth in Coming Years
- 4. Market Factor Analysis
- 4.1. Porters Five Forces
- 4.2. Supply/Value Chain
- 4.3. PESTEL analysis
- 4.4. Market Entropy
- 4.5. Patent/Trademark Analysis
- 5. Global APAC Medical Imaging Devices Industry Analysis, Insights and Forecast, 2020-2032
- 5.1. Market Analysis, Insights and Forecast - by Modality
- 5.1.1. MRI
- 5.1.1.1. Low and mid field MRI systems (<1.5 T)
- 5.1.1.2. High field MRI systems (1.5-3 T)
- 5.1.1.3. Very Hig
- 5.1.2. Computed Tomography
- 5.1.2.1. Low End Scanners (~16-Slice)
- 5.1.2.2. Mid Range Scanners (~64-Slice)
- 5.1.2.3. High End Scanners (128-Slice and More)
- 5.1.3. Ultrasound
- 5.1.3.1. 2D Ultrasound
- 5.1.3.2. 3D Ultrasound
- 5.1.3.3. Other Types of Ultrasound
- 5.1.4. X-Ray
- 5.1.4.1. Analog Systems
- 5.1.4.2. Digital Systems
- 5.1.5. Nuclear Imaging
- 5.1.5.1. Positron Emission Tomography (PET)
- 5.1.5.2. Single Photon Emission Computed Tomography (SPECT)
- 5.1.6. Fluoroscopy
- 5.1.7. Mammography
- 5.1.1. MRI
- 5.2. Market Analysis, Insights and Forecast - by Application
- 5.2.1. Cardiology
- 5.2.2. Oncology
- 5.2.3. Neurology
- 5.2.4. Orthopedics
- 5.2.5. Gastroenterology
- 5.2.6. Gynecology
- 5.2.7. Other Applications
- 5.3. Market Analysis, Insights and Forecast - by End-User
- 5.3.1. Hospital
- 5.3.2. Diagnostic Centers
- 5.3.3. Other End-Users
- 5.4. Market Analysis, Insights and Forecast - by Geography
- 5.4.1. China
- 5.4.2. Japan
- 5.4.3. India
- 5.4.4. Australia
- 5.4.5. South Korea
- 5.4.6. Rest of Asia-Pacific
- 5.5. Market Analysis, Insights and Forecast - by Region
- 5.5.1. China
- 5.5.2. Japan
- 5.5.3. India
- 5.5.4. Australia
- 5.5.5. South Korea
- 5.5.6. Rest of Asia Pacific
- 5.1. Market Analysis, Insights and Forecast - by Modality
- 6. China APAC Medical Imaging Devices Industry Analysis, Insights and Forecast, 2020-2032
- 6.1. Market Analysis, Insights and Forecast - by Modality
- 6.1.1. MRI
- 6.1.1.1. Low and mid field MRI systems (<1.5 T)
- 6.1.1.2. High field MRI systems (1.5-3 T)
- 6.1.1.3. Very Hig
- 6.1.2. Computed Tomography
- 6.1.2.1. Low End Scanners (~16-Slice)
- 6.1.2.2. Mid Range Scanners (~64-Slice)
- 6.1.2.3. High End Scanners (128-Slice and More)
- 6.1.3. Ultrasound
- 6.1.3.1. 2D Ultrasound
- 6.1.3.2. 3D Ultrasound
- 6.1.3.3. Other Types of Ultrasound
- 6.1.4. X-Ray
- 6.1.4.1. Analog Systems
- 6.1.4.2. Digital Systems
- 6.1.5. Nuclear Imaging
- 6.1.5.1. Positron Emission Tomography (PET)
- 6.1.5.2. Single Photon Emission Computed Tomography (SPECT)
- 6.1.6. Fluoroscopy
- 6.1.7. Mammography
- 6.1.1. MRI
- 6.2. Market Analysis, Insights and Forecast - by Application
- 6.2.1. Cardiology
- 6.2.2. Oncology
- 6.2.3. Neurology
- 6.2.4. Orthopedics
- 6.2.5. Gastroenterology
- 6.2.6. Gynecology
- 6.2.7. Other Applications
- 6.3. Market Analysis, Insights and Forecast - by End-User
- 6.3.1. Hospital
- 6.3.2. Diagnostic Centers
- 6.3.3. Other End-Users
- 6.4. Market Analysis, Insights and Forecast - by Geography
- 6.4.1. China
- 6.4.2. Japan
- 6.4.3. India
- 6.4.4. Australia
- 6.4.5. South Korea
- 6.4.6. Rest of Asia-Pacific
- 6.1. Market Analysis, Insights and Forecast - by Modality
- 7. Japan APAC Medical Imaging Devices Industry Analysis, Insights and Forecast, 2020-2032
- 7.1. Market Analysis, Insights and Forecast - by Modality
- 7.1.1. MRI
- 7.1.1.1. Low and mid field MRI systems (<1.5 T)
- 7.1.1.2. High field MRI systems (1.5-3 T)
- 7.1.1.3. Very Hig
- 7.1.2. Computed Tomography
- 7.1.2.1. Low End Scanners (~16-Slice)
- 7.1.2.2. Mid Range Scanners (~64-Slice)
- 7.1.2.3. High End Scanners (128-Slice and More)
- 7.1.3. Ultrasound
- 7.1.3.1. 2D Ultrasound
- 7.1.3.2. 3D Ultrasound
- 7.1.3.3. Other Types of Ultrasound
- 7.1.4. X-Ray
- 7.1.4.1. Analog Systems
- 7.1.4.2. Digital Systems
- 7.1.5. Nuclear Imaging
- 7.1.5.1. Positron Emission Tomography (PET)
- 7.1.5.2. Single Photon Emission Computed Tomography (SPECT)
- 7.1.6. Fluoroscopy
- 7.1.7. Mammography
- 7.1.1. MRI
- 7.2. Market Analysis, Insights and Forecast - by Application
- 7.2.1. Cardiology
- 7.2.2. Oncology
- 7.2.3. Neurology
- 7.2.4. Orthopedics
- 7.2.5. Gastroenterology
- 7.2.6. Gynecology
- 7.2.7. Other Applications
- 7.3. Market Analysis, Insights and Forecast - by End-User
- 7.3.1. Hospital
- 7.3.2. Diagnostic Centers
- 7.3.3. Other End-Users
- 7.4. Market Analysis, Insights and Forecast - by Geography
- 7.4.1. China
- 7.4.2. Japan
- 7.4.3. India
- 7.4.4. Australia
- 7.4.5. South Korea
- 7.4.6. Rest of Asia-Pacific
- 7.1. Market Analysis, Insights and Forecast - by Modality
- 8. India APAC Medical Imaging Devices Industry Analysis, Insights and Forecast, 2020-2032
- 8.1. Market Analysis, Insights and Forecast - by Modality
- 8.1.1. MRI
- 8.1.1.1. Low and mid field MRI systems (<1.5 T)
- 8.1.1.2. High field MRI systems (1.5-3 T)
- 8.1.1.3. Very Hig
- 8.1.2. Computed Tomography
- 8.1.2.1. Low End Scanners (~16-Slice)
- 8.1.2.2. Mid Range Scanners (~64-Slice)
- 8.1.2.3. High End Scanners (128-Slice and More)
- 8.1.3. Ultrasound
- 8.1.3.1. 2D Ultrasound
- 8.1.3.2. 3D Ultrasound
- 8.1.3.3. Other Types of Ultrasound
- 8.1.4. X-Ray
- 8.1.4.1. Analog Systems
- 8.1.4.2. Digital Systems
- 8.1.5. Nuclear Imaging
- 8.1.5.1. Positron Emission Tomography (PET)
- 8.1.5.2. Single Photon Emission Computed Tomography (SPECT)
- 8.1.6. Fluoroscopy
- 8.1.7. Mammography
- 8.1.1. MRI
- 8.2. Market Analysis, Insights and Forecast - by Application
- 8.2.1. Cardiology
- 8.2.2. Oncology
- 8.2.3. Neurology
- 8.2.4. Orthopedics
- 8.2.5. Gastroenterology
- 8.2.6. Gynecology
- 8.2.7. Other Applications
- 8.3. Market Analysis, Insights and Forecast - by End-User
- 8.3.1. Hospital
- 8.3.2. Diagnostic Centers
- 8.3.3. Other End-Users
- 8.4. Market Analysis, Insights and Forecast - by Geography
- 8.4.1. China
- 8.4.2. Japan
- 8.4.3. India
- 8.4.4. Australia
- 8.4.5. South Korea
- 8.4.6. Rest of Asia-Pacific
- 8.1. Market Analysis, Insights and Forecast - by Modality
- 9. Australia APAC Medical Imaging Devices Industry Analysis, Insights and Forecast, 2020-2032
- 9.1. Market Analysis, Insights and Forecast - by Modality
- 9.1.1. MRI
- 9.1.1.1. Low and mid field MRI systems (<1.5 T)
- 9.1.1.2. High field MRI systems (1.5-3 T)
- 9.1.1.3. Very Hig
- 9.1.2. Computed Tomography
- 9.1.2.1. Low End Scanners (~16-Slice)
- 9.1.2.2. Mid Range Scanners (~64-Slice)
- 9.1.2.3. High End Scanners (128-Slice and More)
- 9.1.3. Ultrasound
- 9.1.3.1. 2D Ultrasound
- 9.1.3.2. 3D Ultrasound
- 9.1.3.3. Other Types of Ultrasound
- 9.1.4. X-Ray
- 9.1.4.1. Analog Systems
- 9.1.4.2. Digital Systems
- 9.1.5. Nuclear Imaging
- 9.1.5.1. Positron Emission Tomography (PET)
- 9.1.5.2. Single Photon Emission Computed Tomography (SPECT)
- 9.1.6. Fluoroscopy
- 9.1.7. Mammography
- 9.1.1. MRI
- 9.2. Market Analysis, Insights and Forecast - by Application
- 9.2.1. Cardiology
- 9.2.2. Oncology
- 9.2.3. Neurology
- 9.2.4. Orthopedics
- 9.2.5. Gastroenterology
- 9.2.6. Gynecology
- 9.2.7. Other Applications
- 9.3. Market Analysis, Insights and Forecast - by End-User
- 9.3.1. Hospital
- 9.3.2. Diagnostic Centers
- 9.3.3. Other End-Users
- 9.4. Market Analysis, Insights and Forecast - by Geography
- 9.4.1. China
- 9.4.2. Japan
- 9.4.3. India
- 9.4.4. Australia
- 9.4.5. South Korea
- 9.4.6. Rest of Asia-Pacific
- 9.1. Market Analysis, Insights and Forecast - by Modality
- 10. South Korea APAC Medical Imaging Devices Industry Analysis, Insights and Forecast, 2020-2032
- 10.1. Market Analysis, Insights and Forecast - by Modality
- 10.1.1. MRI
- 10.1.1.1. Low and mid field MRI systems (<1.5 T)
- 10.1.1.2. High field MRI systems (1.5-3 T)
- 10.1.1.3. Very Hig
- 10.1.2. Computed Tomography
- 10.1.2.1. Low End Scanners (~16-Slice)
- 10.1.2.2. Mid Range Scanners (~64-Slice)
- 10.1.2.3. High End Scanners (128-Slice and More)
- 10.1.3. Ultrasound
- 10.1.3.1. 2D Ultrasound
- 10.1.3.2. 3D Ultrasound
- 10.1.3.3. Other Types of Ultrasound
- 10.1.4. X-Ray
- 10.1.4.1. Analog Systems
- 10.1.4.2. Digital Systems
- 10.1.5. Nuclear Imaging
- 10.1.5.1. Positron Emission Tomography (PET)
- 10.1.5.2. Single Photon Emission Computed Tomography (SPECT)
- 10.1.6. Fluoroscopy
- 10.1.7. Mammography
- 10.1.1. MRI
- 10.2. Market Analysis, Insights and Forecast - by Application
- 10.2.1. Cardiology
- 10.2.2. Oncology
- 10.2.3. Neurology
- 10.2.4. Orthopedics
- 10.2.5. Gastroenterology
- 10.2.6. Gynecology
- 10.2.7. Other Applications
- 10.3. Market Analysis, Insights and Forecast - by End-User
- 10.3.1. Hospital
- 10.3.2. Diagnostic Centers
- 10.3.3. Other End-Users
- 10.4. Market Analysis, Insights and Forecast - by Geography
- 10.4.1. China
- 10.4.2. Japan
- 10.4.3. India
- 10.4.4. Australia
- 10.4.5. South Korea
- 10.4.6. Rest of Asia-Pacific
- 10.1. Market Analysis, Insights and Forecast - by Modality
- 11. Rest of Asia Pacific APAC Medical Imaging Devices Industry Analysis, Insights and Forecast, 2020-2032
- 11.1. Market Analysis, Insights and Forecast - by Modality
- 11.1.1. MRI
- 11.1.1.1. Low and mid field MRI systems (<1.5 T)
- 11.1.1.2. High field MRI systems (1.5-3 T)
- 11.1.1.3. Very Hig
- 11.1.2. Computed Tomography
- 11.1.2.1. Low End Scanners (~16-Slice)
- 11.1.2.2. Mid Range Scanners (~64-Slice)
- 11.1.2.3. High End Scanners (128-Slice and More)
- 11.1.3. Ultrasound
- 11.1.3.1. 2D Ultrasound
- 11.1.3.2. 3D Ultrasound
- 11.1.3.3. Other Types of Ultrasound
- 11.1.4. X-Ray
- 11.1.4.1. Analog Systems
- 11.1.4.2. Digital Systems
- 11.1.5. Nuclear Imaging
- 11.1.5.1. Positron Emission Tomography (PET)
- 11.1.5.2. Single Photon Emission Computed Tomography (SPECT)
- 11.1.6. Fluoroscopy
- 11.1.7. Mammography
- 11.1.1. MRI
- 11.2. Market Analysis, Insights and Forecast - by Application
- 11.2.1. Cardiology
- 11.2.2. Oncology
- 11.2.3. Neurology
- 11.2.4. Orthopedics
- 11.2.5. Gastroenterology
- 11.2.6. Gynecology
- 11.2.7. Other Applications
- 11.3. Market Analysis, Insights and Forecast - by End-User
- 11.3.1. Hospital
- 11.3.2. Diagnostic Centers
- 11.3.3. Other End-Users
- 11.4. Market Analysis, Insights and Forecast - by Geography
- 11.4.1. China
- 11.4.2. Japan
- 11.4.3. India
- 11.4.4. Australia
- 11.4.5. South Korea
- 11.4.6. Rest of Asia-Pacific
- 11.1. Market Analysis, Insights and Forecast - by Modality
- 12. Competitive Analysis
- 12.1. Global Market Share Analysis 2025
- 12.2. Company Profiles
- 12.2.1 Esaote SpA
- 12.2.1.1. Overview
- 12.2.1.2. Products
- 12.2.1.3. SWOT Analysis
- 12.2.1.4. Recent Developments
- 12.2.1.5. Financials (Based on Availability)
- 12.2.2 Hologic Inc
- 12.2.2.1. Overview
- 12.2.2.2. Products
- 12.2.2.3. SWOT Analysis
- 12.2.2.4. Recent Developments
- 12.2.2.5. Financials (Based on Availability)
- 12.2.3 GE Healthcare
- 12.2.3.1. Overview
- 12.2.3.2. Products
- 12.2.3.3. SWOT Analysis
- 12.2.3.4. Recent Developments
- 12.2.3.5. Financials (Based on Availability)
- 12.2.4 Shanghai United Imaging Healthcare Co Ltd
- 12.2.4.1. Overview
- 12.2.4.2. Products
- 12.2.4.3. SWOT Analysis
- 12.2.4.4. Recent Developments
- 12.2.4.5. Financials (Based on Availability)
- 12.2.5 Koninklijke Philips N V
- 12.2.5.1. Overview
- 12.2.5.2. Products
- 12.2.5.3. SWOT Analysis
- 12.2.5.4. Recent Developments
- 12.2.5.5. Financials (Based on Availability)
- 12.2.6 Siemens AG
- 12.2.6.1. Overview
- 12.2.6.2. Products
- 12.2.6.3. SWOT Analysis
- 12.2.6.4. Recent Developments
- 12.2.6.5. Financials (Based on Availability)
- 12.2.7 FUJIFILM Holdings Corporation
- 12.2.7.1. Overview
- 12.2.7.2. Products
- 12.2.7.3. SWOT Analysis
- 12.2.7.4. Recent Developments
- 12.2.7.5. Financials (Based on Availability)
- 12.2.8 Carestream Health
- 12.2.8.1. Overview
- 12.2.8.2. Products
- 12.2.8.3. SWOT Analysis
- 12.2.8.4. Recent Developments
- 12.2.8.5. Financials (Based on Availability)
- 12.2.9 J Morita Corporation
- 12.2.9.1. Overview
- 12.2.9.2. Products
- 12.2.9.3. SWOT Analysis
- 12.2.9.4. Recent Developments
- 12.2.9.5. Financials (Based on Availability)
- 12.2.10 Canon Medical Systems Corporation
- 12.2.10.1. Overview
- 12.2.10.2. Products
- 12.2.10.3. SWOT Analysis
- 12.2.10.4. Recent Developments
- 12.2.10.5. Financials (Based on Availability)
- 12.2.11 Teknova Medical Systems Limited
- 12.2.11.1. Overview
- 12.2.11.2. Products
- 12.2.11.3. SWOT Analysis
- 12.2.11.4. Recent Developments
- 12.2.11.5. Financials (Based on Availability)
- 12.2.12 Shimadzu Corporation
- 12.2.12.1. Overview
- 12.2.12.2. Products
- 12.2.12.3. SWOT Analysis
- 12.2.12.4. Recent Developments
- 12.2.12.5. Financials (Based on Availability)
- 12.2.1 Esaote SpA
List of Figures
- Figure 1: Global APAC Medical Imaging Devices Industry Revenue Breakdown (billion, %) by Region 2025 & 2033
- Figure 2: Global APAC Medical Imaging Devices Industry Volume Breakdown (K Unit, %) by Region 2025 & 2033
- Figure 3: China APAC Medical Imaging Devices Industry Revenue (billion), by Modality 2025 & 2033
- Figure 4: China APAC Medical Imaging Devices Industry Volume (K Unit), by Modality 2025 & 2033
- Figure 5: China APAC Medical Imaging Devices Industry Revenue Share (%), by Modality 2025 & 2033
- Figure 6: China APAC Medical Imaging Devices Industry Volume Share (%), by Modality 2025 & 2033
- Figure 7: China APAC Medical Imaging Devices Industry Revenue (billion), by Application 2025 & 2033
- Figure 8: China APAC Medical Imaging Devices Industry Volume (K Unit), by Application 2025 & 2033
- Figure 9: China APAC Medical Imaging Devices Industry Revenue Share (%), by Application 2025 & 2033
- Figure 10: China APAC Medical Imaging Devices Industry Volume Share (%), by Application 2025 & 2033
- Figure 11: China APAC Medical Imaging Devices Industry Revenue (billion), by End-User 2025 & 2033
- Figure 12: China APAC Medical Imaging Devices Industry Volume (K Unit), by End-User 2025 & 2033
- Figure 13: China APAC Medical Imaging Devices Industry Revenue Share (%), by End-User 2025 & 2033
- Figure 14: China APAC Medical Imaging Devices Industry Volume Share (%), by End-User 2025 & 2033
- Figure 15: China APAC Medical Imaging Devices Industry Revenue (billion), by Geography 2025 & 2033
- Figure 16: China APAC Medical Imaging Devices Industry Volume (K Unit), by Geography 2025 & 2033
- Figure 17: China APAC Medical Imaging Devices Industry Revenue Share (%), by Geography 2025 & 2033
- Figure 18: China APAC Medical Imaging Devices Industry Volume Share (%), by Geography 2025 & 2033
- Figure 19: China APAC Medical Imaging Devices Industry Revenue (billion), by Country 2025 & 2033
- Figure 20: China APAC Medical Imaging Devices Industry Volume (K Unit), by Country 2025 & 2033
- Figure 21: China APAC Medical Imaging Devices Industry Revenue Share (%), by Country 2025 & 2033
- Figure 22: China APAC Medical Imaging Devices Industry Volume Share (%), by Country 2025 & 2033
- Figure 23: Japan APAC Medical Imaging Devices Industry Revenue (billion), by Modality 2025 & 2033
- Figure 24: Japan APAC Medical Imaging Devices Industry Volume (K Unit), by Modality 2025 & 2033
- Figure 25: Japan APAC Medical Imaging Devices Industry Revenue Share (%), by Modality 2025 & 2033
- Figure 26: Japan APAC Medical Imaging Devices Industry Volume Share (%), by Modality 2025 & 2033
- Figure 27: Japan APAC Medical Imaging Devices Industry Revenue (billion), by Application 2025 & 2033
- Figure 28: Japan APAC Medical Imaging Devices Industry Volume (K Unit), by Application 2025 & 2033
- Figure 29: Japan APAC Medical Imaging Devices Industry Revenue Share (%), by Application 2025 & 2033
- Figure 30: Japan APAC Medical Imaging Devices Industry Volume Share (%), by Application 2025 & 2033
- Figure 31: Japan APAC Medical Imaging Devices Industry Revenue (billion), by End-User 2025 & 2033
- Figure 32: Japan APAC Medical Imaging Devices Industry Volume (K Unit), by End-User 2025 & 2033
- Figure 33: Japan APAC Medical Imaging Devices Industry Revenue Share (%), by End-User 2025 & 2033
- Figure 34: Japan APAC Medical Imaging Devices Industry Volume Share (%), by End-User 2025 & 2033
- Figure 35: Japan APAC Medical Imaging Devices Industry Revenue (billion), by Geography 2025 & 2033
- Figure 36: Japan APAC Medical Imaging Devices Industry Volume (K Unit), by Geography 2025 & 2033
- Figure 37: Japan APAC Medical Imaging Devices Industry Revenue Share (%), by Geography 2025 & 2033
- Figure 38: Japan APAC Medical Imaging Devices Industry Volume Share (%), by Geography 2025 & 2033
- Figure 39: Japan APAC Medical Imaging Devices Industry Revenue (billion), by Country 2025 & 2033
- Figure 40: Japan APAC Medical Imaging Devices Industry Volume (K Unit), by Country 2025 & 2033
- Figure 41: Japan APAC Medical Imaging Devices Industry Revenue Share (%), by Country 2025 & 2033
- Figure 42: Japan APAC Medical Imaging Devices Industry Volume Share (%), by Country 2025 & 2033
- Figure 43: India APAC Medical Imaging Devices Industry Revenue (billion), by Modality 2025 & 2033
- Figure 44: India APAC Medical Imaging Devices Industry Volume (K Unit), by Modality 2025 & 2033
- Figure 45: India APAC Medical Imaging Devices Industry Revenue Share (%), by Modality 2025 & 2033
- Figure 46: India APAC Medical Imaging Devices Industry Volume Share (%), by Modality 2025 & 2033
- Figure 47: India APAC Medical Imaging Devices Industry Revenue (billion), by Application 2025 & 2033
- Figure 48: India APAC Medical Imaging Devices Industry Volume (K Unit), by Application 2025 & 2033
- Figure 49: India APAC Medical Imaging Devices Industry Revenue Share (%), by Application 2025 & 2033
- Figure 50: India APAC Medical Imaging Devices Industry Volume Share (%), by Application 2025 & 2033
- Figure 51: India APAC Medical Imaging Devices Industry Revenue (billion), by End-User 2025 & 2033
- Figure 52: India APAC Medical Imaging Devices Industry Volume (K Unit), by End-User 2025 & 2033
- Figure 53: India APAC Medical Imaging Devices Industry Revenue Share (%), by End-User 2025 & 2033
- Figure 54: India APAC Medical Imaging Devices Industry Volume Share (%), by End-User 2025 & 2033
- Figure 55: India APAC Medical Imaging Devices Industry Revenue (billion), by Geography 2025 & 2033
- Figure 56: India APAC Medical Imaging Devices Industry Volume (K Unit), by Geography 2025 & 2033
- Figure 57: India APAC Medical Imaging Devices Industry Revenue Share (%), by Geography 2025 & 2033
- Figure 58: India APAC Medical Imaging Devices Industry Volume Share (%), by Geography 2025 & 2033
- Figure 59: India APAC Medical Imaging Devices Industry Revenue (billion), by Country 2025 & 2033
- Figure 60: India APAC Medical Imaging Devices Industry Volume (K Unit), by Country 2025 & 2033
- Figure 61: India APAC Medical Imaging Devices Industry Revenue Share (%), by Country 2025 & 2033
- Figure 62: India APAC Medical Imaging Devices Industry Volume Share (%), by Country 2025 & 2033
- Figure 63: Australia APAC Medical Imaging Devices Industry Revenue (billion), by Modality 2025 & 2033
- Figure 64: Australia APAC Medical Imaging Devices Industry Volume (K Unit), by Modality 2025 & 2033
- Figure 65: Australia APAC Medical Imaging Devices Industry Revenue Share (%), by Modality 2025 & 2033
- Figure 66: Australia APAC Medical Imaging Devices Industry Volume Share (%), by Modality 2025 & 2033
- Figure 67: Australia APAC Medical Imaging Devices Industry Revenue (billion), by Application 2025 & 2033
- Figure 68: Australia APAC Medical Imaging Devices Industry Volume (K Unit), by Application 2025 & 2033
- Figure 69: Australia APAC Medical Imaging Devices Industry Revenue Share (%), by Application 2025 & 2033
- Figure 70: Australia APAC Medical Imaging Devices Industry Volume Share (%), by Application 2025 & 2033
- Figure 71: Australia APAC Medical Imaging Devices Industry Revenue (billion), by End-User 2025 & 2033
- Figure 72: Australia APAC Medical Imaging Devices Industry Volume (K Unit), by End-User 2025 & 2033
- Figure 73: Australia APAC Medical Imaging Devices Industry Revenue Share (%), by End-User 2025 & 2033
- Figure 74: Australia APAC Medical Imaging Devices Industry Volume Share (%), by End-User 2025 & 2033
- Figure 75: Australia APAC Medical Imaging Devices Industry Revenue (billion), by Geography 2025 & 2033
- Figure 76: Australia APAC Medical Imaging Devices Industry Volume (K Unit), by Geography 2025 & 2033
- Figure 77: Australia APAC Medical Imaging Devices Industry Revenue Share (%), by Geography 2025 & 2033
- Figure 78: Australia APAC Medical Imaging Devices Industry Volume Share (%), by Geography 2025 & 2033
- Figure 79: Australia APAC Medical Imaging Devices Industry Revenue (billion), by Country 2025 & 2033
- Figure 80: Australia APAC Medical Imaging Devices Industry Volume (K Unit), by Country 2025 & 2033
- Figure 81: Australia APAC Medical Imaging Devices Industry Revenue Share (%), by Country 2025 & 2033
- Figure 82: Australia APAC Medical Imaging Devices Industry Volume Share (%), by Country 2025 & 2033
- Figure 83: South Korea APAC Medical Imaging Devices Industry Revenue (billion), by Modality 2025 & 2033
- Figure 84: South Korea APAC Medical Imaging Devices Industry Volume (K Unit), by Modality 2025 & 2033
- Figure 85: South Korea APAC Medical Imaging Devices Industry Revenue Share (%), by Modality 2025 & 2033
- Figure 86: South Korea APAC Medical Imaging Devices Industry Volume Share (%), by Modality 2025 & 2033
- Figure 87: South Korea APAC Medical Imaging Devices Industry Revenue (billion), by Application 2025 & 2033
- Figure 88: South Korea APAC Medical Imaging Devices Industry Volume (K Unit), by Application 2025 & 2033
- Figure 89: South Korea APAC Medical Imaging Devices Industry Revenue Share (%), by Application 2025 & 2033
- Figure 90: South Korea APAC Medical Imaging Devices Industry Volume Share (%), by Application 2025 & 2033
- Figure 91: South Korea APAC Medical Imaging Devices Industry Revenue (billion), by End-User 2025 & 2033
- Figure 92: South Korea APAC Medical Imaging Devices Industry Volume (K Unit), by End-User 2025 & 2033
- Figure 93: South Korea APAC Medical Imaging Devices Industry Revenue Share (%), by End-User 2025 & 2033
- Figure 94: South Korea APAC Medical Imaging Devices Industry Volume Share (%), by End-User 2025 & 2033
- Figure 95: South Korea APAC Medical Imaging Devices Industry Revenue (billion), by Geography 2025 & 2033
- Figure 96: South Korea APAC Medical Imaging Devices Industry Volume (K Unit), by Geography 2025 & 2033
- Figure 97: South Korea APAC Medical Imaging Devices Industry Revenue Share (%), by Geography 2025 & 2033
- Figure 98: South Korea APAC Medical Imaging Devices Industry Volume Share (%), by Geography 2025 & 2033
- Figure 99: South Korea APAC Medical Imaging Devices Industry Revenue (billion), by Country 2025 & 2033
- Figure 100: South Korea APAC Medical Imaging Devices Industry Volume (K Unit), by Country 2025 & 2033
- Figure 101: South Korea APAC Medical Imaging Devices Industry Revenue Share (%), by Country 2025 & 2033
- Figure 102: South Korea APAC Medical Imaging Devices Industry Volume Share (%), by Country 2025 & 2033
- Figure 103: Rest of Asia Pacific APAC Medical Imaging Devices Industry Revenue (billion), by Modality 2025 & 2033
- Figure 104: Rest of Asia Pacific APAC Medical Imaging Devices Industry Volume (K Unit), by Modality 2025 & 2033
- Figure 105: Rest of Asia Pacific APAC Medical Imaging Devices Industry Revenue Share (%), by Modality 2025 & 2033
- Figure 106: Rest of Asia Pacific APAC Medical Imaging Devices Industry Volume Share (%), by Modality 2025 & 2033
- Figure 107: Rest of Asia Pacific APAC Medical Imaging Devices Industry Revenue (billion), by Application 2025 & 2033
- Figure 108: Rest of Asia Pacific APAC Medical Imaging Devices Industry Volume (K Unit), by Application 2025 & 2033
- Figure 109: Rest of Asia Pacific APAC Medical Imaging Devices Industry Revenue Share (%), by Application 2025 & 2033
- Figure 110: Rest of Asia Pacific APAC Medical Imaging Devices Industry Volume Share (%), by Application 2025 & 2033
- Figure 111: Rest of Asia Pacific APAC Medical Imaging Devices Industry Revenue (billion), by End-User 2025 & 2033
- Figure 112: Rest of Asia Pacific APAC Medical Imaging Devices Industry Volume (K Unit), by End-User 2025 & 2033
- Figure 113: Rest of Asia Pacific APAC Medical Imaging Devices Industry Revenue Share (%), by End-User 2025 & 2033
- Figure 114: Rest of Asia Pacific APAC Medical Imaging Devices Industry Volume Share (%), by End-User 2025 & 2033
- Figure 115: Rest of Asia Pacific APAC Medical Imaging Devices Industry Revenue (billion), by Geography 2025 & 2033
- Figure 116: Rest of Asia Pacific APAC Medical Imaging Devices Industry Volume (K Unit), by Geography 2025 & 2033
- Figure 117: Rest of Asia Pacific APAC Medical Imaging Devices Industry Revenue Share (%), by Geography 2025 & 2033
- Figure 118: Rest of Asia Pacific APAC Medical Imaging Devices Industry Volume Share (%), by Geography 2025 & 2033
- Figure 119: Rest of Asia Pacific APAC Medical Imaging Devices Industry Revenue (billion), by Country 2025 & 2033
- Figure 120: Rest of Asia Pacific APAC Medical Imaging Devices Industry Volume (K Unit), by Country 2025 & 2033
- Figure 121: Rest of Asia Pacific APAC Medical Imaging Devices Industry Revenue Share (%), by Country 2025 & 2033
- Figure 122: Rest of Asia Pacific APAC Medical Imaging Devices Industry Volume Share (%), by Country 2025 & 2033
List of Tables
- Table 1: Global APAC Medical Imaging Devices Industry Revenue billion Forecast, by Modality 2020 & 2033
- Table 2: Global APAC Medical Imaging Devices Industry Volume K Unit Forecast, by Modality 2020 & 2033
- Table 3: Global APAC Medical Imaging Devices Industry Revenue billion Forecast, by Application 2020 & 2033
- Table 4: Global APAC Medical Imaging Devices Industry Volume K Unit Forecast, by Application 2020 & 2033
- Table 5: Global APAC Medical Imaging Devices Industry Revenue billion Forecast, by End-User 2020 & 2033
- Table 6: Global APAC Medical Imaging Devices Industry Volume K Unit Forecast, by End-User 2020 & 2033
- Table 7: Global APAC Medical Imaging Devices Industry Revenue billion Forecast, by Geography 2020 & 2033
- Table 8: Global APAC Medical Imaging Devices Industry Volume K Unit Forecast, by Geography 2020 & 2033
- Table 9: Global APAC Medical Imaging Devices Industry Revenue billion Forecast, by Region 2020 & 2033
- Table 10: Global APAC Medical Imaging Devices Industry Volume K Unit Forecast, by Region 2020 & 2033
- Table 11: Global APAC Medical Imaging Devices Industry Revenue billion Forecast, by Modality 2020 & 2033
- Table 12: Global APAC Medical Imaging Devices Industry Volume K Unit Forecast, by Modality 2020 & 2033
- Table 13: Global APAC Medical Imaging Devices Industry Revenue billion Forecast, by Application 2020 & 2033
- Table 14: Global APAC Medical Imaging Devices Industry Volume K Unit Forecast, by Application 2020 & 2033
- Table 15: Global APAC Medical Imaging Devices Industry Revenue billion Forecast, by End-User 2020 & 2033
- Table 16: Global APAC Medical Imaging Devices Industry Volume K Unit Forecast, by End-User 2020 & 2033
- Table 17: Global APAC Medical Imaging Devices Industry Revenue billion Forecast, by Geography 2020 & 2033
- Table 18: Global APAC Medical Imaging Devices Industry Volume K Unit Forecast, by Geography 2020 & 2033
- Table 19: Global APAC Medical Imaging Devices Industry Revenue billion Forecast, by Country 2020 & 2033
- Table 20: Global APAC Medical Imaging Devices Industry Volume K Unit Forecast, by Country 2020 & 2033
- Table 21: Global APAC Medical Imaging Devices Industry Revenue billion Forecast, by Modality 2020 & 2033
- Table 22: Global APAC Medical Imaging Devices Industry Volume K Unit Forecast, by Modality 2020 & 2033
- Table 23: Global APAC Medical Imaging Devices Industry Revenue billion Forecast, by Application 2020 & 2033
- Table 24: Global APAC Medical Imaging Devices Industry Volume K Unit Forecast, by Application 2020 & 2033
- Table 25: Global APAC Medical Imaging Devices Industry Revenue billion Forecast, by End-User 2020 & 2033
- Table 26: Global APAC Medical Imaging Devices Industry Volume K Unit Forecast, by End-User 2020 & 2033
- Table 27: Global APAC Medical Imaging Devices Industry Revenue billion Forecast, by Geography 2020 & 2033
- Table 28: Global APAC Medical Imaging Devices Industry Volume K Unit Forecast, by Geography 2020 & 2033
- Table 29: Global APAC Medical Imaging Devices Industry Revenue billion Forecast, by Country 2020 & 2033
- Table 30: Global APAC Medical Imaging Devices Industry Volume K Unit Forecast, by Country 2020 & 2033
- Table 31: Global APAC Medical Imaging Devices Industry Revenue billion Forecast, by Modality 2020 & 2033
- Table 32: Global APAC Medical Imaging Devices Industry Volume K Unit Forecast, by Modality 2020 & 2033
- Table 33: Global APAC Medical Imaging Devices Industry Revenue billion Forecast, by Application 2020 & 2033
- Table 34: Global APAC Medical Imaging Devices Industry Volume K Unit Forecast, by Application 2020 & 2033
- Table 35: Global APAC Medical Imaging Devices Industry Revenue billion Forecast, by End-User 2020 & 2033
- Table 36: Global APAC Medical Imaging Devices Industry Volume K Unit Forecast, by End-User 2020 & 2033
- Table 37: Global APAC Medical Imaging Devices Industry Revenue billion Forecast, by Geography 2020 & 2033
- Table 38: Global APAC Medical Imaging Devices Industry Volume K Unit Forecast, by Geography 2020 & 2033
- Table 39: Global APAC Medical Imaging Devices Industry Revenue billion Forecast, by Country 2020 & 2033
- Table 40: Global APAC Medical Imaging Devices Industry Volume K Unit Forecast, by Country 2020 & 2033
- Table 41: Global APAC Medical Imaging Devices Industry Revenue billion Forecast, by Modality 2020 & 2033
- Table 42: Global APAC Medical Imaging Devices Industry Volume K Unit Forecast, by Modality 2020 & 2033
- Table 43: Global APAC Medical Imaging Devices Industry Revenue billion Forecast, by Application 2020 & 2033
- Table 44: Global APAC Medical Imaging Devices Industry Volume K Unit Forecast, by Application 2020 & 2033
- Table 45: Global APAC Medical Imaging Devices Industry Revenue billion Forecast, by End-User 2020 & 2033
- Table 46: Global APAC Medical Imaging Devices Industry Volume K Unit Forecast, by End-User 2020 & 2033
- Table 47: Global APAC Medical Imaging Devices Industry Revenue billion Forecast, by Geography 2020 & 2033
- Table 48: Global APAC Medical Imaging Devices Industry Volume K Unit Forecast, by Geography 2020 & 2033
- Table 49: Global APAC Medical Imaging Devices Industry Revenue billion Forecast, by Country 2020 & 2033
- Table 50: Global APAC Medical Imaging Devices Industry Volume K Unit Forecast, by Country 2020 & 2033
- Table 51: Global APAC Medical Imaging Devices Industry Revenue billion Forecast, by Modality 2020 & 2033
- Table 52: Global APAC Medical Imaging Devices Industry Volume K Unit Forecast, by Modality 2020 & 2033
- Table 53: Global APAC Medical Imaging Devices Industry Revenue billion Forecast, by Application 2020 & 2033
- Table 54: Global APAC Medical Imaging Devices Industry Volume K Unit Forecast, by Application 2020 & 2033
- Table 55: Global APAC Medical Imaging Devices Industry Revenue billion Forecast, by End-User 2020 & 2033
- Table 56: Global APAC Medical Imaging Devices Industry Volume K Unit Forecast, by End-User 2020 & 2033
- Table 57: Global APAC Medical Imaging Devices Industry Revenue billion Forecast, by Geography 2020 & 2033
- Table 58: Global APAC Medical Imaging Devices Industry Volume K Unit Forecast, by Geography 2020 & 2033
- Table 59: Global APAC Medical Imaging Devices Industry Revenue billion Forecast, by Country 2020 & 2033
- Table 60: Global APAC Medical Imaging Devices Industry Volume K Unit Forecast, by Country 2020 & 2033
- Table 61: Global APAC Medical Imaging Devices Industry Revenue billion Forecast, by Modality 2020 & 2033
- Table 62: Global APAC Medical Imaging Devices Industry Volume K Unit Forecast, by Modality 2020 & 2033
- Table 63: Global APAC Medical Imaging Devices Industry Revenue billion Forecast, by Application 2020 & 2033
- Table 64: Global APAC Medical Imaging Devices Industry Volume K Unit Forecast, by Application 2020 & 2033
- Table 65: Global APAC Medical Imaging Devices Industry Revenue billion Forecast, by End-User 2020 & 2033
- Table 66: Global APAC Medical Imaging Devices Industry Volume K Unit Forecast, by End-User 2020 & 2033
- Table 67: Global APAC Medical Imaging Devices Industry Revenue billion Forecast, by Geography 2020 & 2033
- Table 68: Global APAC Medical Imaging Devices Industry Volume K Unit Forecast, by Geography 2020 & 2033
- Table 69: Global APAC Medical Imaging Devices Industry Revenue billion Forecast, by Country 2020 & 2033
- Table 70: Global APAC Medical Imaging Devices Industry Volume K Unit Forecast, by Country 2020 & 2033
Frequently Asked Questions
1. What is the projected Compound Annual Growth Rate (CAGR) of the APAC Medical Imaging Devices Industry?
The projected CAGR is approximately 8%.
2. Which companies are prominent players in the APAC Medical Imaging Devices Industry?
Key companies in the market include Esaote SpA, Hologic Inc, GE Healthcare, Shanghai United Imaging Healthcare Co Ltd, Koninklijke Philips N V, Siemens AG, FUJIFILM Holdings Corporation, Carestream Health, J Morita Corporation, Canon Medical Systems Corporation, Teknova Medical Systems Limited, Shimadzu Corporation.
3. What are the main segments of the APAC Medical Imaging Devices Industry?
The market segments include Modality, Application, End-User, Geography.
4. Can you provide details about the market size?
The market size is estimated to be USD 143.12 billion as of 2022.
5. What are some drivers contributing to market growth?
Rising Prevalence of Chronic Diseases; Technological Advancement in Imaging Modalities; Growing Emphasis on Early Diagnosis.
6. What are the notable trends driving market growth?
Oncology Segment is Expected to Witness a Healthy Growth in Coming Years.
7. Are there any restraints impacting market growth?
Lack of Skilled Radiologist; High Cost of Advanced Diagnostic Imaging Devices.
8. Can you provide examples of recent developments in the market?
October 2022: Luxonus Inc. received approval to market its photoacoustic 3D imaging system in Japan.
9. What pricing options are available for accessing the report?
Pricing options include single-user, multi-user, and enterprise licenses priced at USD 4750, USD 5250, and USD 8750 respectively.
10. Is the market size provided in terms of value or volume?
The market size is provided in terms of value, measured in billion and volume, measured in K Unit.
11. Are there any specific market keywords associated with the report?
Yes, the market keyword associated with the report is "APAC Medical Imaging Devices Industry," which aids in identifying and referencing the specific market segment covered.
12. How do I determine which pricing option suits my needs best?
The pricing options vary based on user requirements and access needs. Individual users may opt for single-user licenses, while businesses requiring broader access may choose multi-user or enterprise licenses for cost-effective access to the report.
13. Are there any additional resources or data provided in the APAC Medical Imaging Devices Industry report?
While the report offers comprehensive insights, it's advisable to review the specific contents or supplementary materials provided to ascertain if additional resources or data are available.
14. How can I stay updated on further developments or reports in the APAC Medical Imaging Devices Industry?
To stay informed about further developments, trends, and reports in the APAC Medical Imaging Devices Industry, consider subscribing to industry newsletters, following relevant companies and organizations, or regularly checking reputable industry news sources and publications.
Methodology
Step 1 - Identification of Relevant Samples Size from Population Database


Step 2 - Approaches for Defining Global Market Size (Value, Volume* & Price*)

Note*: In applicable scenarios
Step 3 - Data Sources
Primary Research
- Web Analytics
- Survey Reports
- Research Institute
- Latest Research Reports
- Opinion Leaders
Secondary Research
- Annual Reports
- White Paper
- Latest Press Release
- Industry Association
- Paid Database
- Investor Presentations

Step 4 - Data Triangulation
Involves using different sources of information in order to increase the validity of a study
These sources are likely to be stakeholders in a program - participants, other researchers, program staff, other community members, and so on.
Then we put all data in single framework & apply various statistical tools to find out the dynamic on the market.
During the analysis stage, feedback from the stakeholder groups would be compared to determine areas of agreement as well as areas of divergence