

Key Insights
The Asia-Pacific (APAC) mobile payments industry is experiencing explosive growth, driven by factors such as rising smartphone penetration, increasing internet and mobile data usage, and the expanding adoption of digital financial services across diverse demographics. A significant contributor to this growth is the region's large and increasingly tech-savvy population, particularly in countries like China and India, where mobile payments are rapidly replacing traditional cash transactions. The convenience and security offered by mobile payment platforms, coupled with government initiatives promoting digitalization, have fueled this rapid expansion. The BFSI (Banking, Financial Services, and Insurance) sector is a major driver, actively promoting mobile payment solutions to enhance customer experience and efficiency. Other key end-user industries, including retail, e-commerce, and transportation, are also substantially contributing to the market's growth, integrating mobile payment options into their operations. The segment by type, specifically proximity and remote payment systems, shows balanced growth, with contactless payments showing a particularly strong upward trend. Competition amongst major players like Alipay, WeChat Pay, and international giants like Visa and Mastercard is fierce, leading to continuous innovation and improved service offerings for consumers. While regulatory challenges and concerns regarding data security exist, the overall market outlook remains extremely positive, projecting sustained high growth over the forecast period.
The APAC mobile payment market's segmentation reveals significant variations across countries. China and India, with their massive populations and vibrant digital economies, dominate the market share. However, other countries like Japan, South Korea, and the rapidly developing Southeast Asian nations are witnessing significant growth, contributing to the overall expansion of the regional market. The continued expansion of e-commerce, the increasing adoption of mobile wallets, and the growing preference for cashless transactions further bolster the projected growth. While the North American and European markets are also mature, the APAC region's unique demographics and growth trajectory position it as a key driver of global mobile payment expansion, offering significant opportunities for both established and emerging players. The forecast period reflects a continued acceleration driven by ongoing technological advancements, improving infrastructure, and sustained governmental support.
APAC Mobile Payments Industry: A Comprehensive Market Report (2019-2033)
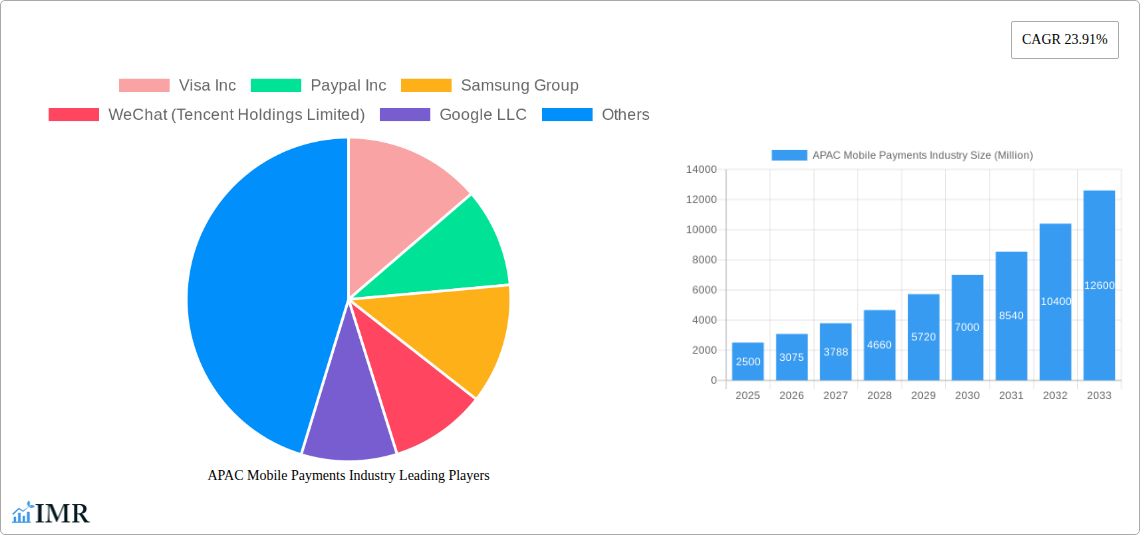
This comprehensive report provides an in-depth analysis of the Asia-Pacific (APAC) mobile payments industry, covering market dynamics, growth trends, key players, and future outlook. The study period spans from 2019 to 2033, with 2025 serving as the base and estimated year. The report is crucial for businesses, investors, and researchers seeking to understand this rapidly evolving landscape. The market is segmented by payment type (Proximity Payment, Remote Payment), end-user industry (BFSI, IT & Telecommunication, Retail, Healthcare, Government, Media & Entertainment, Transportation & Logistics, Other), and country (China, India, Japan, South Korea, Rest of Asia Pacific). Key players analyzed include Visa Inc, Paypal Inc, Samsung Group, WeChat (Tencent Holdings Limited), Google LLC, Comviva Technologies Limited (A Tech Mahindra Company), Amazon com Inc, Alipay com Co Ltd, Mastercard Inc, Paytm (One97 Communications Limited), and American Express Co. The report projects a market size of xx Million units by 2033.
APAC Mobile Payments Industry Market Dynamics & Structure
The APAC mobile payments market is characterized by high growth potential, driven by increasing smartphone penetration, rising digital literacy, and supportive government initiatives. Market concentration is relatively high, with a few dominant players like Alipay and WeChat holding significant market share in key markets. However, the landscape is increasingly competitive, with both established players and fintech startups vying for market share. Technological innovation is a key driver, with advancements in biometric authentication, tokenization, and blockchain technology shaping the future of mobile payments. Regulatory frameworks vary across countries in the APAC region, impacting market dynamics and requiring companies to navigate diverse compliance requirements. The emergence of super apps and the integration of mobile payments into broader ecosystem services further contributes to market expansion.
- Market Concentration: Alipay and WeChat dominate in China, while other players like Paytm (India) and local e-wallets hold significant regional influence. The market share of top 5 players is estimated at xx% in 2025.
- Technological Innovation: Biometric authentication and Near Field Communication (NFC) technology are key innovations. The adoption of QR code payments is also driving growth.
- Regulatory Landscape: Varying regulations across APAC countries create challenges but also opportunities for tailored solutions.
- Competitive Substitutes: Cash and traditional card payments remain significant substitutes, but their market share is declining rapidly.
- M&A Activity: The number of M&A deals in the APAC mobile payments sector averaged xx deals annually during the historical period (2019-2024).
APAC Mobile Payments Industry Growth Trends & Insights
The APAC mobile payments market experienced significant growth during the historical period (2019-2024), with a Compound Annual Growth Rate (CAGR) of xx%. This growth is expected to continue throughout the forecast period (2025-2033), driven by factors such as rising smartphone penetration, increasing internet and mobile data usage, and a burgeoning digital economy. Consumer behavior is shifting towards cashless transactions, and mobile payments offer a convenient and secure alternative to traditional methods. The adoption of mobile wallets and super apps is accelerating this shift. Technological disruptions such as the integration of Artificial Intelligence (AI) and machine learning (ML) for fraud detection and improved user experience are further propelling growth. Market penetration is expected to reach xx% by 2033.
Dominant Regions, Countries, or Segments in APAC Mobile Payments Industry
China and India are the dominant markets in the APAC region, accounting for the largest share of mobile payment transactions. China's dominance is driven by the widespread adoption of Alipay and WeChat Pay, while India's growth is fueled by a large and rapidly expanding smartphone user base. Within the segment breakdown, Remote Payment is growing faster than Proximity Payment due to its increased convenience and flexibility. Within end-user industries, the BFSI and Retail sectors are the largest contributors.
- China: High smartphone penetration, strong government support, and dominance of Alipay and WeChat Pay contribute to its leadership.
- India: Rapid growth fueled by a large population, increasing smartphone adoption, and government initiatives promoting digital payments.
- Remote Payment: Offers greater convenience and reach, surpassing Proximity Payment's growth rate.
- BFSI & Retail: These sectors are early adopters and drive a large portion of mobile payment transactions.
- Japan and South Korea: These markets show strong growth but lag behind China and India in terms of overall market size.
APAC Mobile Payments Industry Product Landscape
The APAC mobile payments landscape is diverse, offering a range of products and services, including mobile wallets, peer-to-peer (P2P) payment apps, and in-app payment solutions. Products are differentiated by features such as security protocols, user interface, and integration with other services. Key innovations include biometrics-based authentication, tokenization for enhanced security, and seamless integration with online and offline retail platforms. The focus is on improved user experience, enhanced security, and broader functionality beyond simple transactions.
Key Drivers, Barriers & Challenges in APAP Mobile Payments Industry
Key Drivers:
- Increasing smartphone penetration and internet access.
- Government initiatives promoting digital payments.
- Growing adoption of e-commerce and online services.
- Expanding usage of mobile wallets and super apps.
Challenges:
- Concerns over data security and privacy.
- Infrastructure limitations in certain regions.
- Regulatory complexities and varying standards across countries.
- Competition from traditional payment methods. The impact of these challenges results in a projected loss of xx Million units annually.
Emerging Opportunities in APAC Mobile Payments Industry
- Expansion into underserved markets in rural areas.
- Development of innovative solutions for micro and small businesses.
- Integration of mobile payments with other financial services.
- Growth of contactless and biometric payment technologies.
- Increased use of mobile payments in government services.
Growth Accelerators in the APAC Mobile Payments Industry
Technological advancements, strategic partnerships between financial institutions and technology companies, and the expansion of mobile payment services into new sectors and markets are key drivers of long-term growth. Increased consumer awareness of mobile payment benefits and government support for digitalization further accelerate market expansion.
Key Players Shaping the APAC Mobile Payments Industry Market
- Visa Inc
- Paypal Inc
- Samsung Group
- WeChat (Tencent Holdings Limited)
- Google LLC
- Comviva Technologies Limited (A Tech Mahindra Company)
- Amazon com Inc
- Alipay com Co Ltd
- Mastercard Inc
- Paytm (One97 Communications Limited)
- American Express Co
Notable Milestones in APAC Mobile Payments Industry Sector
- June 2022: ComfortDelGro Taxi and Alipay+ partnered, enabling Touch 'n Go eWallet and Kakao Pay for taxi payments in Malaysia and South Korea.
- March 2022: HDFC Bank launched PayZapp 2.0, a revamped mobile payment app with UPI integration.
In-Depth APAC Mobile Payments Industry Market Outlook
The APAC mobile payments market is poised for sustained growth, driven by ongoing technological innovation, expanding digital infrastructure, and supportive government policies. Strategic partnerships, market consolidation, and the emergence of new payment solutions will shape the competitive landscape. The focus on enhanced security, improved user experience, and broader financial service integration will attract more users and drive market expansion. Untapped markets and evolving consumer preferences present significant opportunities for both established players and new entrants.
APAC Mobile Payments Industry Segmentation
-
1. Type
- 1.1. Proximity Payment
- 1.2. Remote Payment
-
2. End-User Industry
- 2.1. BFSI
- 2.2. IT and Telecommunication
- 2.3. Retail
- 2.4. Healthcare
- 2.5. Government
- 2.6. Media and Entertainment
- 2.7. Transportation and Logistics
- 2.8. Other End User
APAC Mobile Payments Industry Segmentation By Geography
-
1. North America
- 1.1. United States
- 1.2. Canada
- 1.3. Mexico
-
2. South America
- 2.1. Brazil
- 2.2. Argentina
- 2.3. Rest of South America
-
3. Europe
- 3.1. United Kingdom
- 3.2. Germany
- 3.3. France
- 3.4. Italy
- 3.5. Spain
- 3.6. Russia
- 3.7. Benelux
- 3.8. Nordics
- 3.9. Rest of Europe
-
4. Middle East & Africa
- 4.1. Turkey
- 4.2. Israel
- 4.3. GCC
- 4.4. North Africa
- 4.5. South Africa
- 4.6. Rest of Middle East & Africa
-
5. Asia Pacific
- 5.1. China
- 5.2. India
- 5.3. Japan
- 5.4. South Korea
- 5.5. ASEAN
- 5.6. Oceania
- 5.7. Rest of Asia Pacific
APAC Mobile Payments Industry REPORT HIGHLIGHTS
| Aspects | Details |
|---|---|
| Study Period | 2019-2033 |
| Base Year | 2024 |
| Estimated Year | 2025 |
| Forecast Period | 2025-2033 |
| Historical Period | 2019-2024 |
| Growth Rate | CAGR of 23.91% from 2019-2033 |
| Segmentation |
|
Table of Contents
- 1. Introduction
- 1.1. Research Scope
- 1.2. Market Segmentation
- 1.3. Research Methodology
- 1.4. Definitions and Assumptions
- 2. Executive Summary
- 2.1. Introduction
- 3. Market Dynamics
- 3.1. Introduction
- 3.2. Market Drivers
- 3.2.1. Increasing Internet Penetration and Growing M-commerce Market
- 3.3. Market Restrains
- 3.3.1. Security Issues Associated with Mobile Payments
- 3.4. Market Trends
- 3.4.1. Retail Industry is one of the Factor Driving the Market
- 4. Market Factor Analysis
- 4.1. Porters Five Forces
- 4.2. Supply/Value Chain
- 4.3. PESTEL analysis
- 4.4. Market Entropy
- 4.5. Patent/Trademark Analysis
- 5. Global APAC Mobile Payments Industry Analysis, Insights and Forecast, 2019-2031
- 5.1. Market Analysis, Insights and Forecast - by Type
- 5.1.1. Proximity Payment
- 5.1.2. Remote Payment
- 5.2. Market Analysis, Insights and Forecast - by End-User Industry
- 5.2.1. BFSI
- 5.2.2. IT and Telecommunication
- 5.2.3. Retail
- 5.2.4. Healthcare
- 5.2.5. Government
- 5.2.6. Media and Entertainment
- 5.2.7. Transportation and Logistics
- 5.2.8. Other End User
- 5.3. Market Analysis, Insights and Forecast - by Region
- 5.3.1. North America
- 5.3.2. South America
- 5.3.3. Europe
- 5.3.4. Middle East & Africa
- 5.3.5. Asia Pacific
- 5.1. Market Analysis, Insights and Forecast - by Type
- 6. North America APAC Mobile Payments Industry Analysis, Insights and Forecast, 2019-2031
- 6.1. Market Analysis, Insights and Forecast - by Type
- 6.1.1. Proximity Payment
- 6.1.2. Remote Payment
- 6.2. Market Analysis, Insights and Forecast - by End-User Industry
- 6.2.1. BFSI
- 6.2.2. IT and Telecommunication
- 6.2.3. Retail
- 6.2.4. Healthcare
- 6.2.5. Government
- 6.2.6. Media and Entertainment
- 6.2.7. Transportation and Logistics
- 6.2.8. Other End User
- 6.1. Market Analysis, Insights and Forecast - by Type
- 7. South America APAC Mobile Payments Industry Analysis, Insights and Forecast, 2019-2031
- 7.1. Market Analysis, Insights and Forecast - by Type
- 7.1.1. Proximity Payment
- 7.1.2. Remote Payment
- 7.2. Market Analysis, Insights and Forecast - by End-User Industry
- 7.2.1. BFSI
- 7.2.2. IT and Telecommunication
- 7.2.3. Retail
- 7.2.4. Healthcare
- 7.2.5. Government
- 7.2.6. Media and Entertainment
- 7.2.7. Transportation and Logistics
- 7.2.8. Other End User
- 7.1. Market Analysis, Insights and Forecast - by Type
- 8. Europe APAC Mobile Payments Industry Analysis, Insights and Forecast, 2019-2031
- 8.1. Market Analysis, Insights and Forecast - by Type
- 8.1.1. Proximity Payment
- 8.1.2. Remote Payment
- 8.2. Market Analysis, Insights and Forecast - by End-User Industry
- 8.2.1. BFSI
- 8.2.2. IT and Telecommunication
- 8.2.3. Retail
- 8.2.4. Healthcare
- 8.2.5. Government
- 8.2.6. Media and Entertainment
- 8.2.7. Transportation and Logistics
- 8.2.8. Other End User
- 8.1. Market Analysis, Insights and Forecast - by Type
- 9. Middle East & Africa APAC Mobile Payments Industry Analysis, Insights and Forecast, 2019-2031
- 9.1. Market Analysis, Insights and Forecast - by Type
- 9.1.1. Proximity Payment
- 9.1.2. Remote Payment
- 9.2. Market Analysis, Insights and Forecast - by End-User Industry
- 9.2.1. BFSI
- 9.2.2. IT and Telecommunication
- 9.2.3. Retail
- 9.2.4. Healthcare
- 9.2.5. Government
- 9.2.6. Media and Entertainment
- 9.2.7. Transportation and Logistics
- 9.2.8. Other End User
- 9.1. Market Analysis, Insights and Forecast - by Type
- 10. Asia Pacific APAC Mobile Payments Industry Analysis, Insights and Forecast, 2019-2031
- 10.1. Market Analysis, Insights and Forecast - by Type
- 10.1.1. Proximity Payment
- 10.1.2. Remote Payment
- 10.2. Market Analysis, Insights and Forecast - by End-User Industry
- 10.2.1. BFSI
- 10.2.2. IT and Telecommunication
- 10.2.3. Retail
- 10.2.4. Healthcare
- 10.2.5. Government
- 10.2.6. Media and Entertainment
- 10.2.7. Transportation and Logistics
- 10.2.8. Other End User
- 10.1. Market Analysis, Insights and Forecast - by Type
- 11. North America APAC Mobile Payments Industry Analysis, Insights and Forecast, 2019-2031
- 11.1. Market Analysis, Insights and Forecast - By Country/Sub-region
- 11.1.1.
- 12. Europe APAC Mobile Payments Industry Analysis, Insights and Forecast, 2019-2031
- 12.1. Market Analysis, Insights and Forecast - By Country/Sub-region
- 12.1.1.
- 13. Asia Pacific APAC Mobile Payments Industry Analysis, Insights and Forecast, 2019-2031
- 13.1. Market Analysis, Insights and Forecast - By Country/Sub-region
- 13.1.1.
- 14. Latin America APAC Mobile Payments Industry Analysis, Insights and Forecast, 2019-2031
- 14.1. Market Analysis, Insights and Forecast - By Country/Sub-region
- 14.1.1.
- 15. Middle East APAC Mobile Payments Industry Analysis, Insights and Forecast, 2019-2031
- 15.1. Market Analysis, Insights and Forecast - By Country/Sub-region
- 15.1.1.
- 16. Competitive Analysis
- 16.1. Global Market Share Analysis 2024
- 16.2. Company Profiles
- 16.2.1 Visa Inc
- 16.2.1.1. Overview
- 16.2.1.2. Products
- 16.2.1.3. SWOT Analysis
- 16.2.1.4. Recent Developments
- 16.2.1.5. Financials (Based on Availability)
- 16.2.2 Paypal Inc
- 16.2.2.1. Overview
- 16.2.2.2. Products
- 16.2.2.3. SWOT Analysis
- 16.2.2.4. Recent Developments
- 16.2.2.5. Financials (Based on Availability)
- 16.2.3 Samsung Group
- 16.2.3.1. Overview
- 16.2.3.2. Products
- 16.2.3.3. SWOT Analysis
- 16.2.3.4. Recent Developments
- 16.2.3.5. Financials (Based on Availability)
- 16.2.4 WeChat (Tencent Holdings Limited)
- 16.2.4.1. Overview
- 16.2.4.2. Products
- 16.2.4.3. SWOT Analysis
- 16.2.4.4. Recent Developments
- 16.2.4.5. Financials (Based on Availability)
- 16.2.5 Google LLC
- 16.2.5.1. Overview
- 16.2.5.2. Products
- 16.2.5.3. SWOT Analysis
- 16.2.5.4. Recent Developments
- 16.2.5.5. Financials (Based on Availability)
- 16.2.6 Comviva Technologies Limited (A Tech Mahindra Company)
- 16.2.6.1. Overview
- 16.2.6.2. Products
- 16.2.6.3. SWOT Analysis
- 16.2.6.4. Recent Developments
- 16.2.6.5. Financials (Based on Availability)
- 16.2.7 Amazon com Inc
- 16.2.7.1. Overview
- 16.2.7.2. Products
- 16.2.7.3. SWOT Analysis
- 16.2.7.4. Recent Developments
- 16.2.7.5. Financials (Based on Availability)
- 16.2.8 Alipay com Co Ltd
- 16.2.8.1. Overview
- 16.2.8.2. Products
- 16.2.8.3. SWOT Analysis
- 16.2.8.4. Recent Developments
- 16.2.8.5. Financials (Based on Availability)
- 16.2.9 Mastercard Inc
- 16.2.9.1. Overview
- 16.2.9.2. Products
- 16.2.9.3. SWOT Analysis
- 16.2.9.4. Recent Developments
- 16.2.9.5. Financials (Based on Availability)
- 16.2.10 Paytm (One97 Communications Limited)
- 16.2.10.1. Overview
- 16.2.10.2. Products
- 16.2.10.3. SWOT Analysis
- 16.2.10.4. Recent Developments
- 16.2.10.5. Financials (Based on Availability)
- 16.2.11 American Express Co
- 16.2.11.1. Overview
- 16.2.11.2. Products
- 16.2.11.3. SWOT Analysis
- 16.2.11.4. Recent Developments
- 16.2.11.5. Financials (Based on Availability)
- 16.2.1 Visa Inc
List of Figures
- Figure 1: Global APAC Mobile Payments Industry Revenue Breakdown (Million, %) by Region 2024 & 2032
- Figure 2: Global APAC Mobile Payments Industry Volume Breakdown (K Unit, %) by Region 2024 & 2032
- Figure 3: North America APAC Mobile Payments Industry Revenue (Million), by Country 2024 & 2032
- Figure 4: North America APAC Mobile Payments Industry Volume (K Unit), by Country 2024 & 2032
- Figure 5: North America APAC Mobile Payments Industry Revenue Share (%), by Country 2024 & 2032
- Figure 6: North America APAC Mobile Payments Industry Volume Share (%), by Country 2024 & 2032
- Figure 7: Europe APAC Mobile Payments Industry Revenue (Million), by Country 2024 & 2032
- Figure 8: Europe APAC Mobile Payments Industry Volume (K Unit), by Country 2024 & 2032
- Figure 9: Europe APAC Mobile Payments Industry Revenue Share (%), by Country 2024 & 2032
- Figure 10: Europe APAC Mobile Payments Industry Volume Share (%), by Country 2024 & 2032
- Figure 11: Asia Pacific APAC Mobile Payments Industry Revenue (Million), by Country 2024 & 2032
- Figure 12: Asia Pacific APAC Mobile Payments Industry Volume (K Unit), by Country 2024 & 2032
- Figure 13: Asia Pacific APAC Mobile Payments Industry Revenue Share (%), by Country 2024 & 2032
- Figure 14: Asia Pacific APAC Mobile Payments Industry Volume Share (%), by Country 2024 & 2032
- Figure 15: Latin America APAC Mobile Payments Industry Revenue (Million), by Country 2024 & 2032
- Figure 16: Latin America APAC Mobile Payments Industry Volume (K Unit), by Country 2024 & 2032
- Figure 17: Latin America APAC Mobile Payments Industry Revenue Share (%), by Country 2024 & 2032
- Figure 18: Latin America APAC Mobile Payments Industry Volume Share (%), by Country 2024 & 2032
- Figure 19: Middle East APAC Mobile Payments Industry Revenue (Million), by Country 2024 & 2032
- Figure 20: Middle East APAC Mobile Payments Industry Volume (K Unit), by Country 2024 & 2032
- Figure 21: Middle East APAC Mobile Payments Industry Revenue Share (%), by Country 2024 & 2032
- Figure 22: Middle East APAC Mobile Payments Industry Volume Share (%), by Country 2024 & 2032
- Figure 23: North America APAC Mobile Payments Industry Revenue (Million), by Type 2024 & 2032
- Figure 24: North America APAC Mobile Payments Industry Volume (K Unit), by Type 2024 & 2032
- Figure 25: North America APAC Mobile Payments Industry Revenue Share (%), by Type 2024 & 2032
- Figure 26: North America APAC Mobile Payments Industry Volume Share (%), by Type 2024 & 2032
- Figure 27: North America APAC Mobile Payments Industry Revenue (Million), by End-User Industry 2024 & 2032
- Figure 28: North America APAC Mobile Payments Industry Volume (K Unit), by End-User Industry 2024 & 2032
- Figure 29: North America APAC Mobile Payments Industry Revenue Share (%), by End-User Industry 2024 & 2032
- Figure 30: North America APAC Mobile Payments Industry Volume Share (%), by End-User Industry 2024 & 2032
- Figure 31: North America APAC Mobile Payments Industry Revenue (Million), by Country 2024 & 2032
- Figure 32: North America APAC Mobile Payments Industry Volume (K Unit), by Country 2024 & 2032
- Figure 33: North America APAC Mobile Payments Industry Revenue Share (%), by Country 2024 & 2032
- Figure 34: North America APAC Mobile Payments Industry Volume Share (%), by Country 2024 & 2032
- Figure 35: South America APAC Mobile Payments Industry Revenue (Million), by Type 2024 & 2032
- Figure 36: South America APAC Mobile Payments Industry Volume (K Unit), by Type 2024 & 2032
- Figure 37: South America APAC Mobile Payments Industry Revenue Share (%), by Type 2024 & 2032
- Figure 38: South America APAC Mobile Payments Industry Volume Share (%), by Type 2024 & 2032
- Figure 39: South America APAC Mobile Payments Industry Revenue (Million), by End-User Industry 2024 & 2032
- Figure 40: South America APAC Mobile Payments Industry Volume (K Unit), by End-User Industry 2024 & 2032
- Figure 41: South America APAC Mobile Payments Industry Revenue Share (%), by End-User Industry 2024 & 2032
- Figure 42: South America APAC Mobile Payments Industry Volume Share (%), by End-User Industry 2024 & 2032
- Figure 43: South America APAC Mobile Payments Industry Revenue (Million), by Country 2024 & 2032
- Figure 44: South America APAC Mobile Payments Industry Volume (K Unit), by Country 2024 & 2032
- Figure 45: South America APAC Mobile Payments Industry Revenue Share (%), by Country 2024 & 2032
- Figure 46: South America APAC Mobile Payments Industry Volume Share (%), by Country 2024 & 2032
- Figure 47: Europe APAC Mobile Payments Industry Revenue (Million), by Type 2024 & 2032
- Figure 48: Europe APAC Mobile Payments Industry Volume (K Unit), by Type 2024 & 2032
- Figure 49: Europe APAC Mobile Payments Industry Revenue Share (%), by Type 2024 & 2032
- Figure 50: Europe APAC Mobile Payments Industry Volume Share (%), by Type 2024 & 2032
- Figure 51: Europe APAC Mobile Payments Industry Revenue (Million), by End-User Industry 2024 & 2032
- Figure 52: Europe APAC Mobile Payments Industry Volume (K Unit), by End-User Industry 2024 & 2032
- Figure 53: Europe APAC Mobile Payments Industry Revenue Share (%), by End-User Industry 2024 & 2032
- Figure 54: Europe APAC Mobile Payments Industry Volume Share (%), by End-User Industry 2024 & 2032
- Figure 55: Europe APAC Mobile Payments Industry Revenue (Million), by Country 2024 & 2032
- Figure 56: Europe APAC Mobile Payments Industry Volume (K Unit), by Country 2024 & 2032
- Figure 57: Europe APAC Mobile Payments Industry Revenue Share (%), by Country 2024 & 2032
- Figure 58: Europe APAC Mobile Payments Industry Volume Share (%), by Country 2024 & 2032
- Figure 59: Middle East & Africa APAC Mobile Payments Industry Revenue (Million), by Type 2024 & 2032
- Figure 60: Middle East & Africa APAC Mobile Payments Industry Volume (K Unit), by Type 2024 & 2032
- Figure 61: Middle East & Africa APAC Mobile Payments Industry Revenue Share (%), by Type 2024 & 2032
- Figure 62: Middle East & Africa APAC Mobile Payments Industry Volume Share (%), by Type 2024 & 2032
- Figure 63: Middle East & Africa APAC Mobile Payments Industry Revenue (Million), by End-User Industry 2024 & 2032
- Figure 64: Middle East & Africa APAC Mobile Payments Industry Volume (K Unit), by End-User Industry 2024 & 2032
- Figure 65: Middle East & Africa APAC Mobile Payments Industry Revenue Share (%), by End-User Industry 2024 & 2032
- Figure 66: Middle East & Africa APAC Mobile Payments Industry Volume Share (%), by End-User Industry 2024 & 2032
- Figure 67: Middle East & Africa APAC Mobile Payments Industry Revenue (Million), by Country 2024 & 2032
- Figure 68: Middle East & Africa APAC Mobile Payments Industry Volume (K Unit), by Country 2024 & 2032
- Figure 69: Middle East & Africa APAC Mobile Payments Industry Revenue Share (%), by Country 2024 & 2032
- Figure 70: Middle East & Africa APAC Mobile Payments Industry Volume Share (%), by Country 2024 & 2032
- Figure 71: Asia Pacific APAC Mobile Payments Industry Revenue (Million), by Type 2024 & 2032
- Figure 72: Asia Pacific APAC Mobile Payments Industry Volume (K Unit), by Type 2024 & 2032
- Figure 73: Asia Pacific APAC Mobile Payments Industry Revenue Share (%), by Type 2024 & 2032
- Figure 74: Asia Pacific APAC Mobile Payments Industry Volume Share (%), by Type 2024 & 2032
- Figure 75: Asia Pacific APAC Mobile Payments Industry Revenue (Million), by End-User Industry 2024 & 2032
- Figure 76: Asia Pacific APAC Mobile Payments Industry Volume (K Unit), by End-User Industry 2024 & 2032
- Figure 77: Asia Pacific APAC Mobile Payments Industry Revenue Share (%), by End-User Industry 2024 & 2032
- Figure 78: Asia Pacific APAC Mobile Payments Industry Volume Share (%), by End-User Industry 2024 & 2032
- Figure 79: Asia Pacific APAC Mobile Payments Industry Revenue (Million), by Country 2024 & 2032
- Figure 80: Asia Pacific APAC Mobile Payments Industry Volume (K Unit), by Country 2024 & 2032
- Figure 81: Asia Pacific APAC Mobile Payments Industry Revenue Share (%), by Country 2024 & 2032
- Figure 82: Asia Pacific APAC Mobile Payments Industry Volume Share (%), by Country 2024 & 2032
List of Tables
- Table 1: Global APAC Mobile Payments Industry Revenue Million Forecast, by Region 2019 & 2032
- Table 2: Global APAC Mobile Payments Industry Volume K Unit Forecast, by Region 2019 & 2032
- Table 3: Global APAC Mobile Payments Industry Revenue Million Forecast, by Type 2019 & 2032
- Table 4: Global APAC Mobile Payments Industry Volume K Unit Forecast, by Type 2019 & 2032
- Table 5: Global APAC Mobile Payments Industry Revenue Million Forecast, by End-User Industry 2019 & 2032
- Table 6: Global APAC Mobile Payments Industry Volume K Unit Forecast, by End-User Industry 2019 & 2032
- Table 7: Global APAC Mobile Payments Industry Revenue Million Forecast, by Region 2019 & 2032
- Table 8: Global APAC Mobile Payments Industry Volume K Unit Forecast, by Region 2019 & 2032
- Table 9: Global APAC Mobile Payments Industry Revenue Million Forecast, by Country 2019 & 2032
- Table 10: Global APAC Mobile Payments Industry Volume K Unit Forecast, by Country 2019 & 2032
- Table 11: APAC Mobile Payments Industry Revenue (Million) Forecast, by Application 2019 & 2032
- Table 12: APAC Mobile Payments Industry Volume (K Unit) Forecast, by Application 2019 & 2032
- Table 13: Global APAC Mobile Payments Industry Revenue Million Forecast, by Country 2019 & 2032
- Table 14: Global APAC Mobile Payments Industry Volume K Unit Forecast, by Country 2019 & 2032
- Table 15: APAC Mobile Payments Industry Revenue (Million) Forecast, by Application 2019 & 2032
- Table 16: APAC Mobile Payments Industry Volume (K Unit) Forecast, by Application 2019 & 2032
- Table 17: Global APAC Mobile Payments Industry Revenue Million Forecast, by Country 2019 & 2032
- Table 18: Global APAC Mobile Payments Industry Volume K Unit Forecast, by Country 2019 & 2032
- Table 19: APAC Mobile Payments Industry Revenue (Million) Forecast, by Application 2019 & 2032
- Table 20: APAC Mobile Payments Industry Volume (K Unit) Forecast, by Application 2019 & 2032
- Table 21: Global APAC Mobile Payments Industry Revenue Million Forecast, by Country 2019 & 2032
- Table 22: Global APAC Mobile Payments Industry Volume K Unit Forecast, by Country 2019 & 2032
- Table 23: APAC Mobile Payments Industry Revenue (Million) Forecast, by Application 2019 & 2032
- Table 24: APAC Mobile Payments Industry Volume (K Unit) Forecast, by Application 2019 & 2032
- Table 25: Global APAC Mobile Payments Industry Revenue Million Forecast, by Country 2019 & 2032
- Table 26: Global APAC Mobile Payments Industry Volume K Unit Forecast, by Country 2019 & 2032
- Table 27: APAC Mobile Payments Industry Revenue (Million) Forecast, by Application 2019 & 2032
- Table 28: APAC Mobile Payments Industry Volume (K Unit) Forecast, by Application 2019 & 2032
- Table 29: Global APAC Mobile Payments Industry Revenue Million Forecast, by Type 2019 & 2032
- Table 30: Global APAC Mobile Payments Industry Volume K Unit Forecast, by Type 2019 & 2032
- Table 31: Global APAC Mobile Payments Industry Revenue Million Forecast, by End-User Industry 2019 & 2032
- Table 32: Global APAC Mobile Payments Industry Volume K Unit Forecast, by End-User Industry 2019 & 2032
- Table 33: Global APAC Mobile Payments Industry Revenue Million Forecast, by Country 2019 & 2032
- Table 34: Global APAC Mobile Payments Industry Volume K Unit Forecast, by Country 2019 & 2032
- Table 35: United States APAC Mobile Payments Industry Revenue (Million) Forecast, by Application 2019 & 2032
- Table 36: United States APAC Mobile Payments Industry Volume (K Unit) Forecast, by Application 2019 & 2032
- Table 37: Canada APAC Mobile Payments Industry Revenue (Million) Forecast, by Application 2019 & 2032
- Table 38: Canada APAC Mobile Payments Industry Volume (K Unit) Forecast, by Application 2019 & 2032
- Table 39: Mexico APAC Mobile Payments Industry Revenue (Million) Forecast, by Application 2019 & 2032
- Table 40: Mexico APAC Mobile Payments Industry Volume (K Unit) Forecast, by Application 2019 & 2032
- Table 41: Global APAC Mobile Payments Industry Revenue Million Forecast, by Type 2019 & 2032
- Table 42: Global APAC Mobile Payments Industry Volume K Unit Forecast, by Type 2019 & 2032
- Table 43: Global APAC Mobile Payments Industry Revenue Million Forecast, by End-User Industry 2019 & 2032
- Table 44: Global APAC Mobile Payments Industry Volume K Unit Forecast, by End-User Industry 2019 & 2032
- Table 45: Global APAC Mobile Payments Industry Revenue Million Forecast, by Country 2019 & 2032
- Table 46: Global APAC Mobile Payments Industry Volume K Unit Forecast, by Country 2019 & 2032
- Table 47: Brazil APAC Mobile Payments Industry Revenue (Million) Forecast, by Application 2019 & 2032
- Table 48: Brazil APAC Mobile Payments Industry Volume (K Unit) Forecast, by Application 2019 & 2032
- Table 49: Argentina APAC Mobile Payments Industry Revenue (Million) Forecast, by Application 2019 & 2032
- Table 50: Argentina APAC Mobile Payments Industry Volume (K Unit) Forecast, by Application 2019 & 2032
- Table 51: Rest of South America APAC Mobile Payments Industry Revenue (Million) Forecast, by Application 2019 & 2032
- Table 52: Rest of South America APAC Mobile Payments Industry Volume (K Unit) Forecast, by Application 2019 & 2032
- Table 53: Global APAC Mobile Payments Industry Revenue Million Forecast, by Type 2019 & 2032
- Table 54: Global APAC Mobile Payments Industry Volume K Unit Forecast, by Type 2019 & 2032
- Table 55: Global APAC Mobile Payments Industry Revenue Million Forecast, by End-User Industry 2019 & 2032
- Table 56: Global APAC Mobile Payments Industry Volume K Unit Forecast, by End-User Industry 2019 & 2032
- Table 57: Global APAC Mobile Payments Industry Revenue Million Forecast, by Country 2019 & 2032
- Table 58: Global APAC Mobile Payments Industry Volume K Unit Forecast, by Country 2019 & 2032
- Table 59: United Kingdom APAC Mobile Payments Industry Revenue (Million) Forecast, by Application 2019 & 2032
- Table 60: United Kingdom APAC Mobile Payments Industry Volume (K Unit) Forecast, by Application 2019 & 2032
- Table 61: Germany APAC Mobile Payments Industry Revenue (Million) Forecast, by Application 2019 & 2032
- Table 62: Germany APAC Mobile Payments Industry Volume (K Unit) Forecast, by Application 2019 & 2032
- Table 63: France APAC Mobile Payments Industry Revenue (Million) Forecast, by Application 2019 & 2032
- Table 64: France APAC Mobile Payments Industry Volume (K Unit) Forecast, by Application 2019 & 2032
- Table 65: Italy APAC Mobile Payments Industry Revenue (Million) Forecast, by Application 2019 & 2032
- Table 66: Italy APAC Mobile Payments Industry Volume (K Unit) Forecast, by Application 2019 & 2032
- Table 67: Spain APAC Mobile Payments Industry Revenue (Million) Forecast, by Application 2019 & 2032
- Table 68: Spain APAC Mobile Payments Industry Volume (K Unit) Forecast, by Application 2019 & 2032
- Table 69: Russia APAC Mobile Payments Industry Revenue (Million) Forecast, by Application 2019 & 2032
- Table 70: Russia APAC Mobile Payments Industry Volume (K Unit) Forecast, by Application 2019 & 2032
- Table 71: Benelux APAC Mobile Payments Industry Revenue (Million) Forecast, by Application 2019 & 2032
- Table 72: Benelux APAC Mobile Payments Industry Volume (K Unit) Forecast, by Application 2019 & 2032
- Table 73: Nordics APAC Mobile Payments Industry Revenue (Million) Forecast, by Application 2019 & 2032
- Table 74: Nordics APAC Mobile Payments Industry Volume (K Unit) Forecast, by Application 2019 & 2032
- Table 75: Rest of Europe APAC Mobile Payments Industry Revenue (Million) Forecast, by Application 2019 & 2032
- Table 76: Rest of Europe APAC Mobile Payments Industry Volume (K Unit) Forecast, by Application 2019 & 2032
- Table 77: Global APAC Mobile Payments Industry Revenue Million Forecast, by Type 2019 & 2032
- Table 78: Global APAC Mobile Payments Industry Volume K Unit Forecast, by Type 2019 & 2032
- Table 79: Global APAC Mobile Payments Industry Revenue Million Forecast, by End-User Industry 2019 & 2032
- Table 80: Global APAC Mobile Payments Industry Volume K Unit Forecast, by End-User Industry 2019 & 2032
- Table 81: Global APAC Mobile Payments Industry Revenue Million Forecast, by Country 2019 & 2032
- Table 82: Global APAC Mobile Payments Industry Volume K Unit Forecast, by Country 2019 & 2032
- Table 83: Turkey APAC Mobile Payments Industry Revenue (Million) Forecast, by Application 2019 & 2032
- Table 84: Turkey APAC Mobile Payments Industry Volume (K Unit) Forecast, by Application 2019 & 2032
- Table 85: Israel APAC Mobile Payments Industry Revenue (Million) Forecast, by Application 2019 & 2032
- Table 86: Israel APAC Mobile Payments Industry Volume (K Unit) Forecast, by Application 2019 & 2032
- Table 87: GCC APAC Mobile Payments Industry Revenue (Million) Forecast, by Application 2019 & 2032
- Table 88: GCC APAC Mobile Payments Industry Volume (K Unit) Forecast, by Application 2019 & 2032
- Table 89: North Africa APAC Mobile Payments Industry Revenue (Million) Forecast, by Application 2019 & 2032
- Table 90: North Africa APAC Mobile Payments Industry Volume (K Unit) Forecast, by Application 2019 & 2032
- Table 91: South Africa APAC Mobile Payments Industry Revenue (Million) Forecast, by Application 2019 & 2032
- Table 92: South Africa APAC Mobile Payments Industry Volume (K Unit) Forecast, by Application 2019 & 2032
- Table 93: Rest of Middle East & Africa APAC Mobile Payments Industry Revenue (Million) Forecast, by Application 2019 & 2032
- Table 94: Rest of Middle East & Africa APAC Mobile Payments Industry Volume (K Unit) Forecast, by Application 2019 & 2032
- Table 95: Global APAC Mobile Payments Industry Revenue Million Forecast, by Type 2019 & 2032
- Table 96: Global APAC Mobile Payments Industry Volume K Unit Forecast, by Type 2019 & 2032
- Table 97: Global APAC Mobile Payments Industry Revenue Million Forecast, by End-User Industry 2019 & 2032
- Table 98: Global APAC Mobile Payments Industry Volume K Unit Forecast, by End-User Industry 2019 & 2032
- Table 99: Global APAC Mobile Payments Industry Revenue Million Forecast, by Country 2019 & 2032
- Table 100: Global APAC Mobile Payments Industry Volume K Unit Forecast, by Country 2019 & 2032
- Table 101: China APAC Mobile Payments Industry Revenue (Million) Forecast, by Application 2019 & 2032
- Table 102: China APAC Mobile Payments Industry Volume (K Unit) Forecast, by Application 2019 & 2032
- Table 103: India APAC Mobile Payments Industry Revenue (Million) Forecast, by Application 2019 & 2032
- Table 104: India APAC Mobile Payments Industry Volume (K Unit) Forecast, by Application 2019 & 2032
- Table 105: Japan APAC Mobile Payments Industry Revenue (Million) Forecast, by Application 2019 & 2032
- Table 106: Japan APAC Mobile Payments Industry Volume (K Unit) Forecast, by Application 2019 & 2032
- Table 107: South Korea APAC Mobile Payments Industry Revenue (Million) Forecast, by Application 2019 & 2032
- Table 108: South Korea APAC Mobile Payments Industry Volume (K Unit) Forecast, by Application 2019 & 2032
- Table 109: ASEAN APAC Mobile Payments Industry Revenue (Million) Forecast, by Application 2019 & 2032
- Table 110: ASEAN APAC Mobile Payments Industry Volume (K Unit) Forecast, by Application 2019 & 2032
- Table 111: Oceania APAC Mobile Payments Industry Revenue (Million) Forecast, by Application 2019 & 2032
- Table 112: Oceania APAC Mobile Payments Industry Volume (K Unit) Forecast, by Application 2019 & 2032
- Table 113: Rest of Asia Pacific APAC Mobile Payments Industry Revenue (Million) Forecast, by Application 2019 & 2032
- Table 114: Rest of Asia Pacific APAC Mobile Payments Industry Volume (K Unit) Forecast, by Application 2019 & 2032
Frequently Asked Questions
1. What is the projected Compound Annual Growth Rate (CAGR) of the APAC Mobile Payments Industry?
The projected CAGR is approximately 23.91%.
2. Which companies are prominent players in the APAC Mobile Payments Industry?
Key companies in the market include Visa Inc, Paypal Inc, Samsung Group, WeChat (Tencent Holdings Limited), Google LLC, Comviva Technologies Limited (A Tech Mahindra Company), Amazon com Inc, Alipay com Co Ltd, Mastercard Inc, Paytm (One97 Communications Limited), American Express Co.
3. What are the main segments of the APAC Mobile Payments Industry?
The market segments include Type, End-User Industry.
4. Can you provide details about the market size?
The market size is estimated to be USD XX Million as of 2022.
5. What are some drivers contributing to market growth?
Increasing Internet Penetration and Growing M-commerce Market.
6. What are the notable trends driving market growth?
Retail Industry is one of the Factor Driving the Market.
7. Are there any restraints impacting market growth?
Security Issues Associated with Mobile Payments.
8. Can you provide examples of recent developments in the market?
June 2022 - ComfortDelGro Taxi and Alipay+ announced a partnership that enables mobile payments from Malaysia and South Korea, namely the Touch 'n Go eWallet and Kakao Pay, to be accepted as cashless payment options in all its Comfort and CityCab taxis. Users of these mobile wallets can pay for the cab fare simply through the wallet apps without needing to exchange currency.
9. What pricing options are available for accessing the report?
Pricing options include single-user, multi-user, and enterprise licenses priced at USD 4750, USD 4950, and USD 6800 respectively.
10. Is the market size provided in terms of value or volume?
The market size is provided in terms of value, measured in Million and volume, measured in K Unit.
11. Are there any specific market keywords associated with the report?
Yes, the market keyword associated with the report is "APAC Mobile Payments Industry," which aids in identifying and referencing the specific market segment covered.
12. How do I determine which pricing option suits my needs best?
The pricing options vary based on user requirements and access needs. Individual users may opt for single-user licenses, while businesses requiring broader access may choose multi-user or enterprise licenses for cost-effective access to the report.
13. Are there any additional resources or data provided in the APAC Mobile Payments Industry report?
While the report offers comprehensive insights, it's advisable to review the specific contents or supplementary materials provided to ascertain if additional resources or data are available.
14. How can I stay updated on further developments or reports in the APAC Mobile Payments Industry?
To stay informed about further developments, trends, and reports in the APAC Mobile Payments Industry, consider subscribing to industry newsletters, following relevant companies and organizations, or regularly checking reputable industry news sources and publications.
Methodology
Step 1 - Identification of Relevant Samples Size from Population Database


Step 2 - Approaches for Defining Global Market Size (Value, Volume* & Price*)

Note*: In applicable scenarios
Step 3 - Data Sources
Primary Research
- Web Analytics
- Survey Reports
- Research Institute
- Latest Research Reports
- Opinion Leaders
Secondary Research
- Annual Reports
- White Paper
- Latest Press Release
- Industry Association
- Paid Database
- Investor Presentations

Step 4 - Data Triangulation
Involves using different sources of information in order to increase the validity of a study
These sources are likely to be stakeholders in a program - participants, other researchers, program staff, other community members, and so on.
Then we put all data in single framework & apply various statistical tools to find out the dynamic on the market.
During the analysis stage, feedback from the stakeholder groups would be compared to determine areas of agreement as well as areas of divergence
