

Key Insights
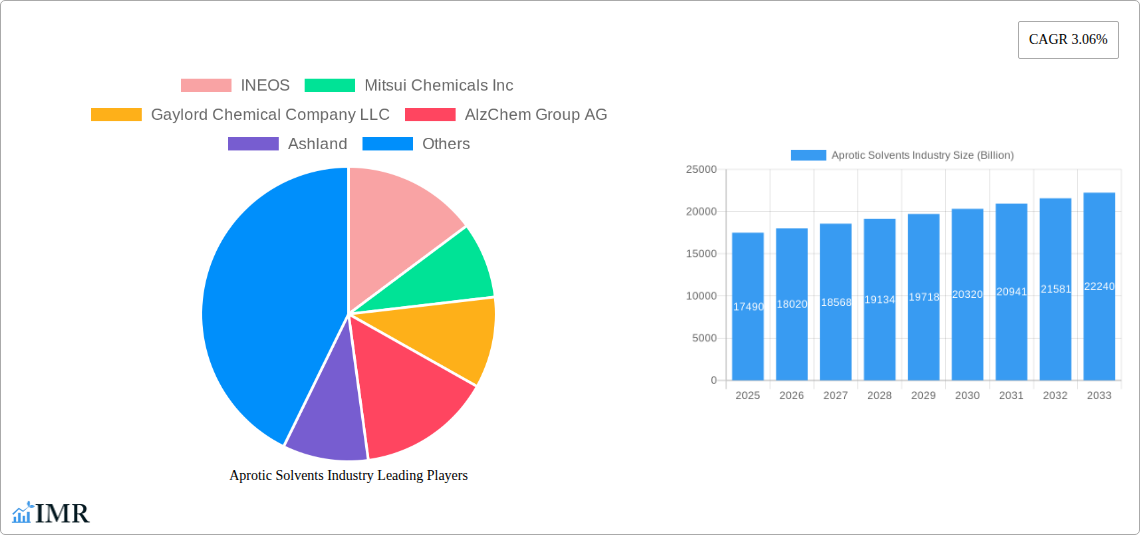
The global aprotic solvents market, valued at $19.65 billion in 2025, is poised for robust expansion with a projected Compound Annual Growth Rate (CAGR) of 3.04% from 2025 to 2033. Growth is propelled by escalating demand across key sectors including oil & gas, plastics, pharmaceuticals, and electronics manufacturing. The increasing emphasis on sustainable practices is also driving adoption of eco-friendly solvent alternatives. Despite challenges from fluctuating raw material costs and stringent regulations, ongoing research in green solvents is expected to mitigate these concerns. N-Methyl-2-Pyrrolidone (NMP) is anticipated to retain its leading position due to its exceptional performance and versatility, followed by toluene and other solvents. North America and Asia-Pacific are set to lead market growth, supported by strong industrial bases.
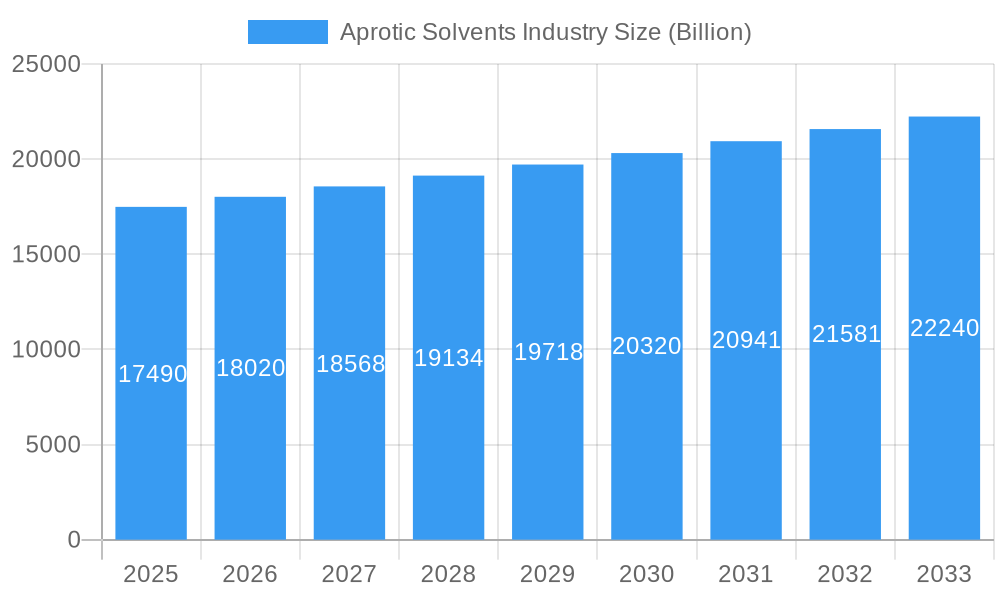
Aprotic Solvents Industry Market Size (In Billion)
Specialized aprotic solvents present significant opportunities in niche applications, particularly within the pharmaceutical sector for high-purity drug synthesis and formulation, and in electronics for advanced cleaning solutions. Intense competition among leading players like INEOS, Mitsui Chemicals, and BASF, coupled with strategic collaborations and continuous innovation, will shape the market. Future expansion hinges on advancements in sustainable solvent technology, environmental compliance, and strategic capacity investments by key stakeholders. The sustained growth of end-use industries will further underpin market development throughout the forecast period.
Aprotic Solvents Industry Company Market Share
This report offers a comprehensive analysis of the Aprotic Solvents market from 2019 to 2033, with a specific focus on the forecast period of 2025-2033 and a base year of 2025. The market is segmented by type (N-Methyl-2-Pyrrolidone (NMP), Toluene, Benzene, Acetone, Others) and application (Oil and Gas, Plastics, Pharmaceutical, Electronic Equipment, Paints and Coatings, Adhesives, Others). The total market size is projected to reach XX billion by 2033.
Aprotic Solvents Industry Market Dynamics & Structure
This section analyzes the competitive landscape, technological advancements, regulatory influences, and market trends within the aprotic solvents industry. The market is moderately consolidated, with key players holding significant market share. Technological innovations, particularly in sustainable solvent development, are driving growth, while stringent environmental regulations pose both challenges and opportunities. The increasing demand from diverse end-use industries fuels market expansion.
- Market Concentration: Moderately consolidated, with top 5 players holding approximately xx% of the market share in 2025.
- Technological Innovation: Focus on sustainable and biodegradable solvents; advancements in solvent recovery and recycling technologies.
- Regulatory Framework: Stringent environmental regulations impacting production and usage; evolving safety standards.
- Competitive Substitutes: Bio-based solvents and alternative cleaning agents pose a competitive threat.
- End-User Demographics: Growth driven by expanding sectors like pharmaceuticals, electronics, and coatings.
- M&A Trends: A moderate number of mergers and acquisitions (xx deals between 2019-2024) focused on expanding product portfolios and geographical reach.
Aprotic Solvents Industry Growth Trends & Insights
The aprotic solvents market exhibits a robust growth trajectory, driven by increasing industrialization and the expanding applications across various sectors. The market size is estimated at XX Billion in 2025 and is projected to reach XX Billion by 2033, exhibiting a CAGR of xx% during the forecast period. This growth is fueled by rising demand from the plastics, pharmaceuticals, and electronics industries, coupled with advancements in solvent technology that enhance performance and sustainability. Consumer preferences for environmentally friendly products are also influencing market trends. The adoption rate of sustainable aprotic solvents is steadily increasing, contributing significantly to market growth. Technological disruptions, such as the development of novel solvent formulations, are further accelerating market expansion.
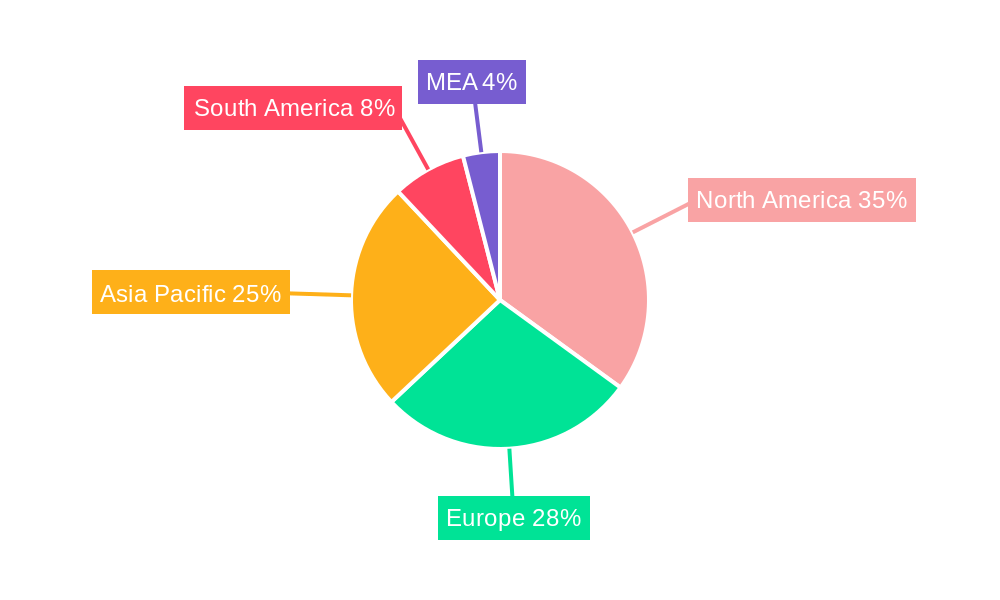
Dominant Regions, Countries, or Segments in Aprotic Solvents Industry
The North American and Asian regions are currently the dominant markets for aprotic solvents, driven by robust industrial activity and significant demand from key end-use sectors. Within the product segments, N-Methyl-2-Pyrrolidone (NMP) and Toluene command the largest market shares due to their widespread applications in various industries.
- Leading Regions: North America and Asia-Pacific.
- Key Countries: United States, China, Japan, Germany.
- Dominant Segments (Type): N-Methyl-2-Pyrrolidone (NMP) and Toluene hold the largest market shares.
- Dominant Segments (Application): Plastics and Pharmaceuticals are major application segments driving market growth.
- Growth Drivers: Strong industrial growth in emerging economies; increasing demand from various industries; government initiatives promoting technological advancements.
Aprotic Solvents Industry Product Landscape
The aprotic solvents market showcases continuous product innovation, with a focus on developing high-performance, eco-friendly solvents. Manufacturers are actively incorporating advanced technologies to enhance solvent efficiency, reduce environmental impact, and improve safety profiles. This includes the development of biodegradable solvents and improved solvent recovery systems. Unique selling propositions include higher purity levels, enhanced solvency, and reduced toxicity.
Key Drivers, Barriers & Challenges in Aprotic Solvents Industry
Key Drivers:
- Increasing demand from diverse end-use industries.
- Technological advancements in solvent design and production.
- Growing adoption of sustainable and eco-friendly solvents.
Challenges & Restraints:
- Stringent environmental regulations and safety standards.
- Volatility in raw material prices.
- Competition from alternative solvents and technologies.
- Supply chain disruptions potentially impacting production and availability.
Emerging Opportunities in Aprotic Solvents Industry
Emerging opportunities lie in the development of specialized solvents for niche applications, such as in green chemistry and sustainable manufacturing. Untapped markets in developing economies, coupled with growing demand for high-performance solvents in specialized industries, present significant growth prospects. The increasing focus on sustainability is creating opportunities for biodegradable and bio-based aprotic solvents.
Growth Accelerators in the Aprotic Solvents Industry
Long-term growth will be driven by technological advancements, strategic partnerships for market expansion, and the adoption of circular economy principles. Focus on developing innovative solvent solutions, leveraging sustainable production methods, and expanding into new application areas will be crucial for sustained market growth.
Key Players Shaping the Aprotic Solvents Industry Market
- INEOS
- Mitsui Chemicals Inc
- Gaylord Chemical Company LLC
- AlzChem Group AG
- Ashland
- BASF SE
- Dow
- Eastman Chemical Company
Notable Milestones in Aprotic Solvents Industry Sector
- 2020: Introduction of a new biodegradable solvent by BASF SE.
- 2022: INEOS acquires a smaller solvent manufacturer, expanding its market presence.
- 2023: Several companies announce investments in sustainable solvent production facilities. (Specific details would need further research to be accurate)
In-Depth Aprotic Solvents Industry Market Outlook
The aprotic solvents market is poised for sustained growth, driven by technological innovations, expanding applications, and a growing emphasis on sustainability. Strategic partnerships and investments in research and development will be crucial in shaping the future market landscape. The market is projected to witness significant expansion, offering lucrative opportunities for industry players who can adapt to evolving market dynamics and consumer preferences.
Aprotic Solvents Industry Segmentation
-
1. Type
- 1.1. N-Methyl-2-Pyrrolidone (NMP)
- 1.2. Toluene
- 1.3. Benzene
- 1.4. Acetone
- 1.5. Others
-
2. Application
- 2.1. Oil and Gas
- 2.2. Plastics
- 2.3. Pharmaceutical
- 2.4. Electronic Equipments
- 2.5. Paints and Coatings
- 2.6. Adhesives
- 2.7. Others
Aprotic Solvents Industry Segmentation By Geography
-
1. Asia Pacific
- 1.1. China
- 1.2. India
- 1.3. Japan
- 1.4. South Korea
- 1.5. Rest of Asia Pacific
-
2. North America
- 2.1. United States
- 2.2. Canada
- 2.3. Mexico
-
3. Europe
- 3.1. Germany
- 3.2. United Kingdom
- 3.3. France
- 3.4. Italy
- 3.5. Rest of Europe
-
4. South America
- 4.1. Brazil
- 4.2. Argentina
- 4.3. Rest of South America
-
5. Middle East and Africa
- 5.1. Saudi Arabia
- 5.2. South Africa
- 5.3. Rest of Middle East and Africa
Aprotic Solvents Industry Regional Market Share
Geographic Coverage of Aprotic Solvents Industry
Aprotic Solvents Industry REPORT HIGHLIGHTS
| Aspects | Details |
|---|---|
| Study Period | 2020-2034 |
| Base Year | 2025 |
| Estimated Year | 2026 |
| Forecast Period | 2026-2034 |
| Historical Period | 2020-2025 |
| Growth Rate | CAGR of 3.04% from 2020-2034 |
| Segmentation |
|
Table of Contents
- 1. Introduction
- 1.1. Research Scope
- 1.2. Market Segmentation
- 1.3. Research Objective
- 1.4. Definitions and Assumptions
- 2. Executive Summary
- 2.1. Market Snapshot
- 3. Market Dynamics
- 3.1. Market Drivers
- 3.2. Market Restrains
- 3.3. Market Trends
- 3.4. Market Opportunities
- 4. Market Factor Analysis
- 4.1. Porters Five Forces
- 4.1.1. Bargaining Power of Suppliers
- 4.1.2. Bargaining Power of Buyers
- 4.1.3. Threat of New Entrants
- 4.1.4. Threat of Substitutes
- 4.1.5. Competitive Rivalry
- 4.2. PESTEL analysis
- 4.3. BCG Analysis
- 4.3.1. Stars (High Growth, High Market Share)
- 4.3.2. Cash Cows (Low Growth, High Market Share)
- 4.3.3. Question Mark (High Growth, Low Market Share)
- 4.3.4. Dogs (Low Growth, Low Market Share)
- 4.4. Ansoff Matrix Analysis
- 4.5. Supply Chain Analysis
- 4.6. Regulatory Landscape
- 4.7. Current Market Potential and Opportunity Assessment (TAM–SAM–SOM Framework)
- 4.8. IMR Analyst Note
- 4.1. Porters Five Forces
- 5. Market Analysis, Insights and Forecast 2021-2033
- 5.1. Market Analysis, Insights and Forecast - by Type
- 5.1.1. N-Methyl-2-Pyrrolidone (NMP)
- 5.1.2. Toluene
- 5.1.3. Benzene
- 5.1.4. Acetone
- 5.1.5. Others
- 5.2. Market Analysis, Insights and Forecast - by Application
- 5.2.1. Oil and Gas
- 5.2.2. Plastics
- 5.2.3. Pharmaceutical
- 5.2.4. Electronic Equipments
- 5.2.5. Paints and Coatings
- 5.2.6. Adhesives
- 5.2.7. Others
- 5.3. Market Analysis, Insights and Forecast - by Region
- 5.3.1. Asia Pacific
- 5.3.2. North America
- 5.3.3. Europe
- 5.3.4. South America
- 5.3.5. Middle East and Africa
- 5.1. Market Analysis, Insights and Forecast - by Type
- 6. Global Aprotic Solvents Industry Analysis, Insights and Forecast, 2021-2033
- 6.1. Market Analysis, Insights and Forecast - by Type
- 6.1.1. N-Methyl-2-Pyrrolidone (NMP)
- 6.1.2. Toluene
- 6.1.3. Benzene
- 6.1.4. Acetone
- 6.1.5. Others
- 6.2. Market Analysis, Insights and Forecast - by Application
- 6.2.1. Oil and Gas
- 6.2.2. Plastics
- 6.2.3. Pharmaceutical
- 6.2.4. Electronic Equipments
- 6.2.5. Paints and Coatings
- 6.2.6. Adhesives
- 6.2.7. Others
- 6.1. Market Analysis, Insights and Forecast - by Type
- 7. Asia Pacific Aprotic Solvents Industry Analysis, Insights and Forecast, 2020-2032
- 7.1. Market Analysis, Insights and Forecast - by Type
- 7.1.1. N-Methyl-2-Pyrrolidone (NMP)
- 7.1.2. Toluene
- 7.1.3. Benzene
- 7.1.4. Acetone
- 7.1.5. Others
- 7.2. Market Analysis, Insights and Forecast - by Application
- 7.2.1. Oil and Gas
- 7.2.2. Plastics
- 7.2.3. Pharmaceutical
- 7.2.4. Electronic Equipments
- 7.2.5. Paints and Coatings
- 7.2.6. Adhesives
- 7.2.7. Others
- 7.1. Market Analysis, Insights and Forecast - by Type
- 8. North America Aprotic Solvents Industry Analysis, Insights and Forecast, 2020-2032
- 8.1. Market Analysis, Insights and Forecast - by Type
- 8.1.1. N-Methyl-2-Pyrrolidone (NMP)
- 8.1.2. Toluene
- 8.1.3. Benzene
- 8.1.4. Acetone
- 8.1.5. Others
- 8.2. Market Analysis, Insights and Forecast - by Application
- 8.2.1. Oil and Gas
- 8.2.2. Plastics
- 8.2.3. Pharmaceutical
- 8.2.4. Electronic Equipments
- 8.2.5. Paints and Coatings
- 8.2.6. Adhesives
- 8.2.7. Others
- 8.1. Market Analysis, Insights and Forecast - by Type
- 9. Europe Aprotic Solvents Industry Analysis, Insights and Forecast, 2020-2032
- 9.1. Market Analysis, Insights and Forecast - by Type
- 9.1.1. N-Methyl-2-Pyrrolidone (NMP)
- 9.1.2. Toluene
- 9.1.3. Benzene
- 9.1.4. Acetone
- 9.1.5. Others
- 9.2. Market Analysis, Insights and Forecast - by Application
- 9.2.1. Oil and Gas
- 9.2.2. Plastics
- 9.2.3. Pharmaceutical
- 9.2.4. Electronic Equipments
- 9.2.5. Paints and Coatings
- 9.2.6. Adhesives
- 9.2.7. Others
- 9.1. Market Analysis, Insights and Forecast - by Type
- 10. South America Aprotic Solvents Industry Analysis, Insights and Forecast, 2020-2032
- 10.1. Market Analysis, Insights and Forecast - by Type
- 10.1.1. N-Methyl-2-Pyrrolidone (NMP)
- 10.1.2. Toluene
- 10.1.3. Benzene
- 10.1.4. Acetone
- 10.1.5. Others
- 10.2. Market Analysis, Insights and Forecast - by Application
- 10.2.1. Oil and Gas
- 10.2.2. Plastics
- 10.2.3. Pharmaceutical
- 10.2.4. Electronic Equipments
- 10.2.5. Paints and Coatings
- 10.2.6. Adhesives
- 10.2.7. Others
- 10.1. Market Analysis, Insights and Forecast - by Type
- 11. Middle East and Africa Aprotic Solvents Industry Analysis, Insights and Forecast, 2020-2032
- 11.1. Market Analysis, Insights and Forecast - by Type
- 11.1.1. N-Methyl-2-Pyrrolidone (NMP)
- 11.1.2. Toluene
- 11.1.3. Benzene
- 11.1.4. Acetone
- 11.1.5. Others
- 11.2. Market Analysis, Insights and Forecast - by Application
- 11.2.1. Oil and Gas
- 11.2.2. Plastics
- 11.2.3. Pharmaceutical
- 11.2.4. Electronic Equipments
- 11.2.5. Paints and Coatings
- 11.2.6. Adhesives
- 11.2.7. Others
- 11.1. Market Analysis, Insights and Forecast - by Type
- 12. Competitive Analysis
- 12.1. Company Profiles
- 12.1.1 INEOS
- 12.1.1.1. Company Overview
- 12.1.1.2. Products
- 12.1.1.3. Company Financials
- 12.1.1.4. SWOT Analysis
- 12.1.2 Mitsui Chemicals Inc
- 12.1.2.1. Company Overview
- 12.1.2.2. Products
- 12.1.2.3. Company Financials
- 12.1.2.4. SWOT Analysis
- 12.1.3 Gaylord Chemical Company LLC
- 12.1.3.1. Company Overview
- 12.1.3.2. Products
- 12.1.3.3. Company Financials
- 12.1.3.4. SWOT Analysis
- 12.1.4 AlzChem Group AG
- 12.1.4.1. Company Overview
- 12.1.4.2. Products
- 12.1.4.3. Company Financials
- 12.1.4.4. SWOT Analysis
- 12.1.5 Ashland
- 12.1.5.1. Company Overview
- 12.1.5.2. Products
- 12.1.5.3. Company Financials
- 12.1.5.4. SWOT Analysis
- 12.1.6 BASF SE
- 12.1.6.1. Company Overview
- 12.1.6.2. Products
- 12.1.6.3. Company Financials
- 12.1.6.4. SWOT Analysis
- 12.1.7 Dow
- 12.1.7.1. Company Overview
- 12.1.7.2. Products
- 12.1.7.3. Company Financials
- 12.1.7.4. SWOT Analysis
- 12.1.8 Eastman Chemical Company
- 12.1.8.1. Company Overview
- 12.1.8.2. Products
- 12.1.8.3. Company Financials
- 12.1.8.4. SWOT Analysis
- 12.1.1 INEOS
- 12.2. Market Entropy
- 12.2.1 Company's Key Areas Served
- 12.2.2 Recent Developments
- 12.3. Company Market Share Analysis 2025
- 12.3.1 Top 5 Companies Market Share Analysis
- 12.3.2 Top 3 Companies Market Share Analysis
- 12.4. List of Potential Customers
- 13. Research Methodology
List of Figures
- Figure 1: Global Aprotic Solvents Industry Revenue Breakdown (billion, %) by Region 2025 & 2033
- Figure 2: Global Aprotic Solvents Industry Volume Breakdown (K Tons, %) by Region 2025 & 2033
- Figure 3: Asia Pacific Aprotic Solvents Industry Revenue (billion), by Type 2025 & 2033
- Figure 4: Asia Pacific Aprotic Solvents Industry Volume (K Tons), by Type 2025 & 2033
- Figure 5: Asia Pacific Aprotic Solvents Industry Revenue Share (%), by Type 2025 & 2033
- Figure 6: Asia Pacific Aprotic Solvents Industry Volume Share (%), by Type 2025 & 2033
- Figure 7: Asia Pacific Aprotic Solvents Industry Revenue (billion), by Application 2025 & 2033
- Figure 8: Asia Pacific Aprotic Solvents Industry Volume (K Tons), by Application 2025 & 2033
- Figure 9: Asia Pacific Aprotic Solvents Industry Revenue Share (%), by Application 2025 & 2033
- Figure 10: Asia Pacific Aprotic Solvents Industry Volume Share (%), by Application 2025 & 2033
- Figure 11: Asia Pacific Aprotic Solvents Industry Revenue (billion), by Country 2025 & 2033
- Figure 12: Asia Pacific Aprotic Solvents Industry Volume (K Tons), by Country 2025 & 2033
- Figure 13: Asia Pacific Aprotic Solvents Industry Revenue Share (%), by Country 2025 & 2033
- Figure 14: Asia Pacific Aprotic Solvents Industry Volume Share (%), by Country 2025 & 2033
- Figure 15: North America Aprotic Solvents Industry Revenue (billion), by Type 2025 & 2033
- Figure 16: North America Aprotic Solvents Industry Volume (K Tons), by Type 2025 & 2033
- Figure 17: North America Aprotic Solvents Industry Revenue Share (%), by Type 2025 & 2033
- Figure 18: North America Aprotic Solvents Industry Volume Share (%), by Type 2025 & 2033
- Figure 19: North America Aprotic Solvents Industry Revenue (billion), by Application 2025 & 2033
- Figure 20: North America Aprotic Solvents Industry Volume (K Tons), by Application 2025 & 2033
- Figure 21: North America Aprotic Solvents Industry Revenue Share (%), by Application 2025 & 2033
- Figure 22: North America Aprotic Solvents Industry Volume Share (%), by Application 2025 & 2033
- Figure 23: North America Aprotic Solvents Industry Revenue (billion), by Country 2025 & 2033
- Figure 24: North America Aprotic Solvents Industry Volume (K Tons), by Country 2025 & 2033
- Figure 25: North America Aprotic Solvents Industry Revenue Share (%), by Country 2025 & 2033
- Figure 26: North America Aprotic Solvents Industry Volume Share (%), by Country 2025 & 2033
- Figure 27: Europe Aprotic Solvents Industry Revenue (billion), by Type 2025 & 2033
- Figure 28: Europe Aprotic Solvents Industry Volume (K Tons), by Type 2025 & 2033
- Figure 29: Europe Aprotic Solvents Industry Revenue Share (%), by Type 2025 & 2033
- Figure 30: Europe Aprotic Solvents Industry Volume Share (%), by Type 2025 & 2033
- Figure 31: Europe Aprotic Solvents Industry Revenue (billion), by Application 2025 & 2033
- Figure 32: Europe Aprotic Solvents Industry Volume (K Tons), by Application 2025 & 2033
- Figure 33: Europe Aprotic Solvents Industry Revenue Share (%), by Application 2025 & 2033
- Figure 34: Europe Aprotic Solvents Industry Volume Share (%), by Application 2025 & 2033
- Figure 35: Europe Aprotic Solvents Industry Revenue (billion), by Country 2025 & 2033
- Figure 36: Europe Aprotic Solvents Industry Volume (K Tons), by Country 2025 & 2033
- Figure 37: Europe Aprotic Solvents Industry Revenue Share (%), by Country 2025 & 2033
- Figure 38: Europe Aprotic Solvents Industry Volume Share (%), by Country 2025 & 2033
- Figure 39: South America Aprotic Solvents Industry Revenue (billion), by Type 2025 & 2033
- Figure 40: South America Aprotic Solvents Industry Volume (K Tons), by Type 2025 & 2033
- Figure 41: South America Aprotic Solvents Industry Revenue Share (%), by Type 2025 & 2033
- Figure 42: South America Aprotic Solvents Industry Volume Share (%), by Type 2025 & 2033
- Figure 43: South America Aprotic Solvents Industry Revenue (billion), by Application 2025 & 2033
- Figure 44: South America Aprotic Solvents Industry Volume (K Tons), by Application 2025 & 2033
- Figure 45: South America Aprotic Solvents Industry Revenue Share (%), by Application 2025 & 2033
- Figure 46: South America Aprotic Solvents Industry Volume Share (%), by Application 2025 & 2033
- Figure 47: South America Aprotic Solvents Industry Revenue (billion), by Country 2025 & 2033
- Figure 48: South America Aprotic Solvents Industry Volume (K Tons), by Country 2025 & 2033
- Figure 49: South America Aprotic Solvents Industry Revenue Share (%), by Country 2025 & 2033
- Figure 50: South America Aprotic Solvents Industry Volume Share (%), by Country 2025 & 2033
- Figure 51: Middle East and Africa Aprotic Solvents Industry Revenue (billion), by Type 2025 & 2033
- Figure 52: Middle East and Africa Aprotic Solvents Industry Volume (K Tons), by Type 2025 & 2033
- Figure 53: Middle East and Africa Aprotic Solvents Industry Revenue Share (%), by Type 2025 & 2033
- Figure 54: Middle East and Africa Aprotic Solvents Industry Volume Share (%), by Type 2025 & 2033
- Figure 55: Middle East and Africa Aprotic Solvents Industry Revenue (billion), by Application 2025 & 2033
- Figure 56: Middle East and Africa Aprotic Solvents Industry Volume (K Tons), by Application 2025 & 2033
- Figure 57: Middle East and Africa Aprotic Solvents Industry Revenue Share (%), by Application 2025 & 2033
- Figure 58: Middle East and Africa Aprotic Solvents Industry Volume Share (%), by Application 2025 & 2033
- Figure 59: Middle East and Africa Aprotic Solvents Industry Revenue (billion), by Country 2025 & 2033
- Figure 60: Middle East and Africa Aprotic Solvents Industry Volume (K Tons), by Country 2025 & 2033
- Figure 61: Middle East and Africa Aprotic Solvents Industry Revenue Share (%), by Country 2025 & 2033
- Figure 62: Middle East and Africa Aprotic Solvents Industry Volume Share (%), by Country 2025 & 2033
List of Tables
- Table 1: Global Aprotic Solvents Industry Revenue billion Forecast, by Type 2020 & 2033
- Table 2: Global Aprotic Solvents Industry Volume K Tons Forecast, by Type 2020 & 2033
- Table 3: Global Aprotic Solvents Industry Revenue billion Forecast, by Application 2020 & 2033
- Table 4: Global Aprotic Solvents Industry Volume K Tons Forecast, by Application 2020 & 2033
- Table 5: Global Aprotic Solvents Industry Revenue billion Forecast, by Region 2020 & 2033
- Table 6: Global Aprotic Solvents Industry Volume K Tons Forecast, by Region 2020 & 2033
- Table 7: Global Aprotic Solvents Industry Revenue billion Forecast, by Type 2020 & 2033
- Table 8: Global Aprotic Solvents Industry Volume K Tons Forecast, by Type 2020 & 2033
- Table 9: Global Aprotic Solvents Industry Revenue billion Forecast, by Application 2020 & 2033
- Table 10: Global Aprotic Solvents Industry Volume K Tons Forecast, by Application 2020 & 2033
- Table 11: Global Aprotic Solvents Industry Revenue billion Forecast, by Country 2020 & 2033
- Table 12: Global Aprotic Solvents Industry Volume K Tons Forecast, by Country 2020 & 2033
- Table 13: China Aprotic Solvents Industry Revenue (billion) Forecast, by Application 2020 & 2033
- Table 14: China Aprotic Solvents Industry Volume (K Tons) Forecast, by Application 2020 & 2033
- Table 15: India Aprotic Solvents Industry Revenue (billion) Forecast, by Application 2020 & 2033
- Table 16: India Aprotic Solvents Industry Volume (K Tons) Forecast, by Application 2020 & 2033
- Table 17: Japan Aprotic Solvents Industry Revenue (billion) Forecast, by Application 2020 & 2033
- Table 18: Japan Aprotic Solvents Industry Volume (K Tons) Forecast, by Application 2020 & 2033
- Table 19: South Korea Aprotic Solvents Industry Revenue (billion) Forecast, by Application 2020 & 2033
- Table 20: South Korea Aprotic Solvents Industry Volume (K Tons) Forecast, by Application 2020 & 2033
- Table 21: Rest of Asia Pacific Aprotic Solvents Industry Revenue (billion) Forecast, by Application 2020 & 2033
- Table 22: Rest of Asia Pacific Aprotic Solvents Industry Volume (K Tons) Forecast, by Application 2020 & 2033
- Table 23: Global Aprotic Solvents Industry Revenue billion Forecast, by Type 2020 & 2033
- Table 24: Global Aprotic Solvents Industry Volume K Tons Forecast, by Type 2020 & 2033
- Table 25: Global Aprotic Solvents Industry Revenue billion Forecast, by Application 2020 & 2033
- Table 26: Global Aprotic Solvents Industry Volume K Tons Forecast, by Application 2020 & 2033
- Table 27: Global Aprotic Solvents Industry Revenue billion Forecast, by Country 2020 & 2033
- Table 28: Global Aprotic Solvents Industry Volume K Tons Forecast, by Country 2020 & 2033
- Table 29: United States Aprotic Solvents Industry Revenue (billion) Forecast, by Application 2020 & 2033
- Table 30: United States Aprotic Solvents Industry Volume (K Tons) Forecast, by Application 2020 & 2033
- Table 31: Canada Aprotic Solvents Industry Revenue (billion) Forecast, by Application 2020 & 2033
- Table 32: Canada Aprotic Solvents Industry Volume (K Tons) Forecast, by Application 2020 & 2033
- Table 33: Mexico Aprotic Solvents Industry Revenue (billion) Forecast, by Application 2020 & 2033
- Table 34: Mexico Aprotic Solvents Industry Volume (K Tons) Forecast, by Application 2020 & 2033
- Table 35: Global Aprotic Solvents Industry Revenue billion Forecast, by Type 2020 & 2033
- Table 36: Global Aprotic Solvents Industry Volume K Tons Forecast, by Type 2020 & 2033
- Table 37: Global Aprotic Solvents Industry Revenue billion Forecast, by Application 2020 & 2033
- Table 38: Global Aprotic Solvents Industry Volume K Tons Forecast, by Application 2020 & 2033
- Table 39: Global Aprotic Solvents Industry Revenue billion Forecast, by Country 2020 & 2033
- Table 40: Global Aprotic Solvents Industry Volume K Tons Forecast, by Country 2020 & 2033
- Table 41: Germany Aprotic Solvents Industry Revenue (billion) Forecast, by Application 2020 & 2033
- Table 42: Germany Aprotic Solvents Industry Volume (K Tons) Forecast, by Application 2020 & 2033
- Table 43: United Kingdom Aprotic Solvents Industry Revenue (billion) Forecast, by Application 2020 & 2033
- Table 44: United Kingdom Aprotic Solvents Industry Volume (K Tons) Forecast, by Application 2020 & 2033
- Table 45: France Aprotic Solvents Industry Revenue (billion) Forecast, by Application 2020 & 2033
- Table 46: France Aprotic Solvents Industry Volume (K Tons) Forecast, by Application 2020 & 2033
- Table 47: Italy Aprotic Solvents Industry Revenue (billion) Forecast, by Application 2020 & 2033
- Table 48: Italy Aprotic Solvents Industry Volume (K Tons) Forecast, by Application 2020 & 2033
- Table 49: Rest of Europe Aprotic Solvents Industry Revenue (billion) Forecast, by Application 2020 & 2033
- Table 50: Rest of Europe Aprotic Solvents Industry Volume (K Tons) Forecast, by Application 2020 & 2033
- Table 51: Global Aprotic Solvents Industry Revenue billion Forecast, by Type 2020 & 2033
- Table 52: Global Aprotic Solvents Industry Volume K Tons Forecast, by Type 2020 & 2033
- Table 53: Global Aprotic Solvents Industry Revenue billion Forecast, by Application 2020 & 2033
- Table 54: Global Aprotic Solvents Industry Volume K Tons Forecast, by Application 2020 & 2033
- Table 55: Global Aprotic Solvents Industry Revenue billion Forecast, by Country 2020 & 2033
- Table 56: Global Aprotic Solvents Industry Volume K Tons Forecast, by Country 2020 & 2033
- Table 57: Brazil Aprotic Solvents Industry Revenue (billion) Forecast, by Application 2020 & 2033
- Table 58: Brazil Aprotic Solvents Industry Volume (K Tons) Forecast, by Application 2020 & 2033
- Table 59: Argentina Aprotic Solvents Industry Revenue (billion) Forecast, by Application 2020 & 2033
- Table 60: Argentina Aprotic Solvents Industry Volume (K Tons) Forecast, by Application 2020 & 2033
- Table 61: Rest of South America Aprotic Solvents Industry Revenue (billion) Forecast, by Application 2020 & 2033
- Table 62: Rest of South America Aprotic Solvents Industry Volume (K Tons) Forecast, by Application 2020 & 2033
- Table 63: Global Aprotic Solvents Industry Revenue billion Forecast, by Type 2020 & 2033
- Table 64: Global Aprotic Solvents Industry Volume K Tons Forecast, by Type 2020 & 2033
- Table 65: Global Aprotic Solvents Industry Revenue billion Forecast, by Application 2020 & 2033
- Table 66: Global Aprotic Solvents Industry Volume K Tons Forecast, by Application 2020 & 2033
- Table 67: Global Aprotic Solvents Industry Revenue billion Forecast, by Country 2020 & 2033
- Table 68: Global Aprotic Solvents Industry Volume K Tons Forecast, by Country 2020 & 2033
- Table 69: Saudi Arabia Aprotic Solvents Industry Revenue (billion) Forecast, by Application 2020 & 2033
- Table 70: Saudi Arabia Aprotic Solvents Industry Volume (K Tons) Forecast, by Application 2020 & 2033
- Table 71: South Africa Aprotic Solvents Industry Revenue (billion) Forecast, by Application 2020 & 2033
- Table 72: South Africa Aprotic Solvents Industry Volume (K Tons) Forecast, by Application 2020 & 2033
- Table 73: Rest of Middle East and Africa Aprotic Solvents Industry Revenue (billion) Forecast, by Application 2020 & 2033
- Table 74: Rest of Middle East and Africa Aprotic Solvents Industry Volume (K Tons) Forecast, by Application 2020 & 2033
Frequently Asked Questions
1. What is the projected Compound Annual Growth Rate (CAGR) of the Aprotic Solvents Industry?
The projected CAGR is approximately 3.04%.
2. Which companies are prominent players in the Aprotic Solvents Industry?
Key companies in the market include INEOS, Mitsui Chemicals Inc , Gaylord Chemical Company LLC, AlzChem Group AG, Ashland, BASF SE, Dow, Eastman Chemical Company.
3. What are the main segments of the Aprotic Solvents Industry?
The market segments include Type, Application.
4. Can you provide details about the market size?
The market size is estimated to be USD 19.65 billion as of 2022.
5. What are some drivers contributing to market growth?
; Growing Demand from Oil and Gas Industry; Increasing Consumption in Pharmaceutical Sector.
6. What are the notable trends driving market growth?
Application in the Oil and Gas Sector to Dominate the Market.
7. Are there any restraints impacting market growth?
; Non-Toxic Substitutes; Envrionmental Concerns; Unfavorable Conditions Arising Due to COVID-19 Outbreak.
8. Can you provide examples of recent developments in the market?
N/A
9. What pricing options are available for accessing the report?
Pricing options include single-user, multi-user, and enterprise licenses priced at USD 4750, USD 5250, and USD 8750 respectively.
10. Is the market size provided in terms of value or volume?
The market size is provided in terms of value, measured in billion and volume, measured in K Tons.
11. Are there any specific market keywords associated with the report?
Yes, the market keyword associated with the report is "Aprotic Solvents Industry," which aids in identifying and referencing the specific market segment covered.
12. How do I determine which pricing option suits my needs best?
The pricing options vary based on user requirements and access needs. Individual users may opt for single-user licenses, while businesses requiring broader access may choose multi-user or enterprise licenses for cost-effective access to the report.
13. Are there any additional resources or data provided in the Aprotic Solvents Industry report?
While the report offers comprehensive insights, it's advisable to review the specific contents or supplementary materials provided to ascertain if additional resources or data are available.
14. How can I stay updated on further developments or reports in the Aprotic Solvents Industry?
To stay informed about further developments, trends, and reports in the Aprotic Solvents Industry, consider subscribing to industry newsletters, following relevant companies and organizations, or regularly checking reputable industry news sources and publications.
Methodology
Step 1 - Identification of Relevant Samples Size from Population Database


Step 2 - Approaches for Defining Global Market Size (Value, Volume* & Price*)

Note*: In applicable scenarios
Step 3 - Data Sources
Primary Research
- Web Analytics
- Survey Reports
- Research Institute
- Latest Research Reports
- Opinion Leaders
Secondary Research
- Annual Reports
- White Paper
- Latest Press Release
- Industry Association
- Paid Database
- Investor Presentations

Step 4 - Data Triangulation
Involves using different sources of information in order to increase the validity of a study
These sources are likely to be stakeholders in a program - participants, other researchers, program staff, other community members, and so on.
Then we put all data in single framework & apply various statistical tools to find out the dynamic on the market.
During the analysis stage, feedback from the stakeholder groups would be compared to determine areas of agreement as well as areas of divergence