

Key Insights
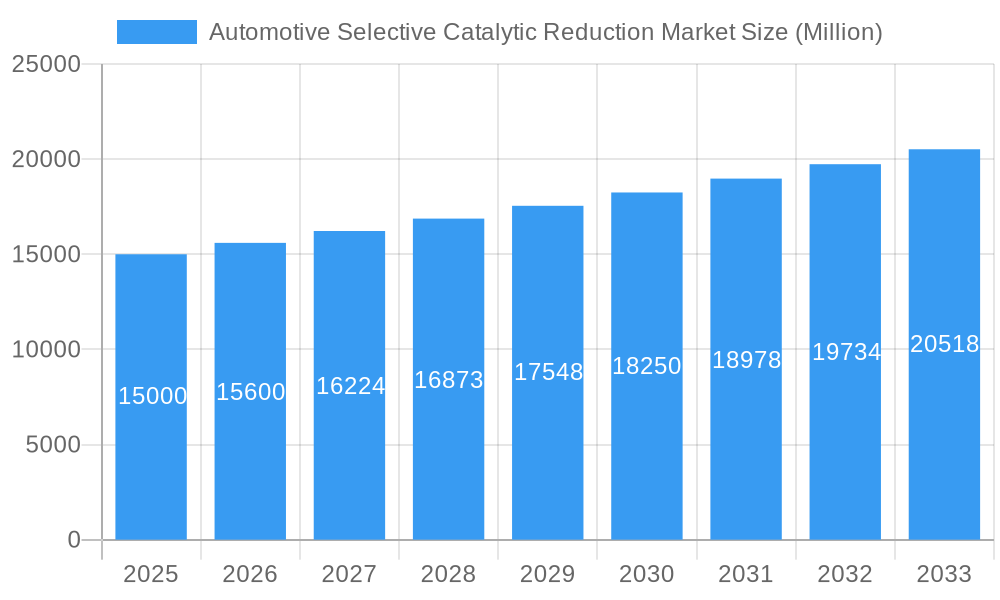
The Automotive Selective Catalytic Reduction (SCR) market is projected for significant expansion, propelled by increasingly stringent global emission regulations targeting nitrogen oxides (NOx) from diesel vehicles. The market is forecasted to reach a size of 13.22 billion by 2025, exhibiting a Compound Annual Growth Rate (CAGR) of 11.8%. SCR technology's proven efficacy in NOx reduction, particularly in heavy-duty vehicles and emerging applications in passenger cars, is a primary growth driver. Key catalyst types include Honeycomb, Plate, and Corrugated, with Honeycomb catalysts currently leading due to their superior performance. Primary applications span heavy-duty and light-duty vehicles within the transportation sector, alongside certain off-road vehicles. Rapid growth in the Asia-Pacific region is attributed to escalating vehicle populations and stricter emission standards. The market features intense competition among established players such as Umicore, Honeywell, Clariant, and Johnson Matthey, alongside emerging entrants. Ongoing advancements in efficient and cost-effective SCR systems, as well as their integration with hybrid vehicle powertrains, are expected to fuel future growth.
Automotive Selective Catalytic Reduction Market Market Size (In Billion)
Future market expansion for Automotive SCR systems will be shaped by innovations enhancing efficiency, durability, and cost-effectiveness. This includes pioneering new catalyst materials, refining system designs, and synergizing SCR with other emission control technologies. Government incentives promoting cleaner vehicles, especially in developing economies, will be pivotal. Opportunities for regional diversification are anticipated as vehicle fleets grow and emission regulations tighten globally. While the rise of electric and hybrid vehicles may present long-term challenges, the sustained demand for diesel engines in heavy-duty applications and specific niches will ensure continued market relevance.
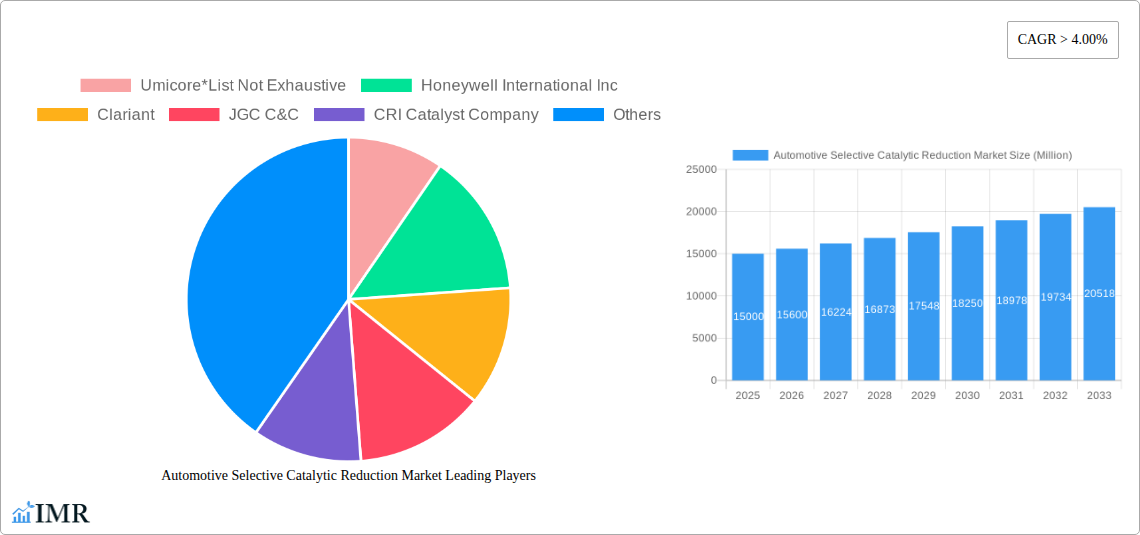
Automotive Selective Catalytic Reduction Market Company Market Share
Automotive Selective Catalytic Reduction Market Report: 2019-2033
This comprehensive report provides an in-depth analysis of the Automotive Selective Catalytic Reduction (SCR) market, encompassing its parent market (automotive emission control systems) and child markets (various catalyst types and applications). The study period covers 2019-2033, with 2025 as the base and estimated year. The forecast period is 2025-2033, and the historical period is 2019-2024. This report is crucial for industry professionals seeking to understand market dynamics, growth trends, and emerging opportunities within this vital sector. The market size is predicted to reach xx Million units by 2033.
Automotive Selective Catalytic Reduction Market Market Dynamics & Structure
This section analyzes the competitive landscape, technological advancements, regulatory influences, and market trends impacting the Automotive SCR market. We examine market concentration, revealing the market share held by key players such as Umicore, Honeywell International Inc, and Clariant. The report also explores the influence of technological innovation, specifically advancements in catalyst design and materials science, on market growth. Furthermore, we delve into the impact of stringent emission regulations globally, analyzing their influence on market demand and driving the adoption of SCR technology. The analysis also includes an examination of competitive substitutes, end-user demographics and the frequency of mergers and acquisitions (M&A) activities within the industry. We quantify M&A activity with xx deals observed during the historical period and project xx deals during the forecast period.
- Market Concentration: High, with top 5 players holding xx% market share in 2024.
- Technological Innovation Drivers: Advancements in catalyst materials (e.g., precious metal reduction), and system integration.
- Regulatory Frameworks: Stringent emission standards (e.g., Euro 7, EPA standards) are key drivers.
- Competitive Product Substitutes: Non-selective catalytic reduction (NSCR) systems pose some competition.
- End-User Demographics: Predominantly automotive manufacturers and aftermarket suppliers.
- M&A Trends: Consolidation expected to increase due to technological advancements and regulatory pressure.
Automotive Selective Catalytic Reduction Market Growth Trends & Insights
This section details the growth trajectory of the Automotive SCR market, using historical data and predictive modeling to forecast future trends. We analyze market size evolution, detailing the CAGR (Compound Annual Growth Rate) from 2019 to 2024 at xx% and projecting a CAGR of xx% from 2025 to 2033. Market penetration is also analyzed across key regions and application segments, highlighting adoption rates and factors driving growth. Disruptive technologies like artificial intelligence (AI) for optimized catalyst performance and improved system diagnostics are considered. Shifting consumer preferences toward environmentally friendly vehicles also significantly influence market demand.
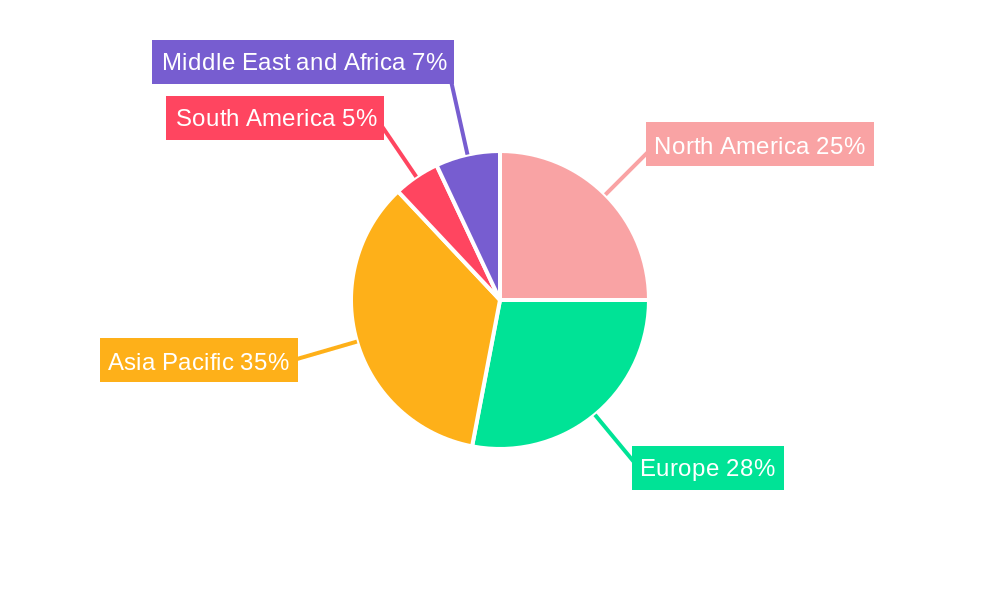
Dominant Regions, Countries, or Segments in Automotive Selective Catalytic Reduction Market
This section identifies the leading regions, countries, and market segments within the Automotive SCR market. Based on our analysis, [Region Name] is projected to be the dominant region in the forecast period, fueled by strong economic growth, expanding vehicle sales, and supportive government policies promoting emission control. The [Country Name] country's robust automotive manufacturing sector also boosts market growth significantly.
Leading Segments:
- Process Type: Selective Catalytic Reduction (SCR) dominates with xx Million units in 2024, driven by high efficiency in NOx reduction.
- Application: The Automotive sector remains dominant with xx Million units in 2024, followed by industrial applications at xx Million units.
- Catalyst Type: Honeycomb catalysts lead with xx Million units in 2024 owing to their superior surface area and efficiency.
Key Drivers:
- Strong government regulations and incentives for emission reduction.
- Increasing vehicle production and sales.
- Growing awareness of air pollution and environmental concerns.
Automotive Selective Catalytic Reduction Market Product Landscape
The Automotive SCR market offers a range of products catering to various vehicle types and emission standards. These include different catalyst formulations (e.g., V2O5-WO3/TiO2, Cu-CHA zeolites) optimized for performance and durability. Continuous innovation focuses on improving NOx conversion efficiency, extending catalyst lifespan, and minimizing precious metal content to reduce costs. Key selling propositions include higher conversion efficiency, extended catalyst lifespan, and improved cold-start performance.
Key Drivers, Barriers & Challenges in Automotive Selective Catalytic Reduction Market
Key Drivers: Stringent emission regulations worldwide are the primary driver, pushing increased adoption. Technological advancements continuously improve catalyst performance and reduce costs. Growing environmental awareness among consumers also contributes to increased market demand.
Key Challenges & Restraints: High raw material costs (e.g., platinum group metals), technological limitations in achieving ultra-low NOx emissions at cold temperatures, and supply chain disruptions pose significant challenges. Regulatory uncertainties and changing standards can also impact market growth. Competition from alternative emission control technologies also exists.
Emerging Opportunities in Automotive Selective Catalytic Reduction Market
Emerging opportunities exist in the development of next-generation catalysts with improved performance at low temperatures. Expansion into developing economies with growing vehicle sales is also promising. Advancements in catalyst diagnostics and predictive maintenance offer significant growth potential.
Growth Accelerators in the Automotive Selective Catalytic Reduction Market Industry
Strategic partnerships between catalyst manufacturers and automotive companies are vital. Technological breakthroughs in catalyst materials science and system design are continuous growth accelerators. Expansion into new applications, such as off-road vehicles and marine engines, provides additional growth opportunities.
Key Players Shaping the Automotive Selective Catalytic Reduction Market Market
- Umicore
- Honeywell International Inc
- Clariant
- JGC C&C
- CRI Catalyst Company
- DCL International Inc
- CDTi Advanced Materials Inc
- Hitachi Zosen Corporation
- CORMETECH
- BASF SE
- Cataler Corporation
- Johnson Matthey
- IBIDEN Porzellanfabrik Frauenthal
- Corning Incorporated
Notable Milestones in Automotive Selective Catalytic Reduction Market Sector
- 2022 Q4: Umicore launches a new generation of SCR catalysts with enhanced low-temperature performance.
- 2023 Q1: Honeywell International Inc. announces a strategic partnership with a major automotive manufacturer to develop advanced SCR systems.
- 2024 Q2: New emission standards are implemented in [Region/Country], driving increased adoption of SCR technology. (Further milestones to be added based on available data)
In-Depth Automotive Selective Catalytic Reduction Market Market Outlook
The Automotive SCR market is poised for substantial growth driven by stringent emission regulations and technological advancements. Future market potential is substantial, particularly in developing regions with increasing vehicle sales and infrastructure development. Strategic partnerships and investments in R&D will be crucial for maintaining a competitive edge in this dynamic market. The focus will be on developing cost-effective, high-performance catalysts that meet increasingly stringent emission standards.
Automotive Selective Catalytic Reduction Market Segmentation
-
1. Catalyst Type
- 1.1. Honeycomb Catalyst
- 1.2. Plate Catalyst
- 1.3. Corrugated Catalyst
-
2. Process Type
- 2.1. Selective Catalytic Reduction
- 2.2. Non-selective Catalytic Reduction
- 2.3. Diesel Particulate Filters
- 2.4. Catalytic Oxidation
-
3. Application
- 3.1. Power Generation (Excluding Coal based)
- 3.2. Coal-based Thermal Power Generation
- 3.3. Industrial
Automotive Selective Catalytic Reduction Market Segmentation By Geography
-
1. Asia Pacific
- 1.1. China
- 1.2. India
- 1.3. Japan
- 1.4. South Korea
- 1.5. ASEAN Countries
- 1.6. Rest of Asia Pacific
-
2. North America
- 2.1. United States
- 2.2. Canada
- 2.3. Mexico
-
3. Europe
- 3.1. Germany
- 3.2. United Kingdom
- 3.3. Italy
- 3.4. Russia
- 3.5. Rest of the Europe
-
4. South America
- 4.1. Brazil
- 4.2. Argentina
- 4.3. Rest of South America
-
5. Middle East and Africa
- 5.1. Saudi Arabia
- 5.2. South Africa
- 5.3. Rest of Middle East and Africa
Automotive Selective Catalytic Reduction Market Regional Market Share
Geographic Coverage of Automotive Selective Catalytic Reduction Market
Automotive Selective Catalytic Reduction Market REPORT HIGHLIGHTS
| Aspects | Details |
|---|---|
| Study Period | 2020-2034 |
| Base Year | 2025 |
| Estimated Year | 2026 |
| Forecast Period | 2026-2034 |
| Historical Period | 2020-2025 |
| Growth Rate | CAGR of 11.8% from 2020-2034 |
| Segmentation |
|
Table of Contents
- 1. Introduction
- 1.1. Research Scope
- 1.2. Market Segmentation
- 1.3. Research Objective
- 1.4. Definitions and Assumptions
- 2. Executive Summary
- 2.1. Market Snapshot
- 3. Market Dynamics
- 3.1. Market Drivers
- 3.2. Market Restrains
- 3.3. Market Trends
- 3.4. Market Opportunities
- 4. Market Factor Analysis
- 4.1. Porters Five Forces
- 4.1.1. Bargaining Power of Suppliers
- 4.1.2. Bargaining Power of Buyers
- 4.1.3. Threat of New Entrants
- 4.1.4. Threat of Substitutes
- 4.1.5. Competitive Rivalry
- 4.2. PESTEL analysis
- 4.3. BCG Analysis
- 4.3.1. Stars (High Growth, High Market Share)
- 4.3.2. Cash Cows (Low Growth, High Market Share)
- 4.3.3. Question Mark (High Growth, Low Market Share)
- 4.3.4. Dogs (Low Growth, Low Market Share)
- 4.4. Ansoff Matrix Analysis
- 4.5. Supply Chain Analysis
- 4.6. Regulatory Landscape
- 4.7. Current Market Potential and Opportunity Assessment (TAM–SAM–SOM Framework)
- 4.8. IMR Analyst Note
- 4.1. Porters Five Forces
- 5. Market Analysis, Insights and Forecast 2021-2033
- 5.1. Market Analysis, Insights and Forecast - by Catalyst Type
- 5.1.1. Honeycomb Catalyst
- 5.1.2. Plate Catalyst
- 5.1.3. Corrugated Catalyst
- 5.2. Market Analysis, Insights and Forecast - by Process Type
- 5.2.1. Selective Catalytic Reduction
- 5.2.2. Non-selective Catalytic Reduction
- 5.2.3. Diesel Particulate Filters
- 5.2.4. Catalytic Oxidation
- 5.3. Market Analysis, Insights and Forecast - by Application
- 5.3.1. Power Generation (Excluding Coal based)
- 5.3.2. Coal-based Thermal Power Generation
- 5.3.3. Industrial
- 5.4. Market Analysis, Insights and Forecast - by Region
- 5.4.1. Asia Pacific
- 5.4.2. North America
- 5.4.3. Europe
- 5.4.4. South America
- 5.4.5. Middle East and Africa
- 5.1. Market Analysis, Insights and Forecast - by Catalyst Type
- 6. Global Automotive Selective Catalytic Reduction Market Analysis, Insights and Forecast, 2021-2033
- 6.1. Market Analysis, Insights and Forecast - by Catalyst Type
- 6.1.1. Honeycomb Catalyst
- 6.1.2. Plate Catalyst
- 6.1.3. Corrugated Catalyst
- 6.2. Market Analysis, Insights and Forecast - by Process Type
- 6.2.1. Selective Catalytic Reduction
- 6.2.2. Non-selective Catalytic Reduction
- 6.2.3. Diesel Particulate Filters
- 6.2.4. Catalytic Oxidation
- 6.3. Market Analysis, Insights and Forecast - by Application
- 6.3.1. Power Generation (Excluding Coal based)
- 6.3.2. Coal-based Thermal Power Generation
- 6.3.3. Industrial
- 6.1. Market Analysis, Insights and Forecast - by Catalyst Type
- 7. Asia Pacific Automotive Selective Catalytic Reduction Market Analysis, Insights and Forecast, 2020-2032
- 7.1. Market Analysis, Insights and Forecast - by Catalyst Type
- 7.1.1. Honeycomb Catalyst
- 7.1.2. Plate Catalyst
- 7.1.3. Corrugated Catalyst
- 7.2. Market Analysis, Insights and Forecast - by Process Type
- 7.2.1. Selective Catalytic Reduction
- 7.2.2. Non-selective Catalytic Reduction
- 7.2.3. Diesel Particulate Filters
- 7.2.4. Catalytic Oxidation
- 7.3. Market Analysis, Insights and Forecast - by Application
- 7.3.1. Power Generation (Excluding Coal based)
- 7.3.2. Coal-based Thermal Power Generation
- 7.3.3. Industrial
- 7.1. Market Analysis, Insights and Forecast - by Catalyst Type
- 8. North America Automotive Selective Catalytic Reduction Market Analysis, Insights and Forecast, 2020-2032
- 8.1. Market Analysis, Insights and Forecast - by Catalyst Type
- 8.1.1. Honeycomb Catalyst
- 8.1.2. Plate Catalyst
- 8.1.3. Corrugated Catalyst
- 8.2. Market Analysis, Insights and Forecast - by Process Type
- 8.2.1. Selective Catalytic Reduction
- 8.2.2. Non-selective Catalytic Reduction
- 8.2.3. Diesel Particulate Filters
- 8.2.4. Catalytic Oxidation
- 8.3. Market Analysis, Insights and Forecast - by Application
- 8.3.1. Power Generation (Excluding Coal based)
- 8.3.2. Coal-based Thermal Power Generation
- 8.3.3. Industrial
- 8.1. Market Analysis, Insights and Forecast - by Catalyst Type
- 9. Europe Automotive Selective Catalytic Reduction Market Analysis, Insights and Forecast, 2020-2032
- 9.1. Market Analysis, Insights and Forecast - by Catalyst Type
- 9.1.1. Honeycomb Catalyst
- 9.1.2. Plate Catalyst
- 9.1.3. Corrugated Catalyst
- 9.2. Market Analysis, Insights and Forecast - by Process Type
- 9.2.1. Selective Catalytic Reduction
- 9.2.2. Non-selective Catalytic Reduction
- 9.2.3. Diesel Particulate Filters
- 9.2.4. Catalytic Oxidation
- 9.3. Market Analysis, Insights and Forecast - by Application
- 9.3.1. Power Generation (Excluding Coal based)
- 9.3.2. Coal-based Thermal Power Generation
- 9.3.3. Industrial
- 9.1. Market Analysis, Insights and Forecast - by Catalyst Type
- 10. South America Automotive Selective Catalytic Reduction Market Analysis, Insights and Forecast, 2020-2032
- 10.1. Market Analysis, Insights and Forecast - by Catalyst Type
- 10.1.1. Honeycomb Catalyst
- 10.1.2. Plate Catalyst
- 10.1.3. Corrugated Catalyst
- 10.2. Market Analysis, Insights and Forecast - by Process Type
- 10.2.1. Selective Catalytic Reduction
- 10.2.2. Non-selective Catalytic Reduction
- 10.2.3. Diesel Particulate Filters
- 10.2.4. Catalytic Oxidation
- 10.3. Market Analysis, Insights and Forecast - by Application
- 10.3.1. Power Generation (Excluding Coal based)
- 10.3.2. Coal-based Thermal Power Generation
- 10.3.3. Industrial
- 10.1. Market Analysis, Insights and Forecast - by Catalyst Type
- 11. Middle East and Africa Automotive Selective Catalytic Reduction Market Analysis, Insights and Forecast, 2020-2032
- 11.1. Market Analysis, Insights and Forecast - by Catalyst Type
- 11.1.1. Honeycomb Catalyst
- 11.1.2. Plate Catalyst
- 11.1.3. Corrugated Catalyst
- 11.2. Market Analysis, Insights and Forecast - by Process Type
- 11.2.1. Selective Catalytic Reduction
- 11.2.2. Non-selective Catalytic Reduction
- 11.2.3. Diesel Particulate Filters
- 11.2.4. Catalytic Oxidation
- 11.3. Market Analysis, Insights and Forecast - by Application
- 11.3.1. Power Generation (Excluding Coal based)
- 11.3.2. Coal-based Thermal Power Generation
- 11.3.3. Industrial
- 11.1. Market Analysis, Insights and Forecast - by Catalyst Type
- 12. Competitive Analysis
- 12.1. Company Profiles
- 12.1.1 Umicore*List Not Exhaustive
- 12.1.1.1. Company Overview
- 12.1.1.2. Products
- 12.1.1.3. Company Financials
- 12.1.1.4. SWOT Analysis
- 12.1.2 Honeywell International Inc
- 12.1.2.1. Company Overview
- 12.1.2.2. Products
- 12.1.2.3. Company Financials
- 12.1.2.4. SWOT Analysis
- 12.1.3 Clariant
- 12.1.3.1. Company Overview
- 12.1.3.2. Products
- 12.1.3.3. Company Financials
- 12.1.3.4. SWOT Analysis
- 12.1.4 JGC C&C
- 12.1.4.1. Company Overview
- 12.1.4.2. Products
- 12.1.4.3. Company Financials
- 12.1.4.4. SWOT Analysis
- 12.1.5 CRI Catalyst Company
- 12.1.5.1. Company Overview
- 12.1.5.2. Products
- 12.1.5.3. Company Financials
- 12.1.5.4. SWOT Analysis
- 12.1.6 DCL International Inc
- 12.1.6.1. Company Overview
- 12.1.6.2. Products
- 12.1.6.3. Company Financials
- 12.1.6.4. SWOT Analysis
- 12.1.7 CDTi Advanced Materials Inc
- 12.1.7.1. Company Overview
- 12.1.7.2. Products
- 12.1.7.3. Company Financials
- 12.1.7.4. SWOT Analysis
- 12.1.8 Hitachi Zosen Corporation
- 12.1.8.1. Company Overview
- 12.1.8.2. Products
- 12.1.8.3. Company Financials
- 12.1.8.4. SWOT Analysis
- 12.1.9 CORMETECH
- 12.1.9.1. Company Overview
- 12.1.9.2. Products
- 12.1.9.3. Company Financials
- 12.1.9.4. SWOT Analysis
- 12.1.10 BASF SE
- 12.1.10.1. Company Overview
- 12.1.10.2. Products
- 12.1.10.3. Company Financials
- 12.1.10.4. SWOT Analysis
- 12.1.11 Cataler Corporation
- 12.1.11.1. Company Overview
- 12.1.11.2. Products
- 12.1.11.3. Company Financials
- 12.1.11.4. SWOT Analysis
- 12.1.12 Johnson Matthey
- 12.1.12.1. Company Overview
- 12.1.12.2. Products
- 12.1.12.3. Company Financials
- 12.1.12.4. SWOT Analysis
- 12.1.13 IBIDEN Porzellanfabrik Frauenthal
- 12.1.13.1. Company Overview
- 12.1.13.2. Products
- 12.1.13.3. Company Financials
- 12.1.13.4. SWOT Analysis
- 12.1.14 Corning Incorporated
- 12.1.14.1. Company Overview
- 12.1.14.2. Products
- 12.1.14.3. Company Financials
- 12.1.14.4. SWOT Analysis
- 12.1.1 Umicore*List Not Exhaustive
- 12.2. Market Entropy
- 12.2.1 Company's Key Areas Served
- 12.2.2 Recent Developments
- 12.3. Company Market Share Analysis 2025
- 12.3.1 Top 5 Companies Market Share Analysis
- 12.3.2 Top 3 Companies Market Share Analysis
- 12.4. List of Potential Customers
- 13. Research Methodology
List of Figures
- Figure 1: Global Automotive Selective Catalytic Reduction Market Revenue Breakdown (billion, %) by Region 2025 & 2033
- Figure 2: Asia Pacific Automotive Selective Catalytic Reduction Market Revenue (billion), by Catalyst Type 2025 & 2033
- Figure 3: Asia Pacific Automotive Selective Catalytic Reduction Market Revenue Share (%), by Catalyst Type 2025 & 2033
- Figure 4: Asia Pacific Automotive Selective Catalytic Reduction Market Revenue (billion), by Process Type 2025 & 2033
- Figure 5: Asia Pacific Automotive Selective Catalytic Reduction Market Revenue Share (%), by Process Type 2025 & 2033
- Figure 6: Asia Pacific Automotive Selective Catalytic Reduction Market Revenue (billion), by Application 2025 & 2033
- Figure 7: Asia Pacific Automotive Selective Catalytic Reduction Market Revenue Share (%), by Application 2025 & 2033
- Figure 8: Asia Pacific Automotive Selective Catalytic Reduction Market Revenue (billion), by Country 2025 & 2033
- Figure 9: Asia Pacific Automotive Selective Catalytic Reduction Market Revenue Share (%), by Country 2025 & 2033
- Figure 10: North America Automotive Selective Catalytic Reduction Market Revenue (billion), by Catalyst Type 2025 & 2033
- Figure 11: North America Automotive Selective Catalytic Reduction Market Revenue Share (%), by Catalyst Type 2025 & 2033
- Figure 12: North America Automotive Selective Catalytic Reduction Market Revenue (billion), by Process Type 2025 & 2033
- Figure 13: North America Automotive Selective Catalytic Reduction Market Revenue Share (%), by Process Type 2025 & 2033
- Figure 14: North America Automotive Selective Catalytic Reduction Market Revenue (billion), by Application 2025 & 2033
- Figure 15: North America Automotive Selective Catalytic Reduction Market Revenue Share (%), by Application 2025 & 2033
- Figure 16: North America Automotive Selective Catalytic Reduction Market Revenue (billion), by Country 2025 & 2033
- Figure 17: North America Automotive Selective Catalytic Reduction Market Revenue Share (%), by Country 2025 & 2033
- Figure 18: Europe Automotive Selective Catalytic Reduction Market Revenue (billion), by Catalyst Type 2025 & 2033
- Figure 19: Europe Automotive Selective Catalytic Reduction Market Revenue Share (%), by Catalyst Type 2025 & 2033
- Figure 20: Europe Automotive Selective Catalytic Reduction Market Revenue (billion), by Process Type 2025 & 2033
- Figure 21: Europe Automotive Selective Catalytic Reduction Market Revenue Share (%), by Process Type 2025 & 2033
- Figure 22: Europe Automotive Selective Catalytic Reduction Market Revenue (billion), by Application 2025 & 2033
- Figure 23: Europe Automotive Selective Catalytic Reduction Market Revenue Share (%), by Application 2025 & 2033
- Figure 24: Europe Automotive Selective Catalytic Reduction Market Revenue (billion), by Country 2025 & 2033
- Figure 25: Europe Automotive Selective Catalytic Reduction Market Revenue Share (%), by Country 2025 & 2033
- Figure 26: South America Automotive Selective Catalytic Reduction Market Revenue (billion), by Catalyst Type 2025 & 2033
- Figure 27: South America Automotive Selective Catalytic Reduction Market Revenue Share (%), by Catalyst Type 2025 & 2033
- Figure 28: South America Automotive Selective Catalytic Reduction Market Revenue (billion), by Process Type 2025 & 2033
- Figure 29: South America Automotive Selective Catalytic Reduction Market Revenue Share (%), by Process Type 2025 & 2033
- Figure 30: South America Automotive Selective Catalytic Reduction Market Revenue (billion), by Application 2025 & 2033
- Figure 31: South America Automotive Selective Catalytic Reduction Market Revenue Share (%), by Application 2025 & 2033
- Figure 32: South America Automotive Selective Catalytic Reduction Market Revenue (billion), by Country 2025 & 2033
- Figure 33: South America Automotive Selective Catalytic Reduction Market Revenue Share (%), by Country 2025 & 2033
- Figure 34: Middle East and Africa Automotive Selective Catalytic Reduction Market Revenue (billion), by Catalyst Type 2025 & 2033
- Figure 35: Middle East and Africa Automotive Selective Catalytic Reduction Market Revenue Share (%), by Catalyst Type 2025 & 2033
- Figure 36: Middle East and Africa Automotive Selective Catalytic Reduction Market Revenue (billion), by Process Type 2025 & 2033
- Figure 37: Middle East and Africa Automotive Selective Catalytic Reduction Market Revenue Share (%), by Process Type 2025 & 2033
- Figure 38: Middle East and Africa Automotive Selective Catalytic Reduction Market Revenue (billion), by Application 2025 & 2033
- Figure 39: Middle East and Africa Automotive Selective Catalytic Reduction Market Revenue Share (%), by Application 2025 & 2033
- Figure 40: Middle East and Africa Automotive Selective Catalytic Reduction Market Revenue (billion), by Country 2025 & 2033
- Figure 41: Middle East and Africa Automotive Selective Catalytic Reduction Market Revenue Share (%), by Country 2025 & 2033
List of Tables
- Table 1: Global Automotive Selective Catalytic Reduction Market Revenue billion Forecast, by Catalyst Type 2020 & 2033
- Table 2: Global Automotive Selective Catalytic Reduction Market Revenue billion Forecast, by Process Type 2020 & 2033
- Table 3: Global Automotive Selective Catalytic Reduction Market Revenue billion Forecast, by Application 2020 & 2033
- Table 4: Global Automotive Selective Catalytic Reduction Market Revenue billion Forecast, by Region 2020 & 2033
- Table 5: Global Automotive Selective Catalytic Reduction Market Revenue billion Forecast, by Catalyst Type 2020 & 2033
- Table 6: Global Automotive Selective Catalytic Reduction Market Revenue billion Forecast, by Process Type 2020 & 2033
- Table 7: Global Automotive Selective Catalytic Reduction Market Revenue billion Forecast, by Application 2020 & 2033
- Table 8: Global Automotive Selective Catalytic Reduction Market Revenue billion Forecast, by Country 2020 & 2033
- Table 9: China Automotive Selective Catalytic Reduction Market Revenue (billion) Forecast, by Application 2020 & 2033
- Table 10: India Automotive Selective Catalytic Reduction Market Revenue (billion) Forecast, by Application 2020 & 2033
- Table 11: Japan Automotive Selective Catalytic Reduction Market Revenue (billion) Forecast, by Application 2020 & 2033
- Table 12: South Korea Automotive Selective Catalytic Reduction Market Revenue (billion) Forecast, by Application 2020 & 2033
- Table 13: ASEAN Countries Automotive Selective Catalytic Reduction Market Revenue (billion) Forecast, by Application 2020 & 2033
- Table 14: Rest of Asia Pacific Automotive Selective Catalytic Reduction Market Revenue (billion) Forecast, by Application 2020 & 2033
- Table 15: Global Automotive Selective Catalytic Reduction Market Revenue billion Forecast, by Catalyst Type 2020 & 2033
- Table 16: Global Automotive Selective Catalytic Reduction Market Revenue billion Forecast, by Process Type 2020 & 2033
- Table 17: Global Automotive Selective Catalytic Reduction Market Revenue billion Forecast, by Application 2020 & 2033
- Table 18: Global Automotive Selective Catalytic Reduction Market Revenue billion Forecast, by Country 2020 & 2033
- Table 19: United States Automotive Selective Catalytic Reduction Market Revenue (billion) Forecast, by Application 2020 & 2033
- Table 20: Canada Automotive Selective Catalytic Reduction Market Revenue (billion) Forecast, by Application 2020 & 2033
- Table 21: Mexico Automotive Selective Catalytic Reduction Market Revenue (billion) Forecast, by Application 2020 & 2033
- Table 22: Global Automotive Selective Catalytic Reduction Market Revenue billion Forecast, by Catalyst Type 2020 & 2033
- Table 23: Global Automotive Selective Catalytic Reduction Market Revenue billion Forecast, by Process Type 2020 & 2033
- Table 24: Global Automotive Selective Catalytic Reduction Market Revenue billion Forecast, by Application 2020 & 2033
- Table 25: Global Automotive Selective Catalytic Reduction Market Revenue billion Forecast, by Country 2020 & 2033
- Table 26: Germany Automotive Selective Catalytic Reduction Market Revenue (billion) Forecast, by Application 2020 & 2033
- Table 27: United Kingdom Automotive Selective Catalytic Reduction Market Revenue (billion) Forecast, by Application 2020 & 2033
- Table 28: Italy Automotive Selective Catalytic Reduction Market Revenue (billion) Forecast, by Application 2020 & 2033
- Table 29: Russia Automotive Selective Catalytic Reduction Market Revenue (billion) Forecast, by Application 2020 & 2033
- Table 30: Rest of the Europe Automotive Selective Catalytic Reduction Market Revenue (billion) Forecast, by Application 2020 & 2033
- Table 31: Global Automotive Selective Catalytic Reduction Market Revenue billion Forecast, by Catalyst Type 2020 & 2033
- Table 32: Global Automotive Selective Catalytic Reduction Market Revenue billion Forecast, by Process Type 2020 & 2033
- Table 33: Global Automotive Selective Catalytic Reduction Market Revenue billion Forecast, by Application 2020 & 2033
- Table 34: Global Automotive Selective Catalytic Reduction Market Revenue billion Forecast, by Country 2020 & 2033
- Table 35: Brazil Automotive Selective Catalytic Reduction Market Revenue (billion) Forecast, by Application 2020 & 2033
- Table 36: Argentina Automotive Selective Catalytic Reduction Market Revenue (billion) Forecast, by Application 2020 & 2033
- Table 37: Rest of South America Automotive Selective Catalytic Reduction Market Revenue (billion) Forecast, by Application 2020 & 2033
- Table 38: Global Automotive Selective Catalytic Reduction Market Revenue billion Forecast, by Catalyst Type 2020 & 2033
- Table 39: Global Automotive Selective Catalytic Reduction Market Revenue billion Forecast, by Process Type 2020 & 2033
- Table 40: Global Automotive Selective Catalytic Reduction Market Revenue billion Forecast, by Application 2020 & 2033
- Table 41: Global Automotive Selective Catalytic Reduction Market Revenue billion Forecast, by Country 2020 & 2033
- Table 42: Saudi Arabia Automotive Selective Catalytic Reduction Market Revenue (billion) Forecast, by Application 2020 & 2033
- Table 43: South Africa Automotive Selective Catalytic Reduction Market Revenue (billion) Forecast, by Application 2020 & 2033
- Table 44: Rest of Middle East and Africa Automotive Selective Catalytic Reduction Market Revenue (billion) Forecast, by Application 2020 & 2033
Frequently Asked Questions
1. What is the projected Compound Annual Growth Rate (CAGR) of the Automotive Selective Catalytic Reduction Market?
The projected CAGR is approximately 11.8%.
2. Which companies are prominent players in the Automotive Selective Catalytic Reduction Market?
Key companies in the market include Umicore*List Not Exhaustive, Honeywell International Inc, Clariant, JGC C&C, CRI Catalyst Company, DCL International Inc, CDTi Advanced Materials Inc, Hitachi Zosen Corporation, CORMETECH, BASF SE, Cataler Corporation, Johnson Matthey, IBIDEN Porzellanfabrik Frauenthal, Corning Incorporated.
3. What are the main segments of the Automotive Selective Catalytic Reduction Market?
The market segments include Catalyst Type, Process Type, Application.
4. Can you provide details about the market size?
The market size is estimated to be USD 13.22 billion as of 2022.
5. What are some drivers contributing to market growth?
Increasing Demand due to Stringent Emission Standards of Developed Countries; Increasing Thermal Power Production Capacity in China and India.
6. What are the notable trends driving market growth?
Power Industry to Dominate the Market.
7. Are there any restraints impacting market growth?
Decline in Coal Based Thermal Power Generation in Western European Countries.
8. Can you provide examples of recent developments in the market?
N/A
9. What pricing options are available for accessing the report?
Pricing options include single-user, multi-user, and enterprise licenses priced at USD 4750, USD 5250, and USD 8750 respectively.
10. Is the market size provided in terms of value or volume?
The market size is provided in terms of value, measured in billion.
11. Are there any specific market keywords associated with the report?
Yes, the market keyword associated with the report is "Automotive Selective Catalytic Reduction Market," which aids in identifying and referencing the specific market segment covered.
12. How do I determine which pricing option suits my needs best?
The pricing options vary based on user requirements and access needs. Individual users may opt for single-user licenses, while businesses requiring broader access may choose multi-user or enterprise licenses for cost-effective access to the report.
13. Are there any additional resources or data provided in the Automotive Selective Catalytic Reduction Market report?
While the report offers comprehensive insights, it's advisable to review the specific contents or supplementary materials provided to ascertain if additional resources or data are available.
14. How can I stay updated on further developments or reports in the Automotive Selective Catalytic Reduction Market?
To stay informed about further developments, trends, and reports in the Automotive Selective Catalytic Reduction Market, consider subscribing to industry newsletters, following relevant companies and organizations, or regularly checking reputable industry news sources and publications.
Methodology
Step 1 - Identification of Relevant Samples Size from Population Database


Step 2 - Approaches for Defining Global Market Size (Value, Volume* & Price*)

Note*: In applicable scenarios
Step 3 - Data Sources
Primary Research
- Web Analytics
- Survey Reports
- Research Institute
- Latest Research Reports
- Opinion Leaders
Secondary Research
- Annual Reports
- White Paper
- Latest Press Release
- Industry Association
- Paid Database
- Investor Presentations

Step 4 - Data Triangulation
Involves using different sources of information in order to increase the validity of a study
These sources are likely to be stakeholders in a program - participants, other researchers, program staff, other community members, and so on.
Then we put all data in single framework & apply various statistical tools to find out the dynamic on the market.
During the analysis stage, feedback from the stakeholder groups would be compared to determine areas of agreement as well as areas of divergence