

Key Insights
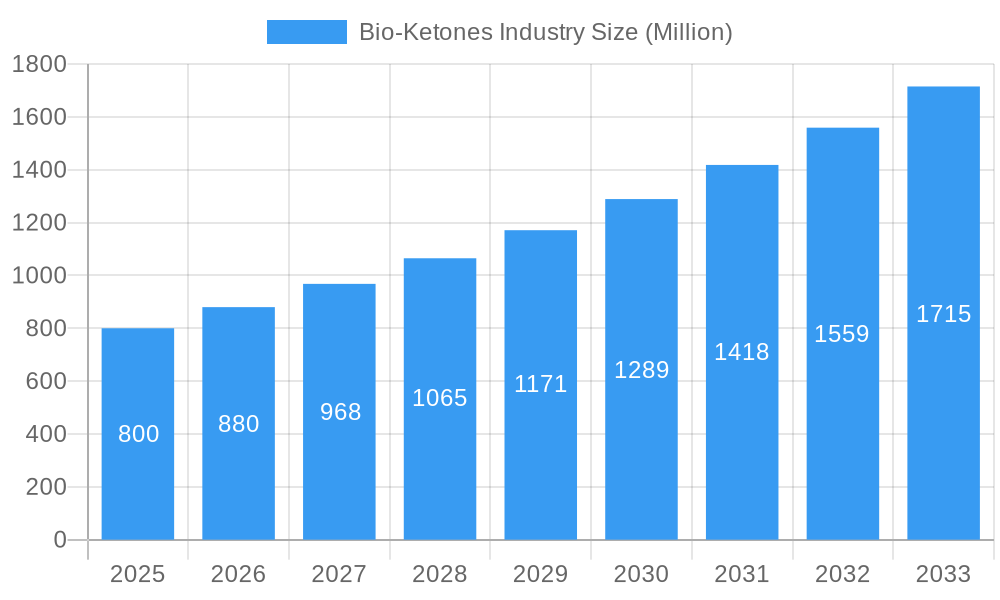
The global bio-ketones market is poised for substantial expansion, driven by escalating demand for sustainable, naturally derived ingredients across diverse industries. A projected Compound Annual Growth Rate (CAGR) of 5.9% is anticipated, propelling the market size from an estimated $24.25 billion in the base year 2025 to significant future valuations. Key growth catalysts include heightened consumer preference for natural and healthier products in food and beverages, expanding applications in cosmetics and personal care for their beneficial properties, and the increasing adoption of bio-based alternatives in pharmaceuticals and chemicals to reduce petrochemical dependency. Continuous research and development focused on enhancing production efficiency and broadening application scope further energize market dynamics. While production scaling and regulatory navigation present challenges, the long-term outlook for the bio-ketones market remains exceptionally robust.
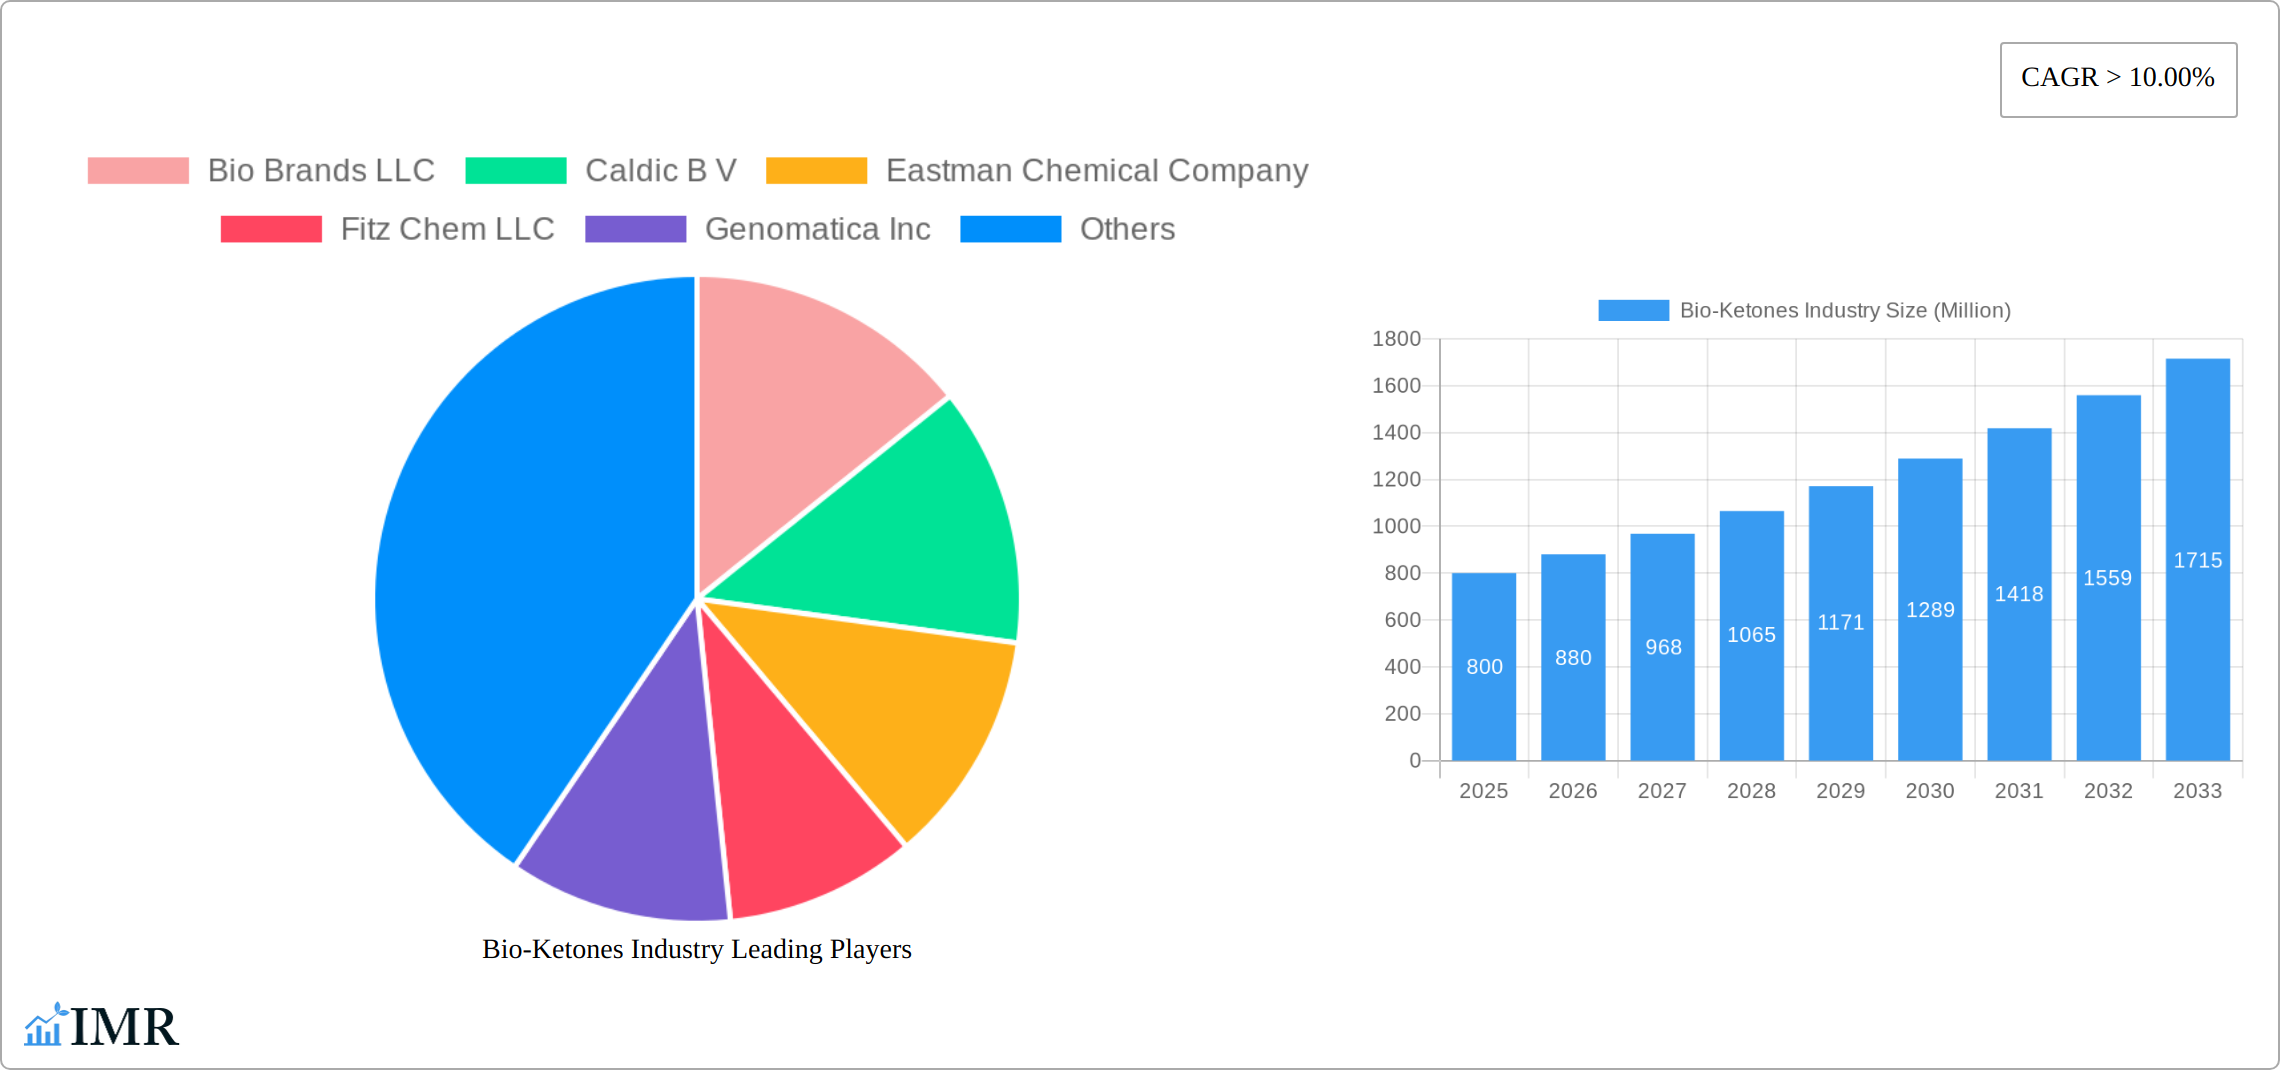
Bio-Ketones Industry Market Size (In Billion)
The bio-ketones market encompasses various types, such as acetoacetate and beta-hydroxybutyrate, each tailored for specific applications. Leading market participants including Bio Brands LLC, Caldic B.V., Eastman Chemical Company, and Genomatica Inc. are actively driving innovation and strategic collaborations. Regional growth trajectories will vary, with areas demonstrating strong consumer demand for natural products and advanced research infrastructure expected to lead expansion. The historical period (prior to 2025) established a foundation for strong projected growth through 2033. The market size, estimated at $24.25 billion in 2025 with a CAGR of 5.9%, is set for considerable growth by 2033.
Bio-Ketones Industry Company Market Share
Bio-Ketones Industry Market Report: 2019-2033
This comprehensive report provides an in-depth analysis of the Bio-Ketones industry, encompassing market dynamics, growth trends, regional analysis, competitive landscape, and future outlook. The study period covers 2019-2033, with 2025 as the base and estimated year. The report offers invaluable insights for industry professionals, investors, and stakeholders seeking to understand and capitalize on the opportunities within this rapidly evolving market. The total market size in 2025 is estimated at xx Million.
Bio-Ketones Industry Market Dynamics & Structure
The global Bio-Ketones market presents a dynamic and evolving landscape, characterized by a moderately concentrated structure. Key industry leaders, including Eastman Chemical Company, Genomatica Inc., and Merck KGaA, currently command a significant portion of the market share. A pivotal force shaping this industry is relentless technological innovation. Advancements in cutting-edge fermentation technologies and highly efficient biocatalysis are continuously improving production processes, leading to enhanced efficiency and a reduction in manufacturing costs. The operational framework of the industry is also significantly influenced by stringent regulatory environments governing crucial aspects like food safety and overall environmental impact. While the market faces inherent competition from conventionally chemically synthesized ketones, a pronounced and growing consumer preference for sustainable, naturally derived, and health-conscious products is a substantial tailwind for bio-ketones. The industry is also experiencing a notable surge in Merger and Acquisition (M&A) activity, with approximately xx deals recorded between 2019 and 2024. This trend underscores ongoing consolidation efforts and strategic expansion initiatives by market participants. The end-user base for bio-ketones is notably diverse, spanning critical sectors such as the food and beverage, pharmaceutical, and cosmetic industries, among others.
- Market Concentration: Moderately concentrated, with the top 5 players projected to hold approximately xx% of the market share in 2025.
- Technological Innovation: Continuous advancements in fermentation techniques and sophisticated biocatalysis are the primary drivers of innovation and efficiency.
- Regulatory Landscape: Stringent and evolving regulations concerning food safety standards and environmental sustainability are key considerations.
- Competitive Substitutes: The market contends with competition from traditional, chemically synthesized ketones.
- End-User Demographics: Diverse applications across Food & Beverage, Pharmaceuticals, Cosmetics, Dietary Supplements, and other emerging sectors.
- M&A Activity: A total of xx strategic deals were executed between 2019 and 2024, with an average deal value of approximately xx Million, indicating market consolidation and strategic growth.
Bio-Ketones Industry Growth Trends & Insights
The Bio-Ketones market is poised for robust growth, significantly propelled by an escalating consumer demand for products that are both natural and sustainably sourced. Over the historical period from 2019 to 2024, the market demonstrated a Compound Annual Growth Rate (CAGR) of xx%, culminating in a market size of xx Million in 2024. This upward trajectory is anticipated to persist through the forecast period (2025-2033), with an estimated CAGR of xx%, projecting the market to reach an impressive xx Million by 2033. Key enablers of this expansion include ongoing technological advancements, such as the optimization of fermentation processes and breakthroughs in enzyme engineering, which are accelerating the adoption rates of bio-ketones. Furthermore, a palpable shift in consumer behavior towards health-conscious lifestyles and a heightened awareness regarding the manifold benefits of bio-based products are collectively contributing to the market's burgeoning expansion. Current market penetration stands at approximately xx%, with projections indicating a rise to xx% by 2033. Specific high-growth application areas, notably in dietary supplements and functional foods, are proving to be significant demand drivers.
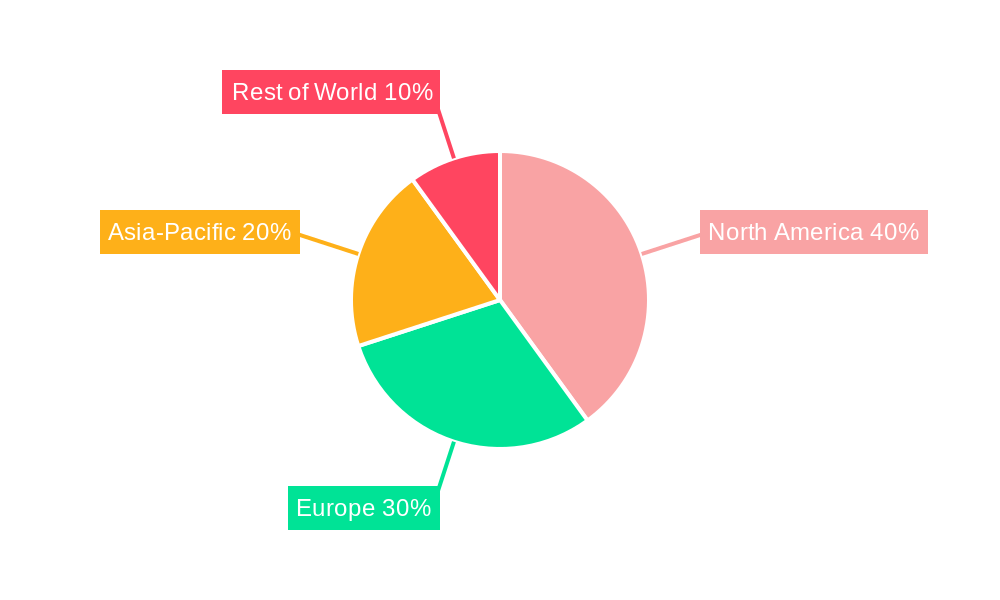
Dominant Regions, Countries, or Segments in Bio-Ketones Industry
Currently, North America stands as the leading market for bio-ketones, largely owing to substantial demand from its vibrant food and beverage sector and a well-established, supportive regulatory framework that champions bio-based products. Europe follows closely, representing a significant market share, driven by a heightened consumer consciousness regarding sustainable and naturally derived products. The Asia-Pacific region is projected to emerge as the fastest-growing market over the forecast period. This accelerated growth is attributed to the rapidly expanding economies and increasing disposable incomes in key nations such as China and India, alongside a burgeoning demand for food and beverage products.
- North America: Dominant market, fueled by robust demand in the food & beverage industry, supportive regulatory policies, and high consumer awareness of natural products.
- Europe: A substantial market player, driven by a strong and growing consumer preference for sustainable and natural alternatives.
- Asia-Pacific: Identified as the fastest-growing region, propelled by rising disposable incomes and the expanding food and beverage sectors in major economies like China and India.
- Market Share (2025 Projection): North America is expected to hold xx%, Europe xx%, Asia-Pacific xx%, and the Rest of the World xx% of the global market.
Bio-Ketones Industry Product Landscape
The Bio-Ketones market offers a range of products, including beta-hydroxybutyrate (BHB), acetoacetate, and acetone. These products find applications in diverse sectors, including dietary supplements, functional foods, cosmetics, and pharmaceuticals. Innovations focus on enhancing product purity, improving production efficiency, and developing novel applications. The unique selling proposition of bio-ketones lies in their natural origin and potential health benefits. Technological advancements in fermentation and downstream processing are continually improving product quality and reducing production costs.
Key Drivers, Barriers & Challenges in Bio-Ketones Industry
Key Drivers:
- Increasing consumer demand for natural and sustainable products.
- Growing awareness of the health benefits of ketones.
- Technological advancements in fermentation and biocatalysis.
- Favorable government policies promoting bio-based industries.
Key Barriers & Challenges:
- High production costs compared to chemically synthesized ketones.
- Supply chain complexities and potential bottlenecks.
- Stringent regulatory approvals for food and pharmaceutical applications.
- Intense competition from established chemical manufacturers.
Emerging Opportunities in Bio-Ketones Industry
Emerging opportunities exist in expanding into untapped markets, like personalized nutrition and specialized dietary supplements. Innovative applications in cosmetics and pharmaceuticals are also gaining traction. Further research into the potential health benefits of bio-ketones could open new avenues for growth. Evolving consumer preferences towards personalized health solutions represent a significant opportunity.
Growth Accelerators in the Bio-Ketones Industry
The long-term growth trajectory of the bio-ketones industry is significantly influenced by continuous technological advancements, particularly in the realms of precision fermentation and advanced enzyme engineering. These innovations are key to unlocking new production efficiencies and developing novel bio-ketone applications. Strategic alliances and collaborative ventures between bio-ketone manufacturers and downstream application developers are crucial for broadening market reach and facilitating product integration. Furthermore, the strategic expansion into new and emerging geographical markets, with a particular focus on developing economies, presents a substantial catalyst for market growth and revenue diversification.
Key Players Shaping the Bio-Ketones Industry Market
- Bio Brands LLC
- Caldic B V
- Eastman Chemical Company
- Fitz Chem LLC
- Genomatica Inc
- Green Biologics Limited
- LANZATECH
- Merck KGaA
Notable Milestones in Bio-Ketones Industry Sector
- 2020: Genomatica announces a significant expansion of its bio-based ketone production facility.
- 2022: Eastman Chemical Company launches a new line of bio-based ketone ingredients for the cosmetics industry.
- 2023: A major merger occurs between two key players in the bio-ketones sector (names and details unavailable).
In-Depth Bio-Ketones Industry Market Outlook
The global bio-ketones market is on a clear path towards substantial and sustained growth in the foreseeable future. This optimistic outlook is underpinned by the synergistic forces of ongoing technological innovation, escalating consumer demand for healthier and more sustainable options, and increasingly supportive regulatory environments. For companies operating within this dynamic sector, forging strategic partnerships and pursuing market diversification will be paramount to effectively capitalize on emerging opportunities and solidify a robust competitive standing. The industry is also anticipated to experience significant consolidation, with larger, established players actively acquiring smaller companies to augment their market share, production capabilities, and product portfolios, thereby further shaping the competitive landscape.
Bio-Ketones Industry Segmentation
-
1. Product Type
- 1.1. Bio MEK
- 1.2. Bio PEEK
- 1.3. Bio Acetone
- 1.4. Other Product Types
-
2. End-user Industry
- 2.1. Paints and Coatings
- 2.2. Automobile
- 2.3. Infrastructure
- 2.4. Pharmaceutical
- 2.5. Other End-user Industries
Bio-Ketones Industry Segmentation By Geography
-
1. Asia Pacific
- 1.1. China
- 1.2. India
- 1.3. Japan
- 1.4. South Korea
- 1.5. ASEAN Countries
- 1.6. Rest of Asia Pacific
-
2. North America
- 2.1. United States
- 2.2. Canada
- 2.3. Mexico
-
3. Europe
- 3.1. Germany
- 3.2. United Kingdom
- 3.3. Italy
- 3.4. France
- 3.5. Rest of Europe
-
4. South America
- 4.1. Brazil
- 4.2. Argentina
- 4.3. Rest of South America
-
5. Middle East and Africa
- 5.1. Saudi Arabia
- 5.2. South Africa
- 5.3. Rest of Middle East and Africa
Bio-Ketones Industry Regional Market Share
Geographic Coverage of Bio-Ketones Industry
Bio-Ketones Industry REPORT HIGHLIGHTS
| Aspects | Details |
|---|---|
| Study Period | 2020-2034 |
| Base Year | 2025 |
| Estimated Year | 2026 |
| Forecast Period | 2026-2034 |
| Historical Period | 2020-2025 |
| Growth Rate | CAGR of 5.9% from 2020-2034 |
| Segmentation |
|
Table of Contents
- 1. Introduction
- 1.1. Research Scope
- 1.2. Market Segmentation
- 1.3. Research Objective
- 1.4. Definitions and Assumptions
- 2. Executive Summary
- 2.1. Market Snapshot
- 3. Market Dynamics
- 3.1. Market Drivers
- 3.2. Market Restrains
- 3.3. Market Trends
- 3.4. Market Opportunities
- 4. Market Factor Analysis
- 4.1. Porters Five Forces
- 4.1.1. Bargaining Power of Suppliers
- 4.1.2. Bargaining Power of Buyers
- 4.1.3. Threat of New Entrants
- 4.1.4. Threat of Substitutes
- 4.1.5. Competitive Rivalry
- 4.2. PESTEL analysis
- 4.3. BCG Analysis
- 4.3.1. Stars (High Growth, High Market Share)
- 4.3.2. Cash Cows (Low Growth, High Market Share)
- 4.3.3. Question Mark (High Growth, Low Market Share)
- 4.3.4. Dogs (Low Growth, Low Market Share)
- 4.4. Ansoff Matrix Analysis
- 4.5. Supply Chain Analysis
- 4.6. Regulatory Landscape
- 4.7. Current Market Potential and Opportunity Assessment (TAM–SAM–SOM Framework)
- 4.8. IMR Analyst Note
- 4.1. Porters Five Forces
- 5. Market Analysis, Insights and Forecast 2021-2033
- 5.1. Market Analysis, Insights and Forecast - by Product Type
- 5.1.1. Bio MEK
- 5.1.2. Bio PEEK
- 5.1.3. Bio Acetone
- 5.1.4. Other Product Types
- 5.2. Market Analysis, Insights and Forecast - by End-user Industry
- 5.2.1. Paints and Coatings
- 5.2.2. Automobile
- 5.2.3. Infrastructure
- 5.2.4. Pharmaceutical
- 5.2.5. Other End-user Industries
- 5.3. Market Analysis, Insights and Forecast - by Region
- 5.3.1. Asia Pacific
- 5.3.2. North America
- 5.3.3. Europe
- 5.3.4. South America
- 5.3.5. Middle East and Africa
- 5.1. Market Analysis, Insights and Forecast - by Product Type
- 6. Global Bio-Ketones Industry Analysis, Insights and Forecast, 2021-2033
- 6.1. Market Analysis, Insights and Forecast - by Product Type
- 6.1.1. Bio MEK
- 6.1.2. Bio PEEK
- 6.1.3. Bio Acetone
- 6.1.4. Other Product Types
- 6.2. Market Analysis, Insights and Forecast - by End-user Industry
- 6.2.1. Paints and Coatings
- 6.2.2. Automobile
- 6.2.3. Infrastructure
- 6.2.4. Pharmaceutical
- 6.2.5. Other End-user Industries
- 6.1. Market Analysis, Insights and Forecast - by Product Type
- 7. Asia Pacific Bio-Ketones Industry Analysis, Insights and Forecast, 2020-2032
- 7.1. Market Analysis, Insights and Forecast - by Product Type
- 7.1.1. Bio MEK
- 7.1.2. Bio PEEK
- 7.1.3. Bio Acetone
- 7.1.4. Other Product Types
- 7.2. Market Analysis, Insights and Forecast - by End-user Industry
- 7.2.1. Paints and Coatings
- 7.2.2. Automobile
- 7.2.3. Infrastructure
- 7.2.4. Pharmaceutical
- 7.2.5. Other End-user Industries
- 7.1. Market Analysis, Insights and Forecast - by Product Type
- 8. North America Bio-Ketones Industry Analysis, Insights and Forecast, 2020-2032
- 8.1. Market Analysis, Insights and Forecast - by Product Type
- 8.1.1. Bio MEK
- 8.1.2. Bio PEEK
- 8.1.3. Bio Acetone
- 8.1.4. Other Product Types
- 8.2. Market Analysis, Insights and Forecast - by End-user Industry
- 8.2.1. Paints and Coatings
- 8.2.2. Automobile
- 8.2.3. Infrastructure
- 8.2.4. Pharmaceutical
- 8.2.5. Other End-user Industries
- 8.1. Market Analysis, Insights and Forecast - by Product Type
- 9. Europe Bio-Ketones Industry Analysis, Insights and Forecast, 2020-2032
- 9.1. Market Analysis, Insights and Forecast - by Product Type
- 9.1.1. Bio MEK
- 9.1.2. Bio PEEK
- 9.1.3. Bio Acetone
- 9.1.4. Other Product Types
- 9.2. Market Analysis, Insights and Forecast - by End-user Industry
- 9.2.1. Paints and Coatings
- 9.2.2. Automobile
- 9.2.3. Infrastructure
- 9.2.4. Pharmaceutical
- 9.2.5. Other End-user Industries
- 9.1. Market Analysis, Insights and Forecast - by Product Type
- 10. South America Bio-Ketones Industry Analysis, Insights and Forecast, 2020-2032
- 10.1. Market Analysis, Insights and Forecast - by Product Type
- 10.1.1. Bio MEK
- 10.1.2. Bio PEEK
- 10.1.3. Bio Acetone
- 10.1.4. Other Product Types
- 10.2. Market Analysis, Insights and Forecast - by End-user Industry
- 10.2.1. Paints and Coatings
- 10.2.2. Automobile
- 10.2.3. Infrastructure
- 10.2.4. Pharmaceutical
- 10.2.5. Other End-user Industries
- 10.1. Market Analysis, Insights and Forecast - by Product Type
- 11. Middle East and Africa Bio-Ketones Industry Analysis, Insights and Forecast, 2020-2032
- 11.1. Market Analysis, Insights and Forecast - by Product Type
- 11.1.1. Bio MEK
- 11.1.2. Bio PEEK
- 11.1.3. Bio Acetone
- 11.1.4. Other Product Types
- 11.2. Market Analysis, Insights and Forecast - by End-user Industry
- 11.2.1. Paints and Coatings
- 11.2.2. Automobile
- 11.2.3. Infrastructure
- 11.2.4. Pharmaceutical
- 11.2.5. Other End-user Industries
- 11.1. Market Analysis, Insights and Forecast - by Product Type
- 12. Competitive Analysis
- 12.1. Company Profiles
- 12.1.1 Bio Brands LLC
- 12.1.1.1. Company Overview
- 12.1.1.2. Products
- 12.1.1.3. Company Financials
- 12.1.1.4. SWOT Analysis
- 12.1.2 Caldic B V
- 12.1.2.1. Company Overview
- 12.1.2.2. Products
- 12.1.2.3. Company Financials
- 12.1.2.4. SWOT Analysis
- 12.1.3 Eastman Chemical Company
- 12.1.3.1. Company Overview
- 12.1.3.2. Products
- 12.1.3.3. Company Financials
- 12.1.3.4. SWOT Analysis
- 12.1.4 Fitz Chem LLC
- 12.1.4.1. Company Overview
- 12.1.4.2. Products
- 12.1.4.3. Company Financials
- 12.1.4.4. SWOT Analysis
- 12.1.5 Genomatica Inc
- 12.1.5.1. Company Overview
- 12.1.5.2. Products
- 12.1.5.3. Company Financials
- 12.1.5.4. SWOT Analysis
- 12.1.6 Green Biologics Limited
- 12.1.6.1. Company Overview
- 12.1.6.2. Products
- 12.1.6.3. Company Financials
- 12.1.6.4. SWOT Analysis
- 12.1.7 LANZATECH
- 12.1.7.1. Company Overview
- 12.1.7.2. Products
- 12.1.7.3. Company Financials
- 12.1.7.4. SWOT Analysis
- 12.1.8 Merck KGaA*List Not Exhaustive
- 12.1.8.1. Company Overview
- 12.1.8.2. Products
- 12.1.8.3. Company Financials
- 12.1.8.4. SWOT Analysis
- 12.1.1 Bio Brands LLC
- 12.2. Market Entropy
- 12.2.1 Company's Key Areas Served
- 12.2.2 Recent Developments
- 12.3. Company Market Share Analysis 2025
- 12.3.1 Top 5 Companies Market Share Analysis
- 12.3.2 Top 3 Companies Market Share Analysis
- 12.4. List of Potential Customers
- 13. Research Methodology
List of Figures
- Figure 1: Global Bio-Ketones Industry Revenue Breakdown (billion, %) by Region 2025 & 2033
- Figure 2: Asia Pacific Bio-Ketones Industry Revenue (billion), by Product Type 2025 & 2033
- Figure 3: Asia Pacific Bio-Ketones Industry Revenue Share (%), by Product Type 2025 & 2033
- Figure 4: Asia Pacific Bio-Ketones Industry Revenue (billion), by End-user Industry 2025 & 2033
- Figure 5: Asia Pacific Bio-Ketones Industry Revenue Share (%), by End-user Industry 2025 & 2033
- Figure 6: Asia Pacific Bio-Ketones Industry Revenue (billion), by Country 2025 & 2033
- Figure 7: Asia Pacific Bio-Ketones Industry Revenue Share (%), by Country 2025 & 2033
- Figure 8: North America Bio-Ketones Industry Revenue (billion), by Product Type 2025 & 2033
- Figure 9: North America Bio-Ketones Industry Revenue Share (%), by Product Type 2025 & 2033
- Figure 10: North America Bio-Ketones Industry Revenue (billion), by End-user Industry 2025 & 2033
- Figure 11: North America Bio-Ketones Industry Revenue Share (%), by End-user Industry 2025 & 2033
- Figure 12: North America Bio-Ketones Industry Revenue (billion), by Country 2025 & 2033
- Figure 13: North America Bio-Ketones Industry Revenue Share (%), by Country 2025 & 2033
- Figure 14: Europe Bio-Ketones Industry Revenue (billion), by Product Type 2025 & 2033
- Figure 15: Europe Bio-Ketones Industry Revenue Share (%), by Product Type 2025 & 2033
- Figure 16: Europe Bio-Ketones Industry Revenue (billion), by End-user Industry 2025 & 2033
- Figure 17: Europe Bio-Ketones Industry Revenue Share (%), by End-user Industry 2025 & 2033
- Figure 18: Europe Bio-Ketones Industry Revenue (billion), by Country 2025 & 2033
- Figure 19: Europe Bio-Ketones Industry Revenue Share (%), by Country 2025 & 2033
- Figure 20: South America Bio-Ketones Industry Revenue (billion), by Product Type 2025 & 2033
- Figure 21: South America Bio-Ketones Industry Revenue Share (%), by Product Type 2025 & 2033
- Figure 22: South America Bio-Ketones Industry Revenue (billion), by End-user Industry 2025 & 2033
- Figure 23: South America Bio-Ketones Industry Revenue Share (%), by End-user Industry 2025 & 2033
- Figure 24: South America Bio-Ketones Industry Revenue (billion), by Country 2025 & 2033
- Figure 25: South America Bio-Ketones Industry Revenue Share (%), by Country 2025 & 2033
- Figure 26: Middle East and Africa Bio-Ketones Industry Revenue (billion), by Product Type 2025 & 2033
- Figure 27: Middle East and Africa Bio-Ketones Industry Revenue Share (%), by Product Type 2025 & 2033
- Figure 28: Middle East and Africa Bio-Ketones Industry Revenue (billion), by End-user Industry 2025 & 2033
- Figure 29: Middle East and Africa Bio-Ketones Industry Revenue Share (%), by End-user Industry 2025 & 2033
- Figure 30: Middle East and Africa Bio-Ketones Industry Revenue (billion), by Country 2025 & 2033
- Figure 31: Middle East and Africa Bio-Ketones Industry Revenue Share (%), by Country 2025 & 2033
List of Tables
- Table 1: Global Bio-Ketones Industry Revenue billion Forecast, by Product Type 2020 & 2033
- Table 2: Global Bio-Ketones Industry Revenue billion Forecast, by End-user Industry 2020 & 2033
- Table 3: Global Bio-Ketones Industry Revenue billion Forecast, by Region 2020 & 2033
- Table 4: Global Bio-Ketones Industry Revenue billion Forecast, by Product Type 2020 & 2033
- Table 5: Global Bio-Ketones Industry Revenue billion Forecast, by End-user Industry 2020 & 2033
- Table 6: Global Bio-Ketones Industry Revenue billion Forecast, by Country 2020 & 2033
- Table 7: China Bio-Ketones Industry Revenue (billion) Forecast, by Application 2020 & 2033
- Table 8: India Bio-Ketones Industry Revenue (billion) Forecast, by Application 2020 & 2033
- Table 9: Japan Bio-Ketones Industry Revenue (billion) Forecast, by Application 2020 & 2033
- Table 10: South Korea Bio-Ketones Industry Revenue (billion) Forecast, by Application 2020 & 2033
- Table 11: ASEAN Countries Bio-Ketones Industry Revenue (billion) Forecast, by Application 2020 & 2033
- Table 12: Rest of Asia Pacific Bio-Ketones Industry Revenue (billion) Forecast, by Application 2020 & 2033
- Table 13: Global Bio-Ketones Industry Revenue billion Forecast, by Product Type 2020 & 2033
- Table 14: Global Bio-Ketones Industry Revenue billion Forecast, by End-user Industry 2020 & 2033
- Table 15: Global Bio-Ketones Industry Revenue billion Forecast, by Country 2020 & 2033
- Table 16: United States Bio-Ketones Industry Revenue (billion) Forecast, by Application 2020 & 2033
- Table 17: Canada Bio-Ketones Industry Revenue (billion) Forecast, by Application 2020 & 2033
- Table 18: Mexico Bio-Ketones Industry Revenue (billion) Forecast, by Application 2020 & 2033
- Table 19: Global Bio-Ketones Industry Revenue billion Forecast, by Product Type 2020 & 2033
- Table 20: Global Bio-Ketones Industry Revenue billion Forecast, by End-user Industry 2020 & 2033
- Table 21: Global Bio-Ketones Industry Revenue billion Forecast, by Country 2020 & 2033
- Table 22: Germany Bio-Ketones Industry Revenue (billion) Forecast, by Application 2020 & 2033
- Table 23: United Kingdom Bio-Ketones Industry Revenue (billion) Forecast, by Application 2020 & 2033
- Table 24: Italy Bio-Ketones Industry Revenue (billion) Forecast, by Application 2020 & 2033
- Table 25: France Bio-Ketones Industry Revenue (billion) Forecast, by Application 2020 & 2033
- Table 26: Rest of Europe Bio-Ketones Industry Revenue (billion) Forecast, by Application 2020 & 2033
- Table 27: Global Bio-Ketones Industry Revenue billion Forecast, by Product Type 2020 & 2033
- Table 28: Global Bio-Ketones Industry Revenue billion Forecast, by End-user Industry 2020 & 2033
- Table 29: Global Bio-Ketones Industry Revenue billion Forecast, by Country 2020 & 2033
- Table 30: Brazil Bio-Ketones Industry Revenue (billion) Forecast, by Application 2020 & 2033
- Table 31: Argentina Bio-Ketones Industry Revenue (billion) Forecast, by Application 2020 & 2033
- Table 32: Rest of South America Bio-Ketones Industry Revenue (billion) Forecast, by Application 2020 & 2033
- Table 33: Global Bio-Ketones Industry Revenue billion Forecast, by Product Type 2020 & 2033
- Table 34: Global Bio-Ketones Industry Revenue billion Forecast, by End-user Industry 2020 & 2033
- Table 35: Global Bio-Ketones Industry Revenue billion Forecast, by Country 2020 & 2033
- Table 36: Saudi Arabia Bio-Ketones Industry Revenue (billion) Forecast, by Application 2020 & 2033
- Table 37: South Africa Bio-Ketones Industry Revenue (billion) Forecast, by Application 2020 & 2033
- Table 38: Rest of Middle East and Africa Bio-Ketones Industry Revenue (billion) Forecast, by Application 2020 & 2033
Frequently Asked Questions
1. What is the projected Compound Annual Growth Rate (CAGR) of the Bio-Ketones Industry?
The projected CAGR is approximately 5.9%.
2. Which companies are prominent players in the Bio-Ketones Industry?
Key companies in the market include Bio Brands LLC, Caldic B V, Eastman Chemical Company, Fitz Chem LLC, Genomatica Inc, Green Biologics Limited, LANZATECH, Merck KGaA*List Not Exhaustive.
3. What are the main segments of the Bio-Ketones Industry?
The market segments include Product Type, End-user Industry.
4. Can you provide details about the market size?
The market size is estimated to be USD 24.25 billion as of 2022.
5. What are some drivers contributing to market growth?
; Increasing Demand from Cosmetics and Personal Care Industry; Supporting Government Regulations for the Use of Bio-products.
6. What are the notable trends driving market growth?
Bio PEEK to Dominate the Market.
7. Are there any restraints impacting market growth?
; Increasing Demand from Cosmetics and Personal Care Industry; Supporting Government Regulations for the Use of Bio-products.
8. Can you provide examples of recent developments in the market?
N/A
9. What pricing options are available for accessing the report?
Pricing options include single-user, multi-user, and enterprise licenses priced at USD 4750, USD 5250, and USD 8750 respectively.
10. Is the market size provided in terms of value or volume?
The market size is provided in terms of value, measured in billion.
11. Are there any specific market keywords associated with the report?
Yes, the market keyword associated with the report is "Bio-Ketones Industry," which aids in identifying and referencing the specific market segment covered.
12. How do I determine which pricing option suits my needs best?
The pricing options vary based on user requirements and access needs. Individual users may opt for single-user licenses, while businesses requiring broader access may choose multi-user or enterprise licenses for cost-effective access to the report.
13. Are there any additional resources or data provided in the Bio-Ketones Industry report?
While the report offers comprehensive insights, it's advisable to review the specific contents or supplementary materials provided to ascertain if additional resources or data are available.
14. How can I stay updated on further developments or reports in the Bio-Ketones Industry?
To stay informed about further developments, trends, and reports in the Bio-Ketones Industry, consider subscribing to industry newsletters, following relevant companies and organizations, or regularly checking reputable industry news sources and publications.
Methodology
Step 1 - Identification of Relevant Samples Size from Population Database


Step 2 - Approaches for Defining Global Market Size (Value, Volume* & Price*)

Note*: In applicable scenarios
Step 3 - Data Sources
Primary Research
- Web Analytics
- Survey Reports
- Research Institute
- Latest Research Reports
- Opinion Leaders
Secondary Research
- Annual Reports
- White Paper
- Latest Press Release
- Industry Association
- Paid Database
- Investor Presentations

Step 4 - Data Triangulation
Involves using different sources of information in order to increase the validity of a study
These sources are likely to be stakeholders in a program - participants, other researchers, program staff, other community members, and so on.
Then we put all data in single framework & apply various statistical tools to find out the dynamic on the market.
During the analysis stage, feedback from the stakeholder groups would be compared to determine areas of agreement as well as areas of divergence