

Key Insights
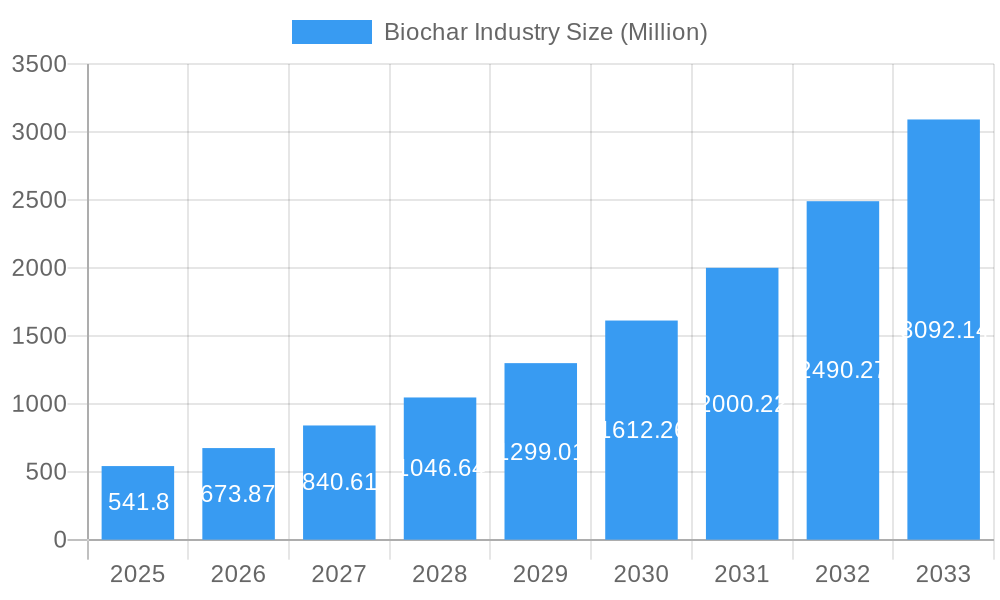
The biochar industry is experiencing robust growth, projected to reach a market size of $541.8 million in 2025 and exhibiting a Compound Annual Growth Rate (CAGR) exceeding 24.50%. This significant expansion is driven by increasing demand for sustainable soil amendment solutions in agriculture and animal farming, coupled with the growing adoption of biochar in industrial applications like water purification and carbon sequestration. Technological advancements in pyrolysis and gasification systems are further fueling market growth, offering efficient and cost-effective biochar production methods. While challenges such as high initial investment costs for biochar production facilities and inconsistent biochar quality remain, the environmental benefits and economic potential of biochar are attracting significant investments and driving innovation. The market segmentation reveals a diverse range of applications, with agriculture currently dominating, followed by industrial uses and animal farming. Geographically, North America and Europe hold substantial market shares, but the Asia-Pacific region is expected to witness the fastest growth rate due to its expanding agricultural sector and increasing focus on environmental sustainability. The presence of established players like Arsta Eco and emerging companies like Biochar Now LLC showcases the competitive landscape, driving further innovation and market penetration.
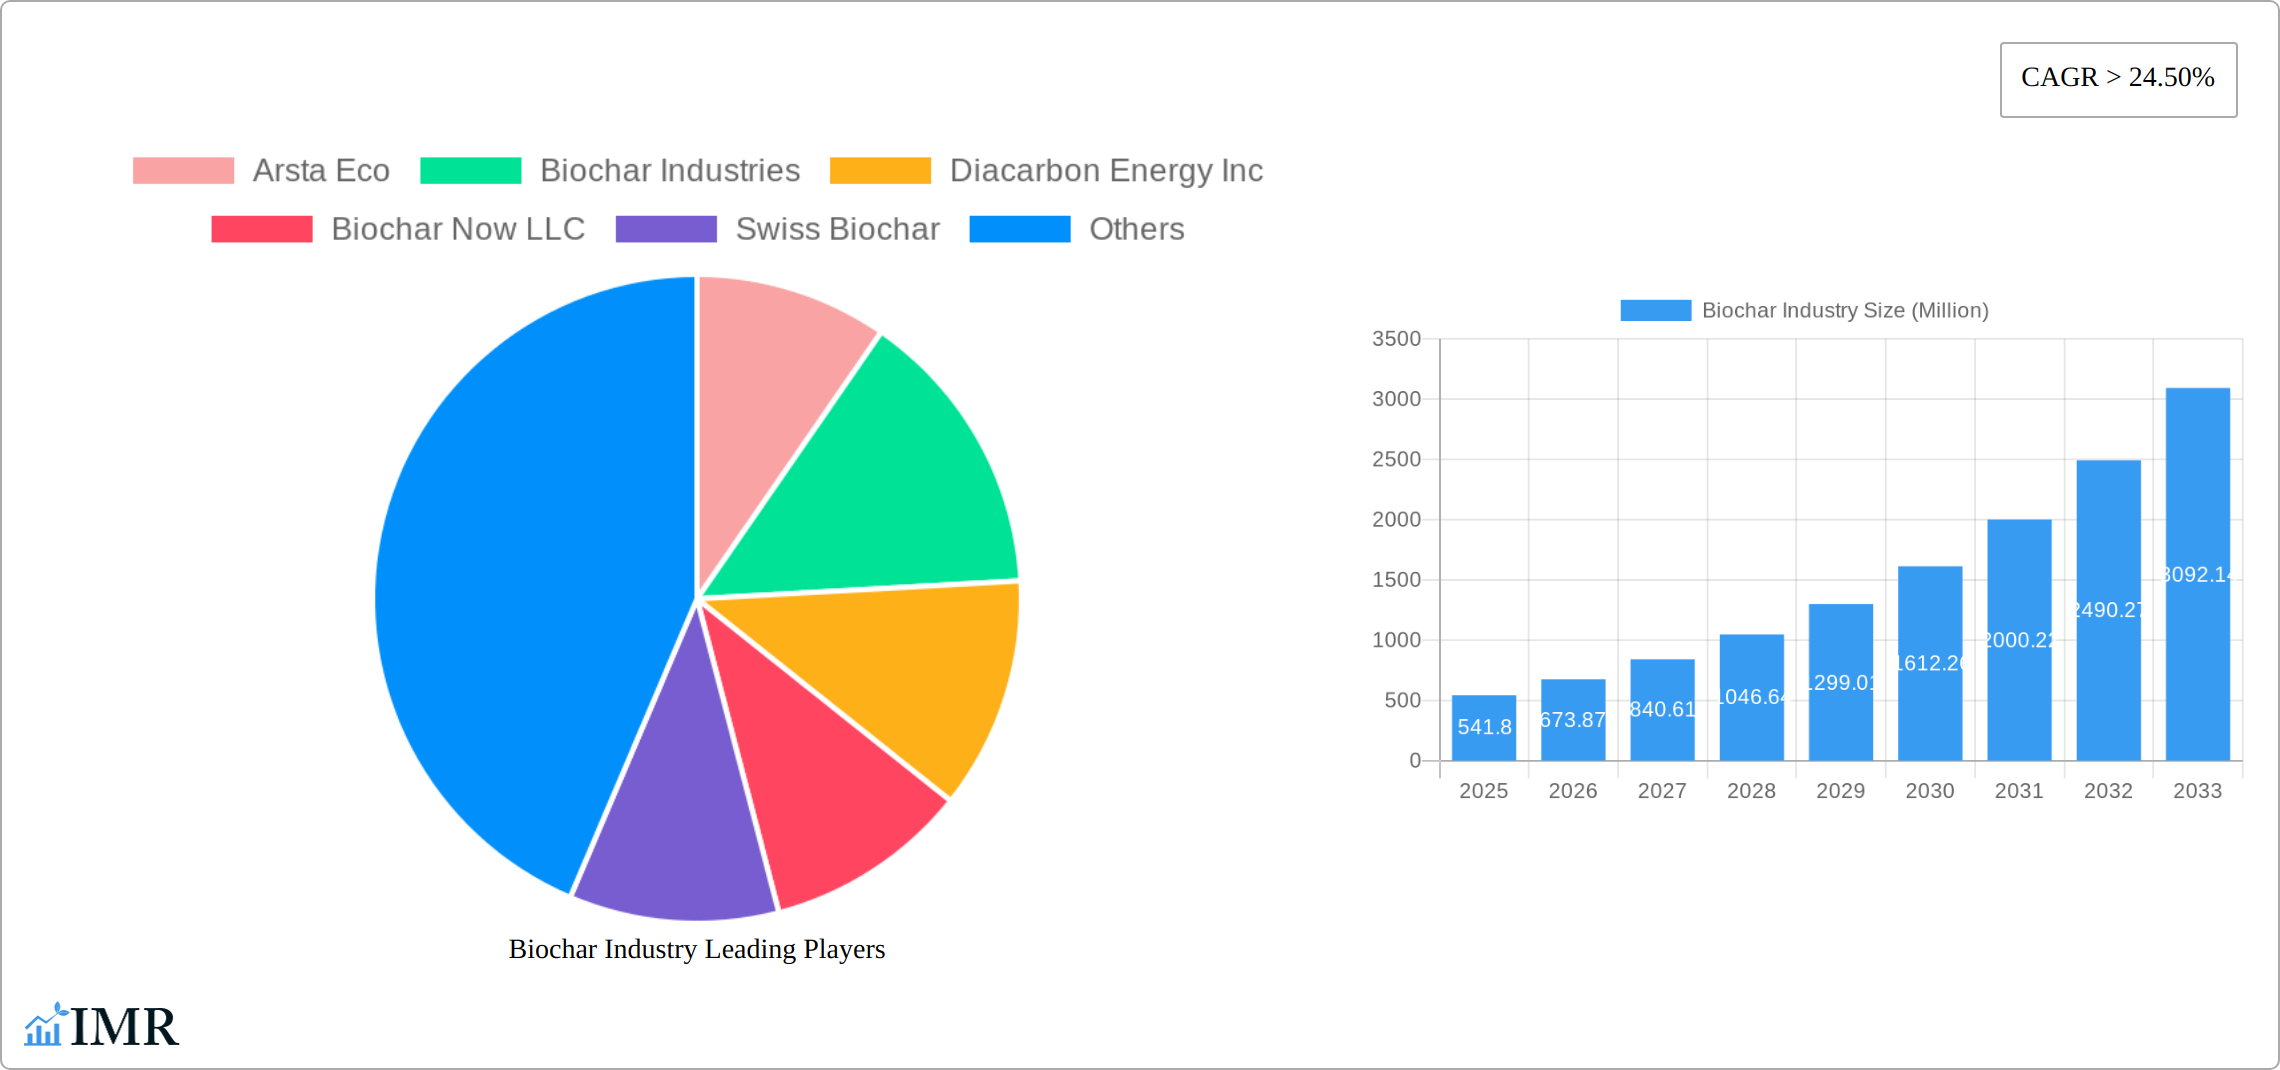
Biochar Industry Market Size (In Million)
The forecast period (2025-2033) anticipates continued expansion, driven by governmental policies promoting sustainable agriculture and waste management. The increasing awareness of biochar’s potential to mitigate climate change through carbon sequestration is a crucial factor influencing market growth. Technological innovations focusing on enhancing biochar quality and reducing production costs will continue to shape the industry's trajectory. Future growth will also depend on overcoming existing challenges, including standardized quality control measures and the development of more efficient and scalable production technologies. The diverse applications of biochar across various sectors, including environmental remediation, further contribute to its long-term market prospects. This signifies a considerable opportunity for both established and emerging companies within this rapidly growing market.
Biochar Industry Company Market Share
Biochar Industry Market Report: 2019-2033
This comprehensive report provides an in-depth analysis of the biochar industry, encompassing market dynamics, growth trends, key players, and future outlook. With a study period spanning 2019-2033, a base year of 2025, and a forecast period of 2025-2033, this report is an essential resource for industry professionals, investors, and researchers seeking to understand and capitalize on the burgeoning biochar market. The report segments the market by technology (Pyrolysis, Gasification Systems, Other Technologies (Hydrothermal Carbonization)) and application (Agriculture, Animal Farming, Industrial Uses, Other Applications (Environmental Remediation)). The global biochar market size is projected to reach xx Million by 2033.
Biochar Industry Market Dynamics & Structure
The biochar market presents a moderately fragmented structure, characterized by a dynamic interplay of established players and a multitude of smaller firms. Ongoing industry consolidation is anticipated, with larger companies strategically acquiring smaller entities to enhance market share and technological capabilities. This consolidation trend is a significant factor shaping the market landscape. A key catalyst for market growth is technological innovation, primarily driven by advancements in pyrolysis and gasification technologies, which are continually improving efficiency and reducing production costs. Stringent environmental regulations emphasizing carbon emission reduction and the promotion of sustainable land management practices are further fueling demand for biochar. While alternative soil amendments exist, biochar's unique properties, especially its superior carbon sequestration capabilities, provide a substantial competitive advantage. The end-user base is diverse, encompassing agricultural producers seeking enhanced soil health, industrial users exploring novel applications, and environmental remediation firms focused on sustainable solutions.
- Market Concentration: Currently moderately fragmented, with a clear trend toward increased consolidation driven by mergers and acquisitions.
- Technological Innovation: A primary growth driver, particularly advancements in pyrolysis and gasification efficiency, leading to cost reductions and improved product quality.
- Regulatory Framework: A supportive regulatory environment, with increasing emphasis on sustainable solutions and carbon sequestration, is bolstering market growth.
- Competitive Landscape: Biochar's unique properties, particularly its carbon sequestration and soil amendment capabilities, offer a significant competitive advantage over alternative solutions.
- Mergers & Acquisitions (M&A): Significant M&A activity is reshaping the market, with larger firms acquiring smaller players to expand their market reach and technological expertise. (Specific data on M&A deals between 2019-2024 could be inserted here).
Biochar Industry Growth Trends & Insights
The biochar market experienced significant growth during the historical period (2019-2024), driven by increasing awareness of its environmental benefits and expanding applications in agriculture and other sectors. The Compound Annual Growth Rate (CAGR) during this period was approximately xx%, and market penetration in key applications is steadily rising. Technological disruptions, such as improved pyrolysis technologies leading to higher yields and lower production costs, are further accelerating market expansion. Consumer behavior shifts towards sustainable and environmentally friendly products are also underpinning market growth. The forecast period (2025-2033) anticipates continued expansion, with a projected CAGR of xx%, driven by factors mentioned above and increasing government support and investment in carbon sequestration technologies.
Dominant Regions, Countries, or Segments in Biochar Industry
The agricultural sector currently holds the dominant position in the biochar market, driven by its proven ability to significantly improve soil health, boost crop yields, and enhance carbon sequestration. Within the technology segment, pyrolysis retains the largest market share due to its established technological maturity, cost-effectiveness, and high yield potential. North America and Europe are currently the leading regions for biochar adoption, benefiting from robust regulatory support and a high level of environmental consciousness. However, the Asia-Pacific region is poised for the most substantial growth in the foreseeable future, fueled by a rapidly expanding agricultural sector and a growing number of government initiatives promoting sustainable agricultural practices. This rapid growth is expected to significantly alter the global market share distribution in the coming years.
- Key Drivers (Agriculture Segment): Enhanced soil health, increased crop yields, and effective carbon sequestration are key factors driving adoption within the agriculture sector.
- Key Drivers (Pyrolysis Technology): Established technology, cost-effectiveness, and high yield potential contribute to pyrolysis's market dominance.
- Regional Market Dynamics: While North America and Europe currently lead, the Asia-Pacific region shows the highest projected growth rate.
- Market Share (Agriculture): (Insert projected market share data for 2025 here)
- Market Share (Pyrolysis): (Insert projected market share data for 2025 here)
Biochar Industry Product Landscape
Biochar product innovation focuses on enhancing its efficacy in diverse applications. This includes developing biochar with specific surface area and porosity tailored to target applications. Technological advancements have led to increased production efficiency and cost reduction, making biochar more accessible. Unique selling propositions often revolve around improved soil amendment properties, such as enhanced water retention and nutrient availability, along with carbon sequestration capacity.
Key Drivers, Barriers & Challenges in Biochar Industry
Key Drivers: The escalating awareness of climate change and the urgent need for effective carbon sequestration solutions are major drivers. The growing demand for sustainable agricultural practices, supportive government policies and incentives, and ongoing technological advancements leading to improved efficiency and reduced costs are further propelling market growth.
Key Challenges: High initial capital investment required for establishing biochar production facilities poses a significant barrier to entry. Inconsistencies in biochar quality and standardization remain a challenge. Limited availability of suitable feedstock in certain regions presents a geographical constraint. Potential environmental concerns related to feedstock sourcing and emissions from the production process necessitate careful management and mitigation strategies. These challenges collectively impact market growth, with a potential reduction of approximately (insert percentage) by 2033. Addressing these challenges through technological innovation, sustainable sourcing, and improved standardization will be crucial for realizing the full market potential of biochar.
Emerging Opportunities in Biochar Industry
Emerging opportunities include expanding into new applications, such as water treatment and bioremediation; development of novel biochar-based products, such as biochar composites and activated carbon; exploring biochar's potential in carbon capture and storage initiatives; focusing on the development of sustainable feedstock sourcing strategies.
Growth Accelerators in the Biochar Industry
Technological breakthroughs, particularly in advanced pyrolysis and gasification systems, are crucial for reducing production costs and improving biochar quality. Strategic partnerships between biochar producers, agricultural companies, and carbon credit markets can accelerate adoption. Expansion into new geographical markets, particularly in developing countries with substantial agricultural sectors, presents significant opportunities.
Key Players Shaping the Biochar Industry Market
- Arsta Eco
- Biochar Industries
- Diacarbon Energy Inc
- Biochar Now LLC
- Swiss Biochar
- PyroCore
- Sunriver Biochar
- Airex Energy
- Phoenix Energy
- Karr Group
- Wonjin Group
- Carbon Gold Ltd
- Biochar Supreme
- BIOSORRA
- Pyreg GmbH
Notable Milestones in Biochar Industry Sector
- November 2023: BIOSORRA launched a biochar production plant in Kenya, supplying the Kenya Nut Company, marking a significant expansion into the African market.
- November 2023: Pyreg GmbH launched Biochar Carbon Removal (BCR), accelerating the adoption of biochar within the agriculture sector and highlighting a growing focus on carbon sequestration.
- June 2022: Airex Energy joined the BDO Zone Strategic Alliance, facilitating de-risking of biobased project development and showcasing the increasing collaboration within the industry.
In-Depth Biochar Industry Market Outlook
The biochar industry is poised for substantial growth in the coming years, fueled by increasing environmental concerns, technological advancements, and supportive government policies. Strategic opportunities lie in developing innovative applications, expanding into new markets, and fostering collaborations across the value chain. The market's future potential is significant, promising a substantial contribution to carbon sequestration efforts and sustainable development globally.
Biochar Industry Segmentation
-
1. Technology
- 1.1. Pyrolysis
- 1.2. Gasification Systems
- 1.3. Other Technologies (Hydrothermal Carbonization)
-
2. Application
- 2.1. Agriculture
- 2.2. Animal Farming
- 2.3. Industrial Uses
- 2.4. Other Applications (Environmental Remediation)
Biochar Industry Segmentation By Geography
-
1. Asia Pacific
- 1.1. China
- 1.2. Australia
- 1.3. South Korea
- 1.4. Rest of Asia Pacific
-
2. North America
- 2.1. United States
- 2.2. Canada
-
3. Europe
- 3.1. Germany
- 3.2. Sweden
- 3.3. Austria
- 3.4. Switzerland
- 3.5. United Kingdom
- 3.6. Rest of Europe
- 4. Rest of the World
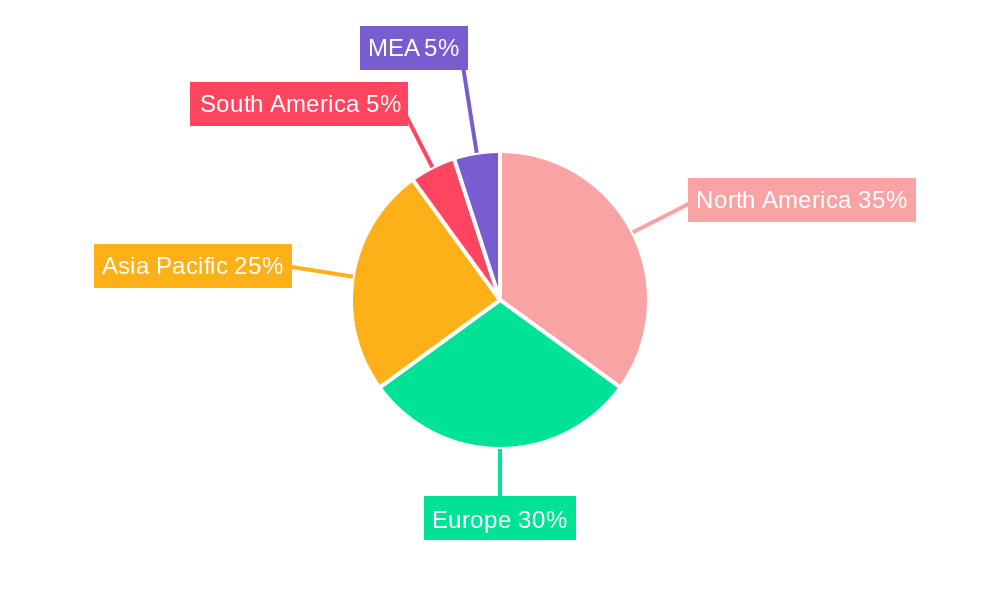
Biochar Industry Regional Market Share
Geographic Coverage of Biochar Industry
Biochar Industry REPORT HIGHLIGHTS
| Aspects | Details |
|---|---|
| Study Period | 2020-2034 |
| Base Year | 2025 |
| Estimated Year | 2026 |
| Forecast Period | 2026-2034 |
| Historical Period | 2020-2025 |
| Growth Rate | CAGR of > 24.50% from 2020-2034 |
| Segmentation |
|
Table of Contents
- 1. Introduction
- 1.1. Research Scope
- 1.2. Market Segmentation
- 1.3. Research Objective
- 1.4. Definitions and Assumptions
- 2. Executive Summary
- 2.1. Market Snapshot
- 3. Market Dynamics
- 3.1. Market Drivers
- 3.2. Market Restrains
- 3.3. Market Trends
- 3.4. Market Opportunities
- 4. Market Factor Analysis
- 4.1. Porters Five Forces
- 4.1.1. Bargaining Power of Suppliers
- 4.1.2. Bargaining Power of Buyers
- 4.1.3. Threat of New Entrants
- 4.1.4. Threat of Substitutes
- 4.1.5. Competitive Rivalry
- 4.2. PESTEL analysis
- 4.3. BCG Analysis
- 4.3.1. Stars (High Growth, High Market Share)
- 4.3.2. Cash Cows (Low Growth, High Market Share)
- 4.3.3. Question Mark (High Growth, Low Market Share)
- 4.3.4. Dogs (Low Growth, Low Market Share)
- 4.4. Ansoff Matrix Analysis
- 4.5. Supply Chain Analysis
- 4.6. Regulatory Landscape
- 4.7. Current Market Potential and Opportunity Assessment (TAM–SAM–SOM Framework)
- 4.8. IMR Analyst Note
- 4.1. Porters Five Forces
- 5. Market Analysis, Insights and Forecast 2021-2033
- 5.1. Market Analysis, Insights and Forecast - by Technology
- 5.1.1. Pyrolysis
- 5.1.2. Gasification Systems
- 5.1.3. Other Technologies (Hydrothermal Carbonization)
- 5.2. Market Analysis, Insights and Forecast - by Application
- 5.2.1. Agriculture
- 5.2.2. Animal Farming
- 5.2.3. Industrial Uses
- 5.2.4. Other Applications (Environmental Remediation)
- 5.3. Market Analysis, Insights and Forecast - by Region
- 5.3.1. Asia Pacific
- 5.3.2. North America
- 5.3.3. Europe
- 5.3.4. Rest of the World
- 5.1. Market Analysis, Insights and Forecast - by Technology
- 6. Global Biochar Industry Analysis, Insights and Forecast, 2021-2033
- 6.1. Market Analysis, Insights and Forecast - by Technology
- 6.1.1. Pyrolysis
- 6.1.2. Gasification Systems
- 6.1.3. Other Technologies (Hydrothermal Carbonization)
- 6.2. Market Analysis, Insights and Forecast - by Application
- 6.2.1. Agriculture
- 6.2.2. Animal Farming
- 6.2.3. Industrial Uses
- 6.2.4. Other Applications (Environmental Remediation)
- 6.1. Market Analysis, Insights and Forecast - by Technology
- 7. Asia Pacific Biochar Industry Analysis, Insights and Forecast, 2020-2032
- 7.1. Market Analysis, Insights and Forecast - by Technology
- 7.1.1. Pyrolysis
- 7.1.2. Gasification Systems
- 7.1.3. Other Technologies (Hydrothermal Carbonization)
- 7.2. Market Analysis, Insights and Forecast - by Application
- 7.2.1. Agriculture
- 7.2.2. Animal Farming
- 7.2.3. Industrial Uses
- 7.2.4. Other Applications (Environmental Remediation)
- 7.1. Market Analysis, Insights and Forecast - by Technology
- 8. North America Biochar Industry Analysis, Insights and Forecast, 2020-2032
- 8.1. Market Analysis, Insights and Forecast - by Technology
- 8.1.1. Pyrolysis
- 8.1.2. Gasification Systems
- 8.1.3. Other Technologies (Hydrothermal Carbonization)
- 8.2. Market Analysis, Insights and Forecast - by Application
- 8.2.1. Agriculture
- 8.2.2. Animal Farming
- 8.2.3. Industrial Uses
- 8.2.4. Other Applications (Environmental Remediation)
- 8.1. Market Analysis, Insights and Forecast - by Technology
- 9. Europe Biochar Industry Analysis, Insights and Forecast, 2020-2032
- 9.1. Market Analysis, Insights and Forecast - by Technology
- 9.1.1. Pyrolysis
- 9.1.2. Gasification Systems
- 9.1.3. Other Technologies (Hydrothermal Carbonization)
- 9.2. Market Analysis, Insights and Forecast - by Application
- 9.2.1. Agriculture
- 9.2.2. Animal Farming
- 9.2.3. Industrial Uses
- 9.2.4. Other Applications (Environmental Remediation)
- 9.1. Market Analysis, Insights and Forecast - by Technology
- 10. Rest of the World Biochar Industry Analysis, Insights and Forecast, 2020-2032
- 10.1. Market Analysis, Insights and Forecast - by Technology
- 10.1.1. Pyrolysis
- 10.1.2. Gasification Systems
- 10.1.3. Other Technologies (Hydrothermal Carbonization)
- 10.2. Market Analysis, Insights and Forecast - by Application
- 10.2.1. Agriculture
- 10.2.2. Animal Farming
- 10.2.3. Industrial Uses
- 10.2.4. Other Applications (Environmental Remediation)
- 10.1. Market Analysis, Insights and Forecast - by Technology
- 11. Competitive Analysis
- 11.1. Company Profiles
- 11.1.1 Arsta Eco
- 11.1.1.1. Company Overview
- 11.1.1.2. Products
- 11.1.1.3. Company Financials
- 11.1.1.4. SWOT Analysis
- 11.1.2 Biochar Industries
- 11.1.2.1. Company Overview
- 11.1.2.2. Products
- 11.1.2.3. Company Financials
- 11.1.2.4. SWOT Analysis
- 11.1.3 Diacarbon Energy Inc
- 11.1.3.1. Company Overview
- 11.1.3.2. Products
- 11.1.3.3. Company Financials
- 11.1.3.4. SWOT Analysis
- 11.1.4 Biochar Now LLC
- 11.1.4.1. Company Overview
- 11.1.4.2. Products
- 11.1.4.3. Company Financials
- 11.1.4.4. SWOT Analysis
- 11.1.5 Swiss Biochar
- 11.1.5.1. Company Overview
- 11.1.5.2. Products
- 11.1.5.3. Company Financials
- 11.1.5.4. SWOT Analysis
- 11.1.6 PyroCore
- 11.1.6.1. Company Overview
- 11.1.6.2. Products
- 11.1.6.3. Company Financials
- 11.1.6.4. SWOT Analysis
- 11.1.7 Sunriver Biochar
- 11.1.7.1. Company Overview
- 11.1.7.2. Products
- 11.1.7.3. Company Financials
- 11.1.7.4. SWOT Analysis
- 11.1.8 Airex Energy
- 11.1.8.1. Company Overview
- 11.1.8.2. Products
- 11.1.8.3. Company Financials
- 11.1.8.4. SWOT Analysis
- 11.1.9 Phoenix Energy
- 11.1.9.1. Company Overview
- 11.1.9.2. Products
- 11.1.9.3. Company Financials
- 11.1.9.4. SWOT Analysis
- 11.1.10 Karr Group
- 11.1.10.1. Company Overview
- 11.1.10.2. Products
- 11.1.10.3. Company Financials
- 11.1.10.4. SWOT Analysis
- 11.1.11 Wonjin Group*List Not Exhaustive
- 11.1.11.1. Company Overview
- 11.1.11.2. Products
- 11.1.11.3. Company Financials
- 11.1.11.4. SWOT Analysis
- 11.1.12 Carbon Gold Ltd
- 11.1.12.1. Company Overview
- 11.1.12.2. Products
- 11.1.12.3. Company Financials
- 11.1.12.4. SWOT Analysis
- 11.1.13 Biochar Supreme
- 11.1.13.1. Company Overview
- 11.1.13.2. Products
- 11.1.13.3. Company Financials
- 11.1.13.4. SWOT Analysis
- 11.1.14 BIOSORRA
- 11.1.14.1. Company Overview
- 11.1.14.2. Products
- 11.1.14.3. Company Financials
- 11.1.14.4. SWOT Analysis
- 11.1.15 Pyreg GmbH
- 11.1.15.1. Company Overview
- 11.1.15.2. Products
- 11.1.15.3. Company Financials
- 11.1.15.4. SWOT Analysis
- 11.1.1 Arsta Eco
- 11.2. Market Entropy
- 11.2.1 Company's Key Areas Served
- 11.2.2 Recent Developments
- 11.3. Company Market Share Analysis 2025
- 11.3.1 Top 5 Companies Market Share Analysis
- 11.3.2 Top 3 Companies Market Share Analysis
- 11.4. List of Potential Customers
- 12. Research Methodology
List of Figures
- Figure 1: Global Biochar Industry Revenue Breakdown (Million, %) by Region 2025 & 2033
- Figure 2: Global Biochar Industry Volume Breakdown (K Tons, %) by Region 2025 & 2033
- Figure 3: Asia Pacific Biochar Industry Revenue (Million), by Technology 2025 & 2033
- Figure 4: Asia Pacific Biochar Industry Volume (K Tons), by Technology 2025 & 2033
- Figure 5: Asia Pacific Biochar Industry Revenue Share (%), by Technology 2025 & 2033
- Figure 6: Asia Pacific Biochar Industry Volume Share (%), by Technology 2025 & 2033
- Figure 7: Asia Pacific Biochar Industry Revenue (Million), by Application 2025 & 2033
- Figure 8: Asia Pacific Biochar Industry Volume (K Tons), by Application 2025 & 2033
- Figure 9: Asia Pacific Biochar Industry Revenue Share (%), by Application 2025 & 2033
- Figure 10: Asia Pacific Biochar Industry Volume Share (%), by Application 2025 & 2033
- Figure 11: Asia Pacific Biochar Industry Revenue (Million), by Country 2025 & 2033
- Figure 12: Asia Pacific Biochar Industry Volume (K Tons), by Country 2025 & 2033
- Figure 13: Asia Pacific Biochar Industry Revenue Share (%), by Country 2025 & 2033
- Figure 14: Asia Pacific Biochar Industry Volume Share (%), by Country 2025 & 2033
- Figure 15: North America Biochar Industry Revenue (Million), by Technology 2025 & 2033
- Figure 16: North America Biochar Industry Volume (K Tons), by Technology 2025 & 2033
- Figure 17: North America Biochar Industry Revenue Share (%), by Technology 2025 & 2033
- Figure 18: North America Biochar Industry Volume Share (%), by Technology 2025 & 2033
- Figure 19: North America Biochar Industry Revenue (Million), by Application 2025 & 2033
- Figure 20: North America Biochar Industry Volume (K Tons), by Application 2025 & 2033
- Figure 21: North America Biochar Industry Revenue Share (%), by Application 2025 & 2033
- Figure 22: North America Biochar Industry Volume Share (%), by Application 2025 & 2033
- Figure 23: North America Biochar Industry Revenue (Million), by Country 2025 & 2033
- Figure 24: North America Biochar Industry Volume (K Tons), by Country 2025 & 2033
- Figure 25: North America Biochar Industry Revenue Share (%), by Country 2025 & 2033
- Figure 26: North America Biochar Industry Volume Share (%), by Country 2025 & 2033
- Figure 27: Europe Biochar Industry Revenue (Million), by Technology 2025 & 2033
- Figure 28: Europe Biochar Industry Volume (K Tons), by Technology 2025 & 2033
- Figure 29: Europe Biochar Industry Revenue Share (%), by Technology 2025 & 2033
- Figure 30: Europe Biochar Industry Volume Share (%), by Technology 2025 & 2033
- Figure 31: Europe Biochar Industry Revenue (Million), by Application 2025 & 2033
- Figure 32: Europe Biochar Industry Volume (K Tons), by Application 2025 & 2033
- Figure 33: Europe Biochar Industry Revenue Share (%), by Application 2025 & 2033
- Figure 34: Europe Biochar Industry Volume Share (%), by Application 2025 & 2033
- Figure 35: Europe Biochar Industry Revenue (Million), by Country 2025 & 2033
- Figure 36: Europe Biochar Industry Volume (K Tons), by Country 2025 & 2033
- Figure 37: Europe Biochar Industry Revenue Share (%), by Country 2025 & 2033
- Figure 38: Europe Biochar Industry Volume Share (%), by Country 2025 & 2033
- Figure 39: Rest of the World Biochar Industry Revenue (Million), by Technology 2025 & 2033
- Figure 40: Rest of the World Biochar Industry Volume (K Tons), by Technology 2025 & 2033
- Figure 41: Rest of the World Biochar Industry Revenue Share (%), by Technology 2025 & 2033
- Figure 42: Rest of the World Biochar Industry Volume Share (%), by Technology 2025 & 2033
- Figure 43: Rest of the World Biochar Industry Revenue (Million), by Application 2025 & 2033
- Figure 44: Rest of the World Biochar Industry Volume (K Tons), by Application 2025 & 2033
- Figure 45: Rest of the World Biochar Industry Revenue Share (%), by Application 2025 & 2033
- Figure 46: Rest of the World Biochar Industry Volume Share (%), by Application 2025 & 2033
- Figure 47: Rest of the World Biochar Industry Revenue (Million), by Country 2025 & 2033
- Figure 48: Rest of the World Biochar Industry Volume (K Tons), by Country 2025 & 2033
- Figure 49: Rest of the World Biochar Industry Revenue Share (%), by Country 2025 & 2033
- Figure 50: Rest of the World Biochar Industry Volume Share (%), by Country 2025 & 2033
List of Tables
- Table 1: Global Biochar Industry Revenue Million Forecast, by Technology 2020 & 2033
- Table 2: Global Biochar Industry Volume K Tons Forecast, by Technology 2020 & 2033
- Table 3: Global Biochar Industry Revenue Million Forecast, by Application 2020 & 2033
- Table 4: Global Biochar Industry Volume K Tons Forecast, by Application 2020 & 2033
- Table 5: Global Biochar Industry Revenue Million Forecast, by Region 2020 & 2033
- Table 6: Global Biochar Industry Volume K Tons Forecast, by Region 2020 & 2033
- Table 7: Global Biochar Industry Revenue Million Forecast, by Technology 2020 & 2033
- Table 8: Global Biochar Industry Volume K Tons Forecast, by Technology 2020 & 2033
- Table 9: Global Biochar Industry Revenue Million Forecast, by Application 2020 & 2033
- Table 10: Global Biochar Industry Volume K Tons Forecast, by Application 2020 & 2033
- Table 11: Global Biochar Industry Revenue Million Forecast, by Country 2020 & 2033
- Table 12: Global Biochar Industry Volume K Tons Forecast, by Country 2020 & 2033
- Table 13: China Biochar Industry Revenue (Million) Forecast, by Application 2020 & 2033
- Table 14: China Biochar Industry Volume (K Tons) Forecast, by Application 2020 & 2033
- Table 15: Australia Biochar Industry Revenue (Million) Forecast, by Application 2020 & 2033
- Table 16: Australia Biochar Industry Volume (K Tons) Forecast, by Application 2020 & 2033
- Table 17: South Korea Biochar Industry Revenue (Million) Forecast, by Application 2020 & 2033
- Table 18: South Korea Biochar Industry Volume (K Tons) Forecast, by Application 2020 & 2033
- Table 19: Rest of Asia Pacific Biochar Industry Revenue (Million) Forecast, by Application 2020 & 2033
- Table 20: Rest of Asia Pacific Biochar Industry Volume (K Tons) Forecast, by Application 2020 & 2033
- Table 21: Global Biochar Industry Revenue Million Forecast, by Technology 2020 & 2033
- Table 22: Global Biochar Industry Volume K Tons Forecast, by Technology 2020 & 2033
- Table 23: Global Biochar Industry Revenue Million Forecast, by Application 2020 & 2033
- Table 24: Global Biochar Industry Volume K Tons Forecast, by Application 2020 & 2033
- Table 25: Global Biochar Industry Revenue Million Forecast, by Country 2020 & 2033
- Table 26: Global Biochar Industry Volume K Tons Forecast, by Country 2020 & 2033
- Table 27: United States Biochar Industry Revenue (Million) Forecast, by Application 2020 & 2033
- Table 28: United States Biochar Industry Volume (K Tons) Forecast, by Application 2020 & 2033
- Table 29: Canada Biochar Industry Revenue (Million) Forecast, by Application 2020 & 2033
- Table 30: Canada Biochar Industry Volume (K Tons) Forecast, by Application 2020 & 2033
- Table 31: Global Biochar Industry Revenue Million Forecast, by Technology 2020 & 2033
- Table 32: Global Biochar Industry Volume K Tons Forecast, by Technology 2020 & 2033
- Table 33: Global Biochar Industry Revenue Million Forecast, by Application 2020 & 2033
- Table 34: Global Biochar Industry Volume K Tons Forecast, by Application 2020 & 2033
- Table 35: Global Biochar Industry Revenue Million Forecast, by Country 2020 & 2033
- Table 36: Global Biochar Industry Volume K Tons Forecast, by Country 2020 & 2033
- Table 37: Germany Biochar Industry Revenue (Million) Forecast, by Application 2020 & 2033
- Table 38: Germany Biochar Industry Volume (K Tons) Forecast, by Application 2020 & 2033
- Table 39: Sweden Biochar Industry Revenue (Million) Forecast, by Application 2020 & 2033
- Table 40: Sweden Biochar Industry Volume (K Tons) Forecast, by Application 2020 & 2033
- Table 41: Austria Biochar Industry Revenue (Million) Forecast, by Application 2020 & 2033
- Table 42: Austria Biochar Industry Volume (K Tons) Forecast, by Application 2020 & 2033
- Table 43: Switzerland Biochar Industry Revenue (Million) Forecast, by Application 2020 & 2033
- Table 44: Switzerland Biochar Industry Volume (K Tons) Forecast, by Application 2020 & 2033
- Table 45: United Kingdom Biochar Industry Revenue (Million) Forecast, by Application 2020 & 2033
- Table 46: United Kingdom Biochar Industry Volume (K Tons) Forecast, by Application 2020 & 2033
- Table 47: Rest of Europe Biochar Industry Revenue (Million) Forecast, by Application 2020 & 2033
- Table 48: Rest of Europe Biochar Industry Volume (K Tons) Forecast, by Application 2020 & 2033
- Table 49: Global Biochar Industry Revenue Million Forecast, by Technology 2020 & 2033
- Table 50: Global Biochar Industry Volume K Tons Forecast, by Technology 2020 & 2033
- Table 51: Global Biochar Industry Revenue Million Forecast, by Application 2020 & 2033
- Table 52: Global Biochar Industry Volume K Tons Forecast, by Application 2020 & 2033
- Table 53: Global Biochar Industry Revenue Million Forecast, by Country 2020 & 2033
- Table 54: Global Biochar Industry Volume K Tons Forecast, by Country 2020 & 2033
Frequently Asked Questions
1. What is the projected Compound Annual Growth Rate (CAGR) of the Biochar Industry?
The projected CAGR is approximately > 24.50%.
2. Which companies are prominent players in the Biochar Industry?
Key companies in the market include Arsta Eco, Biochar Industries, Diacarbon Energy Inc, Biochar Now LLC, Swiss Biochar, PyroCore, Sunriver Biochar, Airex Energy, Phoenix Energy, Karr Group, Wonjin Group*List Not Exhaustive, Carbon Gold Ltd, Biochar Supreme, BIOSORRA, Pyreg GmbH.
3. What are the main segments of the Biochar Industry?
The market segments include Technology, Application.
4. Can you provide details about the market size?
The market size is estimated to be USD 541.8 Million as of 2022.
5. What are some drivers contributing to market growth?
Increasing Applications for Plant Growth and Development; Growing Demand for Organic Foods in Developing Countries.
6. What are the notable trends driving market growth?
Agriculture Segment to Dominate the Market.
7. Are there any restraints impacting market growth?
High Production Costs; Competition from Alternative Products.
8. Can you provide examples of recent developments in the market?
November 2023: BIOSORRA launched a production plant for biochar in East Africa at Thika in Kiambu County, Kenya. This biochar would be provided to Kenya Nut Company, a multinational agribusiness company involved in growing a wide range of products.
9. What pricing options are available for accessing the report?
Pricing options include single-user, multi-user, and enterprise licenses priced at USD 4750, USD 5250, and USD 8750 respectively.
10. Is the market size provided in terms of value or volume?
The market size is provided in terms of value, measured in Million and volume, measured in K Tons.
11. Are there any specific market keywords associated with the report?
Yes, the market keyword associated with the report is "Biochar Industry," which aids in identifying and referencing the specific market segment covered.
12. How do I determine which pricing option suits my needs best?
The pricing options vary based on user requirements and access needs. Individual users may opt for single-user licenses, while businesses requiring broader access may choose multi-user or enterprise licenses for cost-effective access to the report.
13. Are there any additional resources or data provided in the Biochar Industry report?
While the report offers comprehensive insights, it's advisable to review the specific contents or supplementary materials provided to ascertain if additional resources or data are available.
14. How can I stay updated on further developments or reports in the Biochar Industry?
To stay informed about further developments, trends, and reports in the Biochar Industry, consider subscribing to industry newsletters, following relevant companies and organizations, or regularly checking reputable industry news sources and publications.
Methodology
Step 1 - Identification of Relevant Samples Size from Population Database


Step 2 - Approaches for Defining Global Market Size (Value, Volume* & Price*)

Note*: In applicable scenarios
Step 3 - Data Sources
Primary Research
- Web Analytics
- Survey Reports
- Research Institute
- Latest Research Reports
- Opinion Leaders
Secondary Research
- Annual Reports
- White Paper
- Latest Press Release
- Industry Association
- Paid Database
- Investor Presentations

Step 4 - Data Triangulation
Involves using different sources of information in order to increase the validity of a study
These sources are likely to be stakeholders in a program - participants, other researchers, program staff, other community members, and so on.
Then we put all data in single framework & apply various statistical tools to find out the dynamic on the market.
During the analysis stage, feedback from the stakeholder groups would be compared to determine areas of agreement as well as areas of divergence