

Key Insights
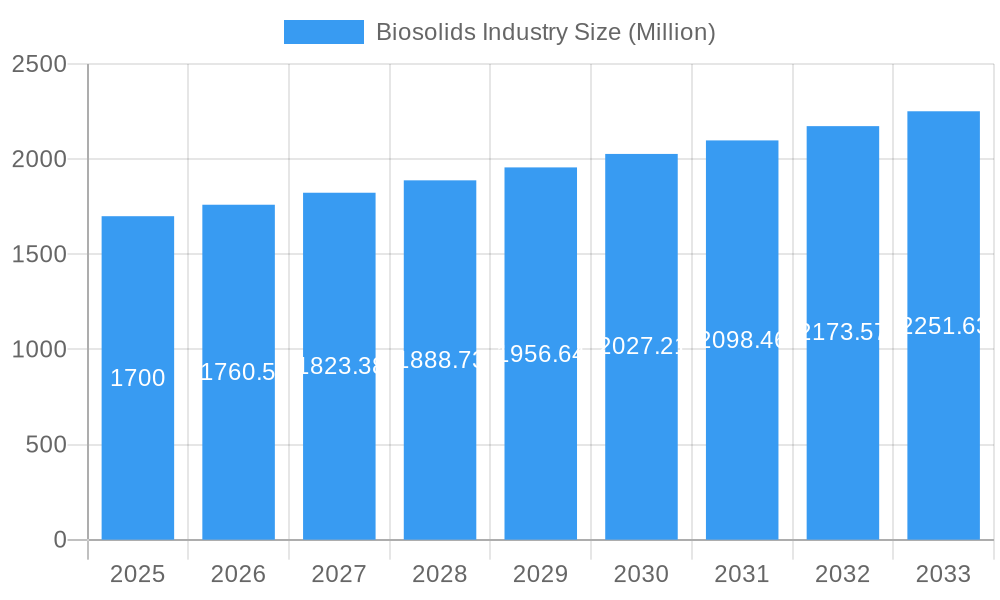
The global biosolids market, currently valued at approximately $1.7 billion (2025), exhibits a robust growth trajectory, projected to expand at a Compound Annual Growth Rate (CAGR) exceeding 3.5% from 2025 to 2033. This growth is fueled by several key drivers. Increasing environmental regulations mandating sustainable waste management practices are pushing municipalities and industries to explore cost-effective and environmentally sound biosolids utilization methods. Furthermore, the rising demand for sustainable fertilizers in agriculture, particularly for crop production and pastureland, is significantly boosting the market. The increasing adoption of innovative technologies for biosolids processing and application, such as pellet production for ease of handling and transport, further contributes to market expansion. Specific applications like energy recovery through anaerobic digestion and the use of Class A and Class A EQ biosolids are gaining traction, contributing to market segmentation and growth within specific niches. Geographic expansion, particularly in rapidly developing economies of Asia-Pacific and South America, presents significant opportunities for market players.
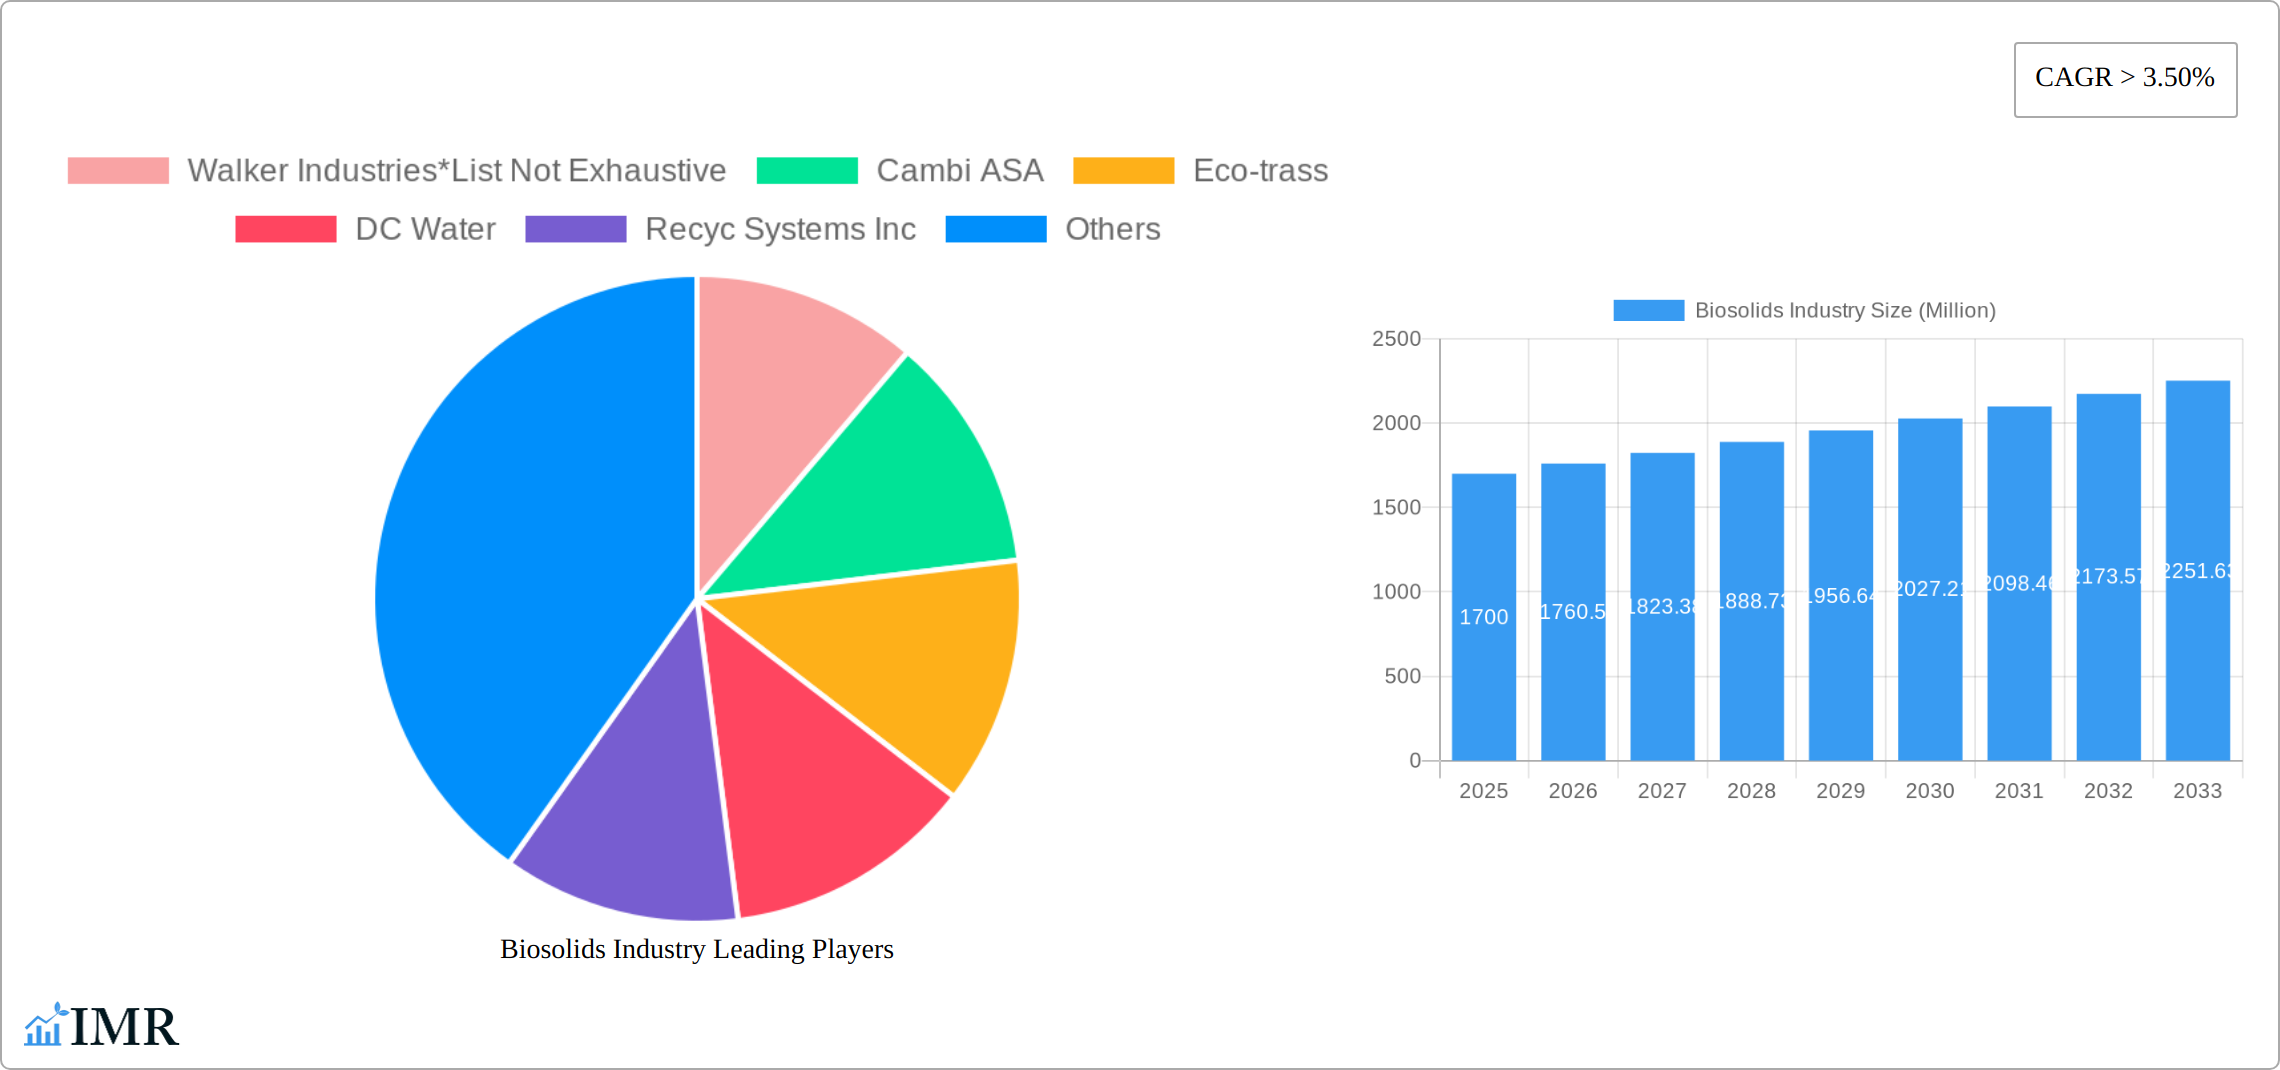
Biosolids Industry Market Size (In Billion)
However, several challenges restrain market growth. The high upfront capital investment required for biosolids treatment facilities can be a deterrent for smaller municipalities and companies. Public perception and concerns regarding the safety and efficacy of biosolids as fertilizers can also hinder wider adoption. Furthermore, inconsistent regulatory frameworks across different regions can create challenges for standardized implementation and market penetration. Despite these limitations, the long-term outlook for the biosolids market remains positive, driven by the increasing need for sustainable waste management solutions and the growing demand for environmentally friendly agricultural inputs. The market is expected to see continued innovation in processing technologies, improved public awareness, and a move towards more stringent environmental regulations which will all contribute to the market's expansion in the coming years.
Biosolids Industry Company Market Share
Biosolids Industry Market Report: 2019-2033
This comprehensive report provides an in-depth analysis of the biosolids industry, encompassing market dynamics, growth trends, regional dominance, product landscape, and key players. Covering the period from 2019 to 2033 (with a base year of 2025 and forecast period 2025-2033), this report is an essential resource for industry professionals, investors, and researchers seeking to understand and capitalize on opportunities within this evolving sector. The report analyzes parent markets (wastewater treatment, agriculture) and child markets (biosolids processing, application technologies), offering granular insights into market segments categorized by form (cakes, liquid, pellet), application (agricultural land application, fertilizer, non-agricultural land application, energy recovery), and type (Class A, Class A EQ, Class B). The market value in 2025 is estimated at xx Million.
Biosolids Industry Market Dynamics & Structure
The biosolids industry presents a moderately fragmented market structure, characterized by a few large multinational corporations and numerous smaller, regional operators. Market share distribution is significantly influenced by geographical location, prevailing regulatory environments, and the technological capabilities of individual players. The industry is experiencing robust growth fueled by technological innovation, particularly advancements in treatment processes such as thermal hydrolysis and anaerobic digestion, leading to higher-quality and more marketable biosolids. Stringent environmental regulations governing biosolids handling, processing, and disposal are continuously reshaping industry best practices and influencing investment strategies. While competitive substitutes like chemical fertilizers exist, biosolids are increasingly favored due to their inherent sustainability advantages and often lower long-term costs. The primary end-users remain agricultural entities and municipalities, both exhibiting a growing preference for sustainable and cost-effective solutions. Mergers and acquisitions (M&A) activity from 2019-2024 was moderate, with [Insert Precise Number] deals totaling approximately [Insert Precise Dollar Amount] Million. The forecast period (2025-2033) anticipates a surge in M&A activity driven by expansion strategies and a consolidation of technological expertise within the industry.
- Market Concentration: Moderately fragmented, with larger players commanding an estimated [Insert Precise Percentage]% of the market in 2025. This concentration is expected to [Increase/Decrease/Remain relatively stable] in the coming years.
- Technological Innovation: Key drivers include advancements in thermal hydrolysis, anaerobic digestion, and other emerging technologies focused on optimizing biosolids quality and reducing environmental impact. Barriers to innovation include high capital expenditures for new equipment and navigating complex regulatory approvals.
- Regulatory Framework: Stringent environmental regulations are crucial drivers of innovation, fostering the development of cleaner and more sustainable biosolids processing technologies. Compliance with these regulations presents both challenges and opportunities for market participants.
- Competitive Substitutes: Chemical fertilizers represent a significant competitive threat; however, biosolids offer compelling sustainability advantages, including carbon sequestration and reduced reliance on finite fossil fuel resources. This eco-conscious positioning is increasingly appealing to environmentally aware consumers.
- End-User Demographics: The primary end-users are agricultural operations (including large-scale farms and smaller producers) and municipalities seeking cost-effective and sustainable solutions for managing wastewater byproducts.
- M&A Trends: [Insert Precise Number] deals valued at approximately [Insert Precise Dollar Amount] Million were recorded between 2019-2024. Increased M&A activity is projected for 2025-2033, driven by companies seeking to expand their market reach and consolidate technological advancements.
Biosolids Industry Growth Trends & Insights
The global biosolids market exhibited robust growth from 2019 to 2024, expanding at a Compound Annual Growth Rate (CAGR) of [Insert Precise Percentage]%. This impressive growth trajectory is largely attributable to the rising awareness of sustainable waste management practices and the increasing demand for environmentally friendly fertilizers in the agricultural sector. Technological advancements, especially in thermal hydrolysis and anaerobic digestion, have significantly improved the quality and marketability of biosolids, boosting adoption rates across diverse applications. Shifting consumer preferences towards eco-responsible products and services are further accelerating market expansion. This positive momentum is expected to continue throughout the forecast period (2025-2033), propelled by factors such as rapid urbanization, stricter environmental regulations globally, and the escalating need to support rising agricultural output. Market penetration is projected to reach [Insert Precise Percentage]% by 2033, indicating substantial untapped market potential.
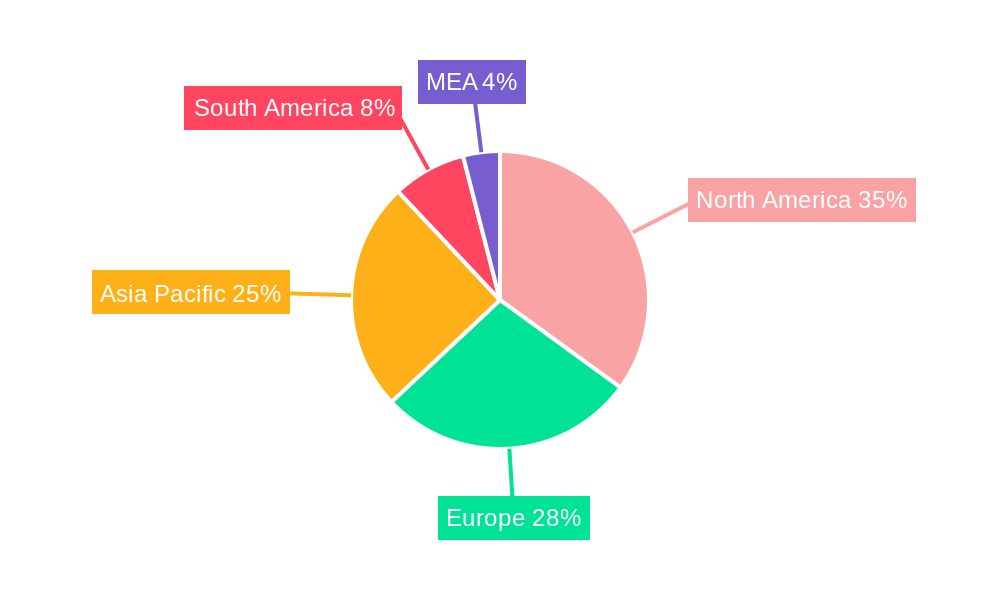
Dominant Regions, Countries, or Segments in Biosolids Industry
North America and Europe currently dominate the global biosolids market, driven by robust wastewater treatment infrastructure, stringent environmental regulations, and substantial agricultural sectors. Within these regions, specific countries like the US, Canada, Germany, and the UK exhibit higher market share and growth rates due to supportive government policies, technological advancements, and high biosolids generation rates. Among various biosolids forms, liquid and cake forms currently hold the largest market share in 2025. Agricultural land application remains the leading application segment, however, the demand for biosolids in energy production is growing steadily. Class A and Class A EQ biosolids command premium pricing due to their high quality and broader applications.
- Key Drivers: Stringent environmental regulations, government incentives, advancements in treatment technology, and robust agricultural sector.
- Dominance Factors: Well-established wastewater treatment infrastructure, supportive policy environments, and high biosolids generation.
- Growth Potential: Expanding agricultural sector, increasing energy demand, and rising environmental awareness.
Biosolids Industry Product Landscape
The biosolids market encompasses a diverse range of products, primarily categorized by their physical form (cake, liquid, pellet) and treatment level (Class A, Class A EQ, Class B). The specific application of the biosolids also plays a significant role in defining product characteristics and market positioning. Recent innovations are focused on enhancing the quality and consistency of biosolids, thereby increasing their value as effective fertilizers and soil amendments. Advanced treatment methods like thermal hydrolysis and anaerobic digestion are instrumental in upgrading product quality, expanding application possibilities, and justifying premium pricing for high-quality biosolids. The key value propositions consistently emphasize sustainability, cost-effectiveness, and significant environmental benefits.
Key Drivers, Barriers & Challenges in Biosolids Industry
Key Drivers: Increasing urbanization driving higher wastewater volumes, stringent environmental regulations, growing demand for sustainable fertilizers, and technological advancements offering improved biosolids processing and application methods.
Challenges: High capital investment required for advanced treatment technologies, logistical complexities associated with transportation and land application, public perception issues relating to biosolids usage, and regulatory uncertainties across different jurisdictions potentially lead to inconsistencies in market performance.
Emerging Opportunities in Biosolids Industry
Untapped markets in developing economies offer significant growth potential, as do innovative applications of biosolids in carbon sequestration and biofuel production. Evolving consumer preferences favor eco-friendly products, creating a positive market outlook. Further research and development into cost-effective and sustainable technologies will unlock opportunities for market expansion.
Growth Accelerators in the Biosolids Industry
Technological breakthroughs in treatment processes are continuously improving biosolids quality and expanding their applications. Strategic partnerships between wastewater treatment plants and agricultural entities are streamlining biosolids distribution and utilization. Market expansion strategies focusing on untapped markets in developing countries present substantial long-term growth potential.
Key Players Shaping the Biosolids Industry Market
- Walker Industries
- Cambi ASA
- Eco-trass
- DC Water
- Recyc Systems Inc
- BCR Environmental
- Aguas Andinas SA
- Cleanaway
- SYLVIS
- Casella Waste Systems Inc
- Englobe
- Agrivert Ltd
- Saur
- Alan Srl
- Lystek International
- REMONDIS SE & Co KG
- FCC Group
- Synagro Technologies
- C R E - Centro di Ricerche Ecologiche
- Parker Ag Services LLC
- Terrapure BR Ltd
- Merrell Bros Inc
- Allevi Srl
Notable Milestones in Biosolids Industry Sector
- January 2023: Synagro Technologies Inc. acquired Burch Hydro Inc., expanding its market reach and service offerings.
- November 2022: The San Francisco Public Utilities Commission (SFPUC) partnered with Cambi to install advanced thermal hydrolysis systems, representing a significant investment in biosolids treatment infrastructure.
In-Depth Biosolids Industry Market Outlook
The biosolids market is poised for significant expansion, driven by a confluence of factors including rapid technological progress, heightened environmental awareness among consumers and businesses, and supportive government policies promoting sustainable waste management practices. Strategic alliances and partnerships, along with targeted market expansion into developing economies, will be pivotal in driving future growth. Promising opportunities abound in the development of novel biosolids applications and enhancing the overall value proposition of biosolids as a valuable and sustainable resource.
Biosolids Industry Segmentation
-
1. Type
- 1.1. Class A
- 1.2. Class A EQ (Exceptional Quality)
- 1.3. Class B
-
2. Form
- 2.1. Cakes
- 2.2. Liquid
- 2.3. Pellet
-
3. Application
-
3.1. Agriculture land Application
- 3.1.1. Fertiliz
- 3.1.2. Fertilizer for Animal Crop Production - Pastures
-
3.2. Non-agricultural Land Application
- 3.2.1. Forest Crops (Land Restoration and Forestry)
- 3.2.2. Land Reclamation (Roads and Urban Wetlands)
- 3.2.3. Reclaiming Mining Sites
- 3.2.4. Landscaping, Recreational Fields, and Domestic Use
-
3.3. Energy Recovery Energy Production
- 3.3.1. Heat Generation, Incineration, and Gasification
- 3.3.2. Oil and Cement Production
- 3.3.3. Commercial Uses
-
3.1. Agriculture land Application
Biosolids Industry Segmentation By Geography
-
1. Asia Pacific
- 1.1. China
- 1.2. India
- 1.3. Japan
- 1.4. South Korea
- 1.5. Malaysia
- 1.6. Thailand
- 1.7. Indonesia
- 1.8. Vietnam
- 1.9. Rest of Asia Pacific
-
2. North America
- 2.1. United States
- 2.2. Canada
- 2.3. Mexico
-
3. Europe
- 3.1. Germany
- 3.2. United Kingdom
- 3.3. Italy
- 3.4. France
- 3.5. Spain
- 3.6. NORDIC
- 3.7. Turkey
- 3.8. Russia
- 3.9. Rest of Europe
-
4. South America
- 4.1. Brazil
- 4.2. Argentina
- 4.3. Colombia
- 4.4. Rest of South America
-
5. Middle East and Africa
- 5.1. Saudi Arabia
- 5.2. South Africa
- 5.3. Nigeria
- 5.4. Qatar
- 5.5. Egypt
- 5.6. United Arab Emirates
- 5.7. Rest of Middle East and Africa
Biosolids Industry Regional Market Share
Geographic Coverage of Biosolids Industry
Biosolids Industry REPORT HIGHLIGHTS
| Aspects | Details |
|---|---|
| Study Period | 2020-2034 |
| Base Year | 2025 |
| Estimated Year | 2026 |
| Forecast Period | 2026-2034 |
| Historical Period | 2020-2025 |
| Growth Rate | CAGR of > 3.50% from 2020-2034 |
| Segmentation |
|
Table of Contents
- 1. Introduction
- 1.1. Research Scope
- 1.2. Market Segmentation
- 1.3. Research Objective
- 1.4. Definitions and Assumptions
- 2. Executive Summary
- 2.1. Market Snapshot
- 3. Market Dynamics
- 3.1. Market Drivers
- 3.2. Market Restrains
- 3.3. Market Trends
- 3.4. Market Opportunities
- 4. Market Factor Analysis
- 4.1. Porters Five Forces
- 4.1.1. Bargaining Power of Suppliers
- 4.1.2. Bargaining Power of Buyers
- 4.1.3. Threat of New Entrants
- 4.1.4. Threat of Substitutes
- 4.1.5. Competitive Rivalry
- 4.2. PESTEL analysis
- 4.3. BCG Analysis
- 4.3.1. Stars (High Growth, High Market Share)
- 4.3.2. Cash Cows (Low Growth, High Market Share)
- 4.3.3. Question Mark (High Growth, Low Market Share)
- 4.3.4. Dogs (Low Growth, Low Market Share)
- 4.4. Ansoff Matrix Analysis
- 4.5. Supply Chain Analysis
- 4.6. Regulatory Landscape
- 4.7. Current Market Potential and Opportunity Assessment (TAM–SAM–SOM Framework)
- 4.8. IMR Analyst Note
- 4.1. Porters Five Forces
- 5. Market Analysis, Insights and Forecast 2021-2033
- 5.1. Market Analysis, Insights and Forecast - by Type
- 5.1.1. Class A
- 5.1.2. Class A EQ (Exceptional Quality)
- 5.1.3. Class B
- 5.2. Market Analysis, Insights and Forecast - by Form
- 5.2.1. Cakes
- 5.2.2. Liquid
- 5.2.3. Pellet
- 5.3. Market Analysis, Insights and Forecast - by Application
- 5.3.1. Agriculture land Application
- 5.3.1.1. Fertiliz
- 5.3.1.2. Fertilizer for Animal Crop Production - Pastures
- 5.3.2. Non-agricultural Land Application
- 5.3.2.1. Forest Crops (Land Restoration and Forestry)
- 5.3.2.2. Land Reclamation (Roads and Urban Wetlands)
- 5.3.2.3. Reclaiming Mining Sites
- 5.3.2.4. Landscaping, Recreational Fields, and Domestic Use
- 5.3.3. Energy Recovery Energy Production
- 5.3.3.1. Heat Generation, Incineration, and Gasification
- 5.3.3.2. Oil and Cement Production
- 5.3.3.3. Commercial Uses
- 5.3.1. Agriculture land Application
- 5.4. Market Analysis, Insights and Forecast - by Region
- 5.4.1. Asia Pacific
- 5.4.2. North America
- 5.4.3. Europe
- 5.4.4. South America
- 5.4.5. Middle East and Africa
- 5.1. Market Analysis, Insights and Forecast - by Type
- 6. Global Biosolids Industry Analysis, Insights and Forecast, 2021-2033
- 6.1. Market Analysis, Insights and Forecast - by Type
- 6.1.1. Class A
- 6.1.2. Class A EQ (Exceptional Quality)
- 6.1.3. Class B
- 6.2. Market Analysis, Insights and Forecast - by Form
- 6.2.1. Cakes
- 6.2.2. Liquid
- 6.2.3. Pellet
- 6.3. Market Analysis, Insights and Forecast - by Application
- 6.3.1. Agriculture land Application
- 6.3.1.1. Fertiliz
- 6.3.1.2. Fertilizer for Animal Crop Production - Pastures
- 6.3.2. Non-agricultural Land Application
- 6.3.2.1. Forest Crops (Land Restoration and Forestry)
- 6.3.2.2. Land Reclamation (Roads and Urban Wetlands)
- 6.3.2.3. Reclaiming Mining Sites
- 6.3.2.4. Landscaping, Recreational Fields, and Domestic Use
- 6.3.3. Energy Recovery Energy Production
- 6.3.3.1. Heat Generation, Incineration, and Gasification
- 6.3.3.2. Oil and Cement Production
- 6.3.3.3. Commercial Uses
- 6.3.1. Agriculture land Application
- 6.1. Market Analysis, Insights and Forecast - by Type
- 7. Asia Pacific Biosolids Industry Analysis, Insights and Forecast, 2020-2032
- 7.1. Market Analysis, Insights and Forecast - by Type
- 7.1.1. Class A
- 7.1.2. Class A EQ (Exceptional Quality)
- 7.1.3. Class B
- 7.2. Market Analysis, Insights and Forecast - by Form
- 7.2.1. Cakes
- 7.2.2. Liquid
- 7.2.3. Pellet
- 7.3. Market Analysis, Insights and Forecast - by Application
- 7.3.1. Agriculture land Application
- 7.3.1.1. Fertiliz
- 7.3.1.2. Fertilizer for Animal Crop Production - Pastures
- 7.3.2. Non-agricultural Land Application
- 7.3.2.1. Forest Crops (Land Restoration and Forestry)
- 7.3.2.2. Land Reclamation (Roads and Urban Wetlands)
- 7.3.2.3. Reclaiming Mining Sites
- 7.3.2.4. Landscaping, Recreational Fields, and Domestic Use
- 7.3.3. Energy Recovery Energy Production
- 7.3.3.1. Heat Generation, Incineration, and Gasification
- 7.3.3.2. Oil and Cement Production
- 7.3.3.3. Commercial Uses
- 7.3.1. Agriculture land Application
- 7.1. Market Analysis, Insights and Forecast - by Type
- 8. North America Biosolids Industry Analysis, Insights and Forecast, 2020-2032
- 8.1. Market Analysis, Insights and Forecast - by Type
- 8.1.1. Class A
- 8.1.2. Class A EQ (Exceptional Quality)
- 8.1.3. Class B
- 8.2. Market Analysis, Insights and Forecast - by Form
- 8.2.1. Cakes
- 8.2.2. Liquid
- 8.2.3. Pellet
- 8.3. Market Analysis, Insights and Forecast - by Application
- 8.3.1. Agriculture land Application
- 8.3.1.1. Fertiliz
- 8.3.1.2. Fertilizer for Animal Crop Production - Pastures
- 8.3.2. Non-agricultural Land Application
- 8.3.2.1. Forest Crops (Land Restoration and Forestry)
- 8.3.2.2. Land Reclamation (Roads and Urban Wetlands)
- 8.3.2.3. Reclaiming Mining Sites
- 8.3.2.4. Landscaping, Recreational Fields, and Domestic Use
- 8.3.3. Energy Recovery Energy Production
- 8.3.3.1. Heat Generation, Incineration, and Gasification
- 8.3.3.2. Oil and Cement Production
- 8.3.3.3. Commercial Uses
- 8.3.1. Agriculture land Application
- 8.1. Market Analysis, Insights and Forecast - by Type
- 9. Europe Biosolids Industry Analysis, Insights and Forecast, 2020-2032
- 9.1. Market Analysis, Insights and Forecast - by Type
- 9.1.1. Class A
- 9.1.2. Class A EQ (Exceptional Quality)
- 9.1.3. Class B
- 9.2. Market Analysis, Insights and Forecast - by Form
- 9.2.1. Cakes
- 9.2.2. Liquid
- 9.2.3. Pellet
- 9.3. Market Analysis, Insights and Forecast - by Application
- 9.3.1. Agriculture land Application
- 9.3.1.1. Fertiliz
- 9.3.1.2. Fertilizer for Animal Crop Production - Pastures
- 9.3.2. Non-agricultural Land Application
- 9.3.2.1. Forest Crops (Land Restoration and Forestry)
- 9.3.2.2. Land Reclamation (Roads and Urban Wetlands)
- 9.3.2.3. Reclaiming Mining Sites
- 9.3.2.4. Landscaping, Recreational Fields, and Domestic Use
- 9.3.3. Energy Recovery Energy Production
- 9.3.3.1. Heat Generation, Incineration, and Gasification
- 9.3.3.2. Oil and Cement Production
- 9.3.3.3. Commercial Uses
- 9.3.1. Agriculture land Application
- 9.1. Market Analysis, Insights and Forecast - by Type
- 10. South America Biosolids Industry Analysis, Insights and Forecast, 2020-2032
- 10.1. Market Analysis, Insights and Forecast - by Type
- 10.1.1. Class A
- 10.1.2. Class A EQ (Exceptional Quality)
- 10.1.3. Class B
- 10.2. Market Analysis, Insights and Forecast - by Form
- 10.2.1. Cakes
- 10.2.2. Liquid
- 10.2.3. Pellet
- 10.3. Market Analysis, Insights and Forecast - by Application
- 10.3.1. Agriculture land Application
- 10.3.1.1. Fertiliz
- 10.3.1.2. Fertilizer for Animal Crop Production - Pastures
- 10.3.2. Non-agricultural Land Application
- 10.3.2.1. Forest Crops (Land Restoration and Forestry)
- 10.3.2.2. Land Reclamation (Roads and Urban Wetlands)
- 10.3.2.3. Reclaiming Mining Sites
- 10.3.2.4. Landscaping, Recreational Fields, and Domestic Use
- 10.3.3. Energy Recovery Energy Production
- 10.3.3.1. Heat Generation, Incineration, and Gasification
- 10.3.3.2. Oil and Cement Production
- 10.3.3.3. Commercial Uses
- 10.3.1. Agriculture land Application
- 10.1. Market Analysis, Insights and Forecast - by Type
- 11. Middle East and Africa Biosolids Industry Analysis, Insights and Forecast, 2020-2032
- 11.1. Market Analysis, Insights and Forecast - by Type
- 11.1.1. Class A
- 11.1.2. Class A EQ (Exceptional Quality)
- 11.1.3. Class B
- 11.2. Market Analysis, Insights and Forecast - by Form
- 11.2.1. Cakes
- 11.2.2. Liquid
- 11.2.3. Pellet
- 11.3. Market Analysis, Insights and Forecast - by Application
- 11.3.1. Agriculture land Application
- 11.3.1.1. Fertiliz
- 11.3.1.2. Fertilizer for Animal Crop Production - Pastures
- 11.3.2. Non-agricultural Land Application
- 11.3.2.1. Forest Crops (Land Restoration and Forestry)
- 11.3.2.2. Land Reclamation (Roads and Urban Wetlands)
- 11.3.2.3. Reclaiming Mining Sites
- 11.3.2.4. Landscaping, Recreational Fields, and Domestic Use
- 11.3.3. Energy Recovery Energy Production
- 11.3.3.1. Heat Generation, Incineration, and Gasification
- 11.3.3.2. Oil and Cement Production
- 11.3.3.3. Commercial Uses
- 11.3.1. Agriculture land Application
- 11.1. Market Analysis, Insights and Forecast - by Type
- 12. Competitive Analysis
- 12.1. Company Profiles
- 12.1.1 Walker Industries*List Not Exhaustive
- 12.1.1.1. Company Overview
- 12.1.1.2. Products
- 12.1.1.3. Company Financials
- 12.1.1.4. SWOT Analysis
- 12.1.2 Cambi ASA
- 12.1.2.1. Company Overview
- 12.1.2.2. Products
- 12.1.2.3. Company Financials
- 12.1.2.4. SWOT Analysis
- 12.1.3 Eco-trass
- 12.1.3.1. Company Overview
- 12.1.3.2. Products
- 12.1.3.3. Company Financials
- 12.1.3.4. SWOT Analysis
- 12.1.4 DC Water
- 12.1.4.1. Company Overview
- 12.1.4.2. Products
- 12.1.4.3. Company Financials
- 12.1.4.4. SWOT Analysis
- 12.1.5 Recyc Systems Inc
- 12.1.5.1. Company Overview
- 12.1.5.2. Products
- 12.1.5.3. Company Financials
- 12.1.5.4. SWOT Analysis
- 12.1.6 BCR Environmental
- 12.1.6.1. Company Overview
- 12.1.6.2. Products
- 12.1.6.3. Company Financials
- 12.1.6.4. SWOT Analysis
- 12.1.7 Aguas Andinas SA
- 12.1.7.1. Company Overview
- 12.1.7.2. Products
- 12.1.7.3. Company Financials
- 12.1.7.4. SWOT Analysis
- 12.1.8 Cleanaway
- 12.1.8.1. Company Overview
- 12.1.8.2. Products
- 12.1.8.3. Company Financials
- 12.1.8.4. SWOT Analysis
- 12.1.9 SYLVIS
- 12.1.9.1. Company Overview
- 12.1.9.2. Products
- 12.1.9.3. Company Financials
- 12.1.9.4. SWOT Analysis
- 12.1.10 Casella Waste Systems Inc
- 12.1.10.1. Company Overview
- 12.1.10.2. Products
- 12.1.10.3. Company Financials
- 12.1.10.4. SWOT Analysis
- 12.1.11 Englobe
- 12.1.11.1. Company Overview
- 12.1.11.2. Products
- 12.1.11.3. Company Financials
- 12.1.11.4. SWOT Analysis
- 12.1.12 Agrivert Ltd
- 12.1.12.1. Company Overview
- 12.1.12.2. Products
- 12.1.12.3. Company Financials
- 12.1.12.4. SWOT Analysis
- 12.1.13 Saur
- 12.1.13.1. Company Overview
- 12.1.13.2. Products
- 12.1.13.3. Company Financials
- 12.1.13.4. SWOT Analysis
- 12.1.14 Alan Srl
- 12.1.14.1. Company Overview
- 12.1.14.2. Products
- 12.1.14.3. Company Financials
- 12.1.14.4. SWOT Analysis
- 12.1.15 Lystek International
- 12.1.15.1. Company Overview
- 12.1.15.2. Products
- 12.1.15.3. Company Financials
- 12.1.15.4. SWOT Analysis
- 12.1.16 REMONDIS SE & Co KG
- 12.1.16.1. Company Overview
- 12.1.16.2. Products
- 12.1.16.3. Company Financials
- 12.1.16.4. SWOT Analysis
- 12.1.17 FCC Group
- 12.1.17.1. Company Overview
- 12.1.17.2. Products
- 12.1.17.3. Company Financials
- 12.1.17.4. SWOT Analysis
- 12.1.18 Synagro Technologies
- 12.1.18.1. Company Overview
- 12.1.18.2. Products
- 12.1.18.3. Company Financials
- 12.1.18.4. SWOT Analysis
- 12.1.19 C R E - Centro di Ricerche Ecologiche
- 12.1.19.1. Company Overview
- 12.1.19.2. Products
- 12.1.19.3. Company Financials
- 12.1.19.4. SWOT Analysis
- 12.1.20 Parker Ag Services LLC
- 12.1.20.1. Company Overview
- 12.1.20.2. Products
- 12.1.20.3. Company Financials
- 12.1.20.4. SWOT Analysis
- 12.1.21 Terrapure BR Ltd
- 12.1.21.1. Company Overview
- 12.1.21.2. Products
- 12.1.21.3. Company Financials
- 12.1.21.4. SWOT Analysis
- 12.1.22 Merrell Bros Inc
- 12.1.22.1. Company Overview
- 12.1.22.2. Products
- 12.1.22.3. Company Financials
- 12.1.22.4. SWOT Analysis
- 12.1.23 Allevi Srl
- 12.1.23.1. Company Overview
- 12.1.23.2. Products
- 12.1.23.3. Company Financials
- 12.1.23.4. SWOT Analysis
- 12.1.1 Walker Industries*List Not Exhaustive
- 12.2. Market Entropy
- 12.2.1 Company's Key Areas Served
- 12.2.2 Recent Developments
- 12.3. Company Market Share Analysis 2025
- 12.3.1 Top 5 Companies Market Share Analysis
- 12.3.2 Top 3 Companies Market Share Analysis
- 12.4. List of Potential Customers
- 13. Research Methodology
List of Figures
- Figure 1: Global Biosolids Industry Revenue Breakdown (Million, %) by Region 2025 & 2033
- Figure 2: Global Biosolids Industry Volume Breakdown (liter , %) by Region 2025 & 2033
- Figure 3: Asia Pacific Biosolids Industry Revenue (Million), by Type 2025 & 2033
- Figure 4: Asia Pacific Biosolids Industry Volume (liter ), by Type 2025 & 2033
- Figure 5: Asia Pacific Biosolids Industry Revenue Share (%), by Type 2025 & 2033
- Figure 6: Asia Pacific Biosolids Industry Volume Share (%), by Type 2025 & 2033
- Figure 7: Asia Pacific Biosolids Industry Revenue (Million), by Form 2025 & 2033
- Figure 8: Asia Pacific Biosolids Industry Volume (liter ), by Form 2025 & 2033
- Figure 9: Asia Pacific Biosolids Industry Revenue Share (%), by Form 2025 & 2033
- Figure 10: Asia Pacific Biosolids Industry Volume Share (%), by Form 2025 & 2033
- Figure 11: Asia Pacific Biosolids Industry Revenue (Million), by Application 2025 & 2033
- Figure 12: Asia Pacific Biosolids Industry Volume (liter ), by Application 2025 & 2033
- Figure 13: Asia Pacific Biosolids Industry Revenue Share (%), by Application 2025 & 2033
- Figure 14: Asia Pacific Biosolids Industry Volume Share (%), by Application 2025 & 2033
- Figure 15: Asia Pacific Biosolids Industry Revenue (Million), by Country 2025 & 2033
- Figure 16: Asia Pacific Biosolids Industry Volume (liter ), by Country 2025 & 2033
- Figure 17: Asia Pacific Biosolids Industry Revenue Share (%), by Country 2025 & 2033
- Figure 18: Asia Pacific Biosolids Industry Volume Share (%), by Country 2025 & 2033
- Figure 19: North America Biosolids Industry Revenue (Million), by Type 2025 & 2033
- Figure 20: North America Biosolids Industry Volume (liter ), by Type 2025 & 2033
- Figure 21: North America Biosolids Industry Revenue Share (%), by Type 2025 & 2033
- Figure 22: North America Biosolids Industry Volume Share (%), by Type 2025 & 2033
- Figure 23: North America Biosolids Industry Revenue (Million), by Form 2025 & 2033
- Figure 24: North America Biosolids Industry Volume (liter ), by Form 2025 & 2033
- Figure 25: North America Biosolids Industry Revenue Share (%), by Form 2025 & 2033
- Figure 26: North America Biosolids Industry Volume Share (%), by Form 2025 & 2033
- Figure 27: North America Biosolids Industry Revenue (Million), by Application 2025 & 2033
- Figure 28: North America Biosolids Industry Volume (liter ), by Application 2025 & 2033
- Figure 29: North America Biosolids Industry Revenue Share (%), by Application 2025 & 2033
- Figure 30: North America Biosolids Industry Volume Share (%), by Application 2025 & 2033
- Figure 31: North America Biosolids Industry Revenue (Million), by Country 2025 & 2033
- Figure 32: North America Biosolids Industry Volume (liter ), by Country 2025 & 2033
- Figure 33: North America Biosolids Industry Revenue Share (%), by Country 2025 & 2033
- Figure 34: North America Biosolids Industry Volume Share (%), by Country 2025 & 2033
- Figure 35: Europe Biosolids Industry Revenue (Million), by Type 2025 & 2033
- Figure 36: Europe Biosolids Industry Volume (liter ), by Type 2025 & 2033
- Figure 37: Europe Biosolids Industry Revenue Share (%), by Type 2025 & 2033
- Figure 38: Europe Biosolids Industry Volume Share (%), by Type 2025 & 2033
- Figure 39: Europe Biosolids Industry Revenue (Million), by Form 2025 & 2033
- Figure 40: Europe Biosolids Industry Volume (liter ), by Form 2025 & 2033
- Figure 41: Europe Biosolids Industry Revenue Share (%), by Form 2025 & 2033
- Figure 42: Europe Biosolids Industry Volume Share (%), by Form 2025 & 2033
- Figure 43: Europe Biosolids Industry Revenue (Million), by Application 2025 & 2033
- Figure 44: Europe Biosolids Industry Volume (liter ), by Application 2025 & 2033
- Figure 45: Europe Biosolids Industry Revenue Share (%), by Application 2025 & 2033
- Figure 46: Europe Biosolids Industry Volume Share (%), by Application 2025 & 2033
- Figure 47: Europe Biosolids Industry Revenue (Million), by Country 2025 & 2033
- Figure 48: Europe Biosolids Industry Volume (liter ), by Country 2025 & 2033
- Figure 49: Europe Biosolids Industry Revenue Share (%), by Country 2025 & 2033
- Figure 50: Europe Biosolids Industry Volume Share (%), by Country 2025 & 2033
- Figure 51: South America Biosolids Industry Revenue (Million), by Type 2025 & 2033
- Figure 52: South America Biosolids Industry Volume (liter ), by Type 2025 & 2033
- Figure 53: South America Biosolids Industry Revenue Share (%), by Type 2025 & 2033
- Figure 54: South America Biosolids Industry Volume Share (%), by Type 2025 & 2033
- Figure 55: South America Biosolids Industry Revenue (Million), by Form 2025 & 2033
- Figure 56: South America Biosolids Industry Volume (liter ), by Form 2025 & 2033
- Figure 57: South America Biosolids Industry Revenue Share (%), by Form 2025 & 2033
- Figure 58: South America Biosolids Industry Volume Share (%), by Form 2025 & 2033
- Figure 59: South America Biosolids Industry Revenue (Million), by Application 2025 & 2033
- Figure 60: South America Biosolids Industry Volume (liter ), by Application 2025 & 2033
- Figure 61: South America Biosolids Industry Revenue Share (%), by Application 2025 & 2033
- Figure 62: South America Biosolids Industry Volume Share (%), by Application 2025 & 2033
- Figure 63: South America Biosolids Industry Revenue (Million), by Country 2025 & 2033
- Figure 64: South America Biosolids Industry Volume (liter ), by Country 2025 & 2033
- Figure 65: South America Biosolids Industry Revenue Share (%), by Country 2025 & 2033
- Figure 66: South America Biosolids Industry Volume Share (%), by Country 2025 & 2033
- Figure 67: Middle East and Africa Biosolids Industry Revenue (Million), by Type 2025 & 2033
- Figure 68: Middle East and Africa Biosolids Industry Volume (liter ), by Type 2025 & 2033
- Figure 69: Middle East and Africa Biosolids Industry Revenue Share (%), by Type 2025 & 2033
- Figure 70: Middle East and Africa Biosolids Industry Volume Share (%), by Type 2025 & 2033
- Figure 71: Middle East and Africa Biosolids Industry Revenue (Million), by Form 2025 & 2033
- Figure 72: Middle East and Africa Biosolids Industry Volume (liter ), by Form 2025 & 2033
- Figure 73: Middle East and Africa Biosolids Industry Revenue Share (%), by Form 2025 & 2033
- Figure 74: Middle East and Africa Biosolids Industry Volume Share (%), by Form 2025 & 2033
- Figure 75: Middle East and Africa Biosolids Industry Revenue (Million), by Application 2025 & 2033
- Figure 76: Middle East and Africa Biosolids Industry Volume (liter ), by Application 2025 & 2033
- Figure 77: Middle East and Africa Biosolids Industry Revenue Share (%), by Application 2025 & 2033
- Figure 78: Middle East and Africa Biosolids Industry Volume Share (%), by Application 2025 & 2033
- Figure 79: Middle East and Africa Biosolids Industry Revenue (Million), by Country 2025 & 2033
- Figure 80: Middle East and Africa Biosolids Industry Volume (liter ), by Country 2025 & 2033
- Figure 81: Middle East and Africa Biosolids Industry Revenue Share (%), by Country 2025 & 2033
- Figure 82: Middle East and Africa Biosolids Industry Volume Share (%), by Country 2025 & 2033
List of Tables
- Table 1: Global Biosolids Industry Revenue Million Forecast, by Type 2020 & 2033
- Table 2: Global Biosolids Industry Volume liter Forecast, by Type 2020 & 2033
- Table 3: Global Biosolids Industry Revenue Million Forecast, by Form 2020 & 2033
- Table 4: Global Biosolids Industry Volume liter Forecast, by Form 2020 & 2033
- Table 5: Global Biosolids Industry Revenue Million Forecast, by Application 2020 & 2033
- Table 6: Global Biosolids Industry Volume liter Forecast, by Application 2020 & 2033
- Table 7: Global Biosolids Industry Revenue Million Forecast, by Region 2020 & 2033
- Table 8: Global Biosolids Industry Volume liter Forecast, by Region 2020 & 2033
- Table 9: Global Biosolids Industry Revenue Million Forecast, by Type 2020 & 2033
- Table 10: Global Biosolids Industry Volume liter Forecast, by Type 2020 & 2033
- Table 11: Global Biosolids Industry Revenue Million Forecast, by Form 2020 & 2033
- Table 12: Global Biosolids Industry Volume liter Forecast, by Form 2020 & 2033
- Table 13: Global Biosolids Industry Revenue Million Forecast, by Application 2020 & 2033
- Table 14: Global Biosolids Industry Volume liter Forecast, by Application 2020 & 2033
- Table 15: Global Biosolids Industry Revenue Million Forecast, by Country 2020 & 2033
- Table 16: Global Biosolids Industry Volume liter Forecast, by Country 2020 & 2033
- Table 17: China Biosolids Industry Revenue (Million) Forecast, by Application 2020 & 2033
- Table 18: China Biosolids Industry Volume (liter ) Forecast, by Application 2020 & 2033
- Table 19: India Biosolids Industry Revenue (Million) Forecast, by Application 2020 & 2033
- Table 20: India Biosolids Industry Volume (liter ) Forecast, by Application 2020 & 2033
- Table 21: Japan Biosolids Industry Revenue (Million) Forecast, by Application 2020 & 2033
- Table 22: Japan Biosolids Industry Volume (liter ) Forecast, by Application 2020 & 2033
- Table 23: South Korea Biosolids Industry Revenue (Million) Forecast, by Application 2020 & 2033
- Table 24: South Korea Biosolids Industry Volume (liter ) Forecast, by Application 2020 & 2033
- Table 25: Malaysia Biosolids Industry Revenue (Million) Forecast, by Application 2020 & 2033
- Table 26: Malaysia Biosolids Industry Volume (liter ) Forecast, by Application 2020 & 2033
- Table 27: Thailand Biosolids Industry Revenue (Million) Forecast, by Application 2020 & 2033
- Table 28: Thailand Biosolids Industry Volume (liter ) Forecast, by Application 2020 & 2033
- Table 29: Indonesia Biosolids Industry Revenue (Million) Forecast, by Application 2020 & 2033
- Table 30: Indonesia Biosolids Industry Volume (liter ) Forecast, by Application 2020 & 2033
- Table 31: Vietnam Biosolids Industry Revenue (Million) Forecast, by Application 2020 & 2033
- Table 32: Vietnam Biosolids Industry Volume (liter ) Forecast, by Application 2020 & 2033
- Table 33: Rest of Asia Pacific Biosolids Industry Revenue (Million) Forecast, by Application 2020 & 2033
- Table 34: Rest of Asia Pacific Biosolids Industry Volume (liter ) Forecast, by Application 2020 & 2033
- Table 35: Global Biosolids Industry Revenue Million Forecast, by Type 2020 & 2033
- Table 36: Global Biosolids Industry Volume liter Forecast, by Type 2020 & 2033
- Table 37: Global Biosolids Industry Revenue Million Forecast, by Form 2020 & 2033
- Table 38: Global Biosolids Industry Volume liter Forecast, by Form 2020 & 2033
- Table 39: Global Biosolids Industry Revenue Million Forecast, by Application 2020 & 2033
- Table 40: Global Biosolids Industry Volume liter Forecast, by Application 2020 & 2033
- Table 41: Global Biosolids Industry Revenue Million Forecast, by Country 2020 & 2033
- Table 42: Global Biosolids Industry Volume liter Forecast, by Country 2020 & 2033
- Table 43: United States Biosolids Industry Revenue (Million) Forecast, by Application 2020 & 2033
- Table 44: United States Biosolids Industry Volume (liter ) Forecast, by Application 2020 & 2033
- Table 45: Canada Biosolids Industry Revenue (Million) Forecast, by Application 2020 & 2033
- Table 46: Canada Biosolids Industry Volume (liter ) Forecast, by Application 2020 & 2033
- Table 47: Mexico Biosolids Industry Revenue (Million) Forecast, by Application 2020 & 2033
- Table 48: Mexico Biosolids Industry Volume (liter ) Forecast, by Application 2020 & 2033
- Table 49: Global Biosolids Industry Revenue Million Forecast, by Type 2020 & 2033
- Table 50: Global Biosolids Industry Volume liter Forecast, by Type 2020 & 2033
- Table 51: Global Biosolids Industry Revenue Million Forecast, by Form 2020 & 2033
- Table 52: Global Biosolids Industry Volume liter Forecast, by Form 2020 & 2033
- Table 53: Global Biosolids Industry Revenue Million Forecast, by Application 2020 & 2033
- Table 54: Global Biosolids Industry Volume liter Forecast, by Application 2020 & 2033
- Table 55: Global Biosolids Industry Revenue Million Forecast, by Country 2020 & 2033
- Table 56: Global Biosolids Industry Volume liter Forecast, by Country 2020 & 2033
- Table 57: Germany Biosolids Industry Revenue (Million) Forecast, by Application 2020 & 2033
- Table 58: Germany Biosolids Industry Volume (liter ) Forecast, by Application 2020 & 2033
- Table 59: United Kingdom Biosolids Industry Revenue (Million) Forecast, by Application 2020 & 2033
- Table 60: United Kingdom Biosolids Industry Volume (liter ) Forecast, by Application 2020 & 2033
- Table 61: Italy Biosolids Industry Revenue (Million) Forecast, by Application 2020 & 2033
- Table 62: Italy Biosolids Industry Volume (liter ) Forecast, by Application 2020 & 2033
- Table 63: France Biosolids Industry Revenue (Million) Forecast, by Application 2020 & 2033
- Table 64: France Biosolids Industry Volume (liter ) Forecast, by Application 2020 & 2033
- Table 65: Spain Biosolids Industry Revenue (Million) Forecast, by Application 2020 & 2033
- Table 66: Spain Biosolids Industry Volume (liter ) Forecast, by Application 2020 & 2033
- Table 67: NORDIC Biosolids Industry Revenue (Million) Forecast, by Application 2020 & 2033
- Table 68: NORDIC Biosolids Industry Volume (liter ) Forecast, by Application 2020 & 2033
- Table 69: Turkey Biosolids Industry Revenue (Million) Forecast, by Application 2020 & 2033
- Table 70: Turkey Biosolids Industry Volume (liter ) Forecast, by Application 2020 & 2033
- Table 71: Russia Biosolids Industry Revenue (Million) Forecast, by Application 2020 & 2033
- Table 72: Russia Biosolids Industry Volume (liter ) Forecast, by Application 2020 & 2033
- Table 73: Rest of Europe Biosolids Industry Revenue (Million) Forecast, by Application 2020 & 2033
- Table 74: Rest of Europe Biosolids Industry Volume (liter ) Forecast, by Application 2020 & 2033
- Table 75: Global Biosolids Industry Revenue Million Forecast, by Type 2020 & 2033
- Table 76: Global Biosolids Industry Volume liter Forecast, by Type 2020 & 2033
- Table 77: Global Biosolids Industry Revenue Million Forecast, by Form 2020 & 2033
- Table 78: Global Biosolids Industry Volume liter Forecast, by Form 2020 & 2033
- Table 79: Global Biosolids Industry Revenue Million Forecast, by Application 2020 & 2033
- Table 80: Global Biosolids Industry Volume liter Forecast, by Application 2020 & 2033
- Table 81: Global Biosolids Industry Revenue Million Forecast, by Country 2020 & 2033
- Table 82: Global Biosolids Industry Volume liter Forecast, by Country 2020 & 2033
- Table 83: Brazil Biosolids Industry Revenue (Million) Forecast, by Application 2020 & 2033
- Table 84: Brazil Biosolids Industry Volume (liter ) Forecast, by Application 2020 & 2033
- Table 85: Argentina Biosolids Industry Revenue (Million) Forecast, by Application 2020 & 2033
- Table 86: Argentina Biosolids Industry Volume (liter ) Forecast, by Application 2020 & 2033
- Table 87: Colombia Biosolids Industry Revenue (Million) Forecast, by Application 2020 & 2033
- Table 88: Colombia Biosolids Industry Volume (liter ) Forecast, by Application 2020 & 2033
- Table 89: Rest of South America Biosolids Industry Revenue (Million) Forecast, by Application 2020 & 2033
- Table 90: Rest of South America Biosolids Industry Volume (liter ) Forecast, by Application 2020 & 2033
- Table 91: Global Biosolids Industry Revenue Million Forecast, by Type 2020 & 2033
- Table 92: Global Biosolids Industry Volume liter Forecast, by Type 2020 & 2033
- Table 93: Global Biosolids Industry Revenue Million Forecast, by Form 2020 & 2033
- Table 94: Global Biosolids Industry Volume liter Forecast, by Form 2020 & 2033
- Table 95: Global Biosolids Industry Revenue Million Forecast, by Application 2020 & 2033
- Table 96: Global Biosolids Industry Volume liter Forecast, by Application 2020 & 2033
- Table 97: Global Biosolids Industry Revenue Million Forecast, by Country 2020 & 2033
- Table 98: Global Biosolids Industry Volume liter Forecast, by Country 2020 & 2033
- Table 99: Saudi Arabia Biosolids Industry Revenue (Million) Forecast, by Application 2020 & 2033
- Table 100: Saudi Arabia Biosolids Industry Volume (liter ) Forecast, by Application 2020 & 2033
- Table 101: South Africa Biosolids Industry Revenue (Million) Forecast, by Application 2020 & 2033
- Table 102: South Africa Biosolids Industry Volume (liter ) Forecast, by Application 2020 & 2033
- Table 103: Nigeria Biosolids Industry Revenue (Million) Forecast, by Application 2020 & 2033
- Table 104: Nigeria Biosolids Industry Volume (liter ) Forecast, by Application 2020 & 2033
- Table 105: Qatar Biosolids Industry Revenue (Million) Forecast, by Application 2020 & 2033
- Table 106: Qatar Biosolids Industry Volume (liter ) Forecast, by Application 2020 & 2033
- Table 107: Egypt Biosolids Industry Revenue (Million) Forecast, by Application 2020 & 2033
- Table 108: Egypt Biosolids Industry Volume (liter ) Forecast, by Application 2020 & 2033
- Table 109: United Arab Emirates Biosolids Industry Revenue (Million) Forecast, by Application 2020 & 2033
- Table 110: United Arab Emirates Biosolids Industry Volume (liter ) Forecast, by Application 2020 & 2033
- Table 111: Rest of Middle East and Africa Biosolids Industry Revenue (Million) Forecast, by Application 2020 & 2033
- Table 112: Rest of Middle East and Africa Biosolids Industry Volume (liter ) Forecast, by Application 2020 & 2033
Frequently Asked Questions
1. What is the projected Compound Annual Growth Rate (CAGR) of the Biosolids Industry?
The projected CAGR is approximately > 3.50%.
2. Which companies are prominent players in the Biosolids Industry?
Key companies in the market include Walker Industries*List Not Exhaustive, Cambi ASA, Eco-trass, DC Water, Recyc Systems Inc, BCR Environmental, Aguas Andinas SA, Cleanaway, SYLVIS, Casella Waste Systems Inc, Englobe, Agrivert Ltd, Saur, Alan Srl, Lystek International, REMONDIS SE & Co KG, FCC Group, Synagro Technologies, C R E - Centro di Ricerche Ecologiche, Parker Ag Services LLC, Terrapure BR Ltd, Merrell Bros Inc, Allevi Srl.
3. What are the main segments of the Biosolids Industry?
The market segments include Type, Form, Application.
4. Can you provide details about the market size?
The market size is estimated to be USD 1700 Million as of 2022.
5. What are some drivers contributing to market growth?
Replacing Hazardous Chemical Fertilizers in North America; Stringent Government Emission Laws; Other Drivers.
6. What are the notable trends driving market growth?
Agricultural Land Application to Dominate the Market.
7. Are there any restraints impacting market growth?
Lack of Proper Knowledge and Awareness on Biosolids; Other Restraints.
8. Can you provide examples of recent developments in the market?
January 2023: Synagro Technologies Inc., a provider of biosolids and residual solutions, acquired Burch Hydro Inc., an Ohio-based premier provider of biosolids and lime-residuals management and land application.
9. What pricing options are available for accessing the report?
Pricing options include single-user, multi-user, and enterprise licenses priced at USD 4750, USD 5250, and USD 8750 respectively.
10. Is the market size provided in terms of value or volume?
The market size is provided in terms of value, measured in Million and volume, measured in liter .
11. Are there any specific market keywords associated with the report?
Yes, the market keyword associated with the report is "Biosolids Industry," which aids in identifying and referencing the specific market segment covered.
12. How do I determine which pricing option suits my needs best?
The pricing options vary based on user requirements and access needs. Individual users may opt for single-user licenses, while businesses requiring broader access may choose multi-user or enterprise licenses for cost-effective access to the report.
13. Are there any additional resources or data provided in the Biosolids Industry report?
While the report offers comprehensive insights, it's advisable to review the specific contents or supplementary materials provided to ascertain if additional resources or data are available.
14. How can I stay updated on further developments or reports in the Biosolids Industry?
To stay informed about further developments, trends, and reports in the Biosolids Industry, consider subscribing to industry newsletters, following relevant companies and organizations, or regularly checking reputable industry news sources and publications.
Methodology
Step 1 - Identification of Relevant Samples Size from Population Database


Step 2 - Approaches for Defining Global Market Size (Value, Volume* & Price*)

Note*: In applicable scenarios
Step 3 - Data Sources
Primary Research
- Web Analytics
- Survey Reports
- Research Institute
- Latest Research Reports
- Opinion Leaders
Secondary Research
- Annual Reports
- White Paper
- Latest Press Release
- Industry Association
- Paid Database
- Investor Presentations

Step 4 - Data Triangulation
Involves using different sources of information in order to increase the validity of a study
These sources are likely to be stakeholders in a program - participants, other researchers, program staff, other community members, and so on.
Then we put all data in single framework & apply various statistical tools to find out the dynamic on the market.
During the analysis stage, feedback from the stakeholder groups would be compared to determine areas of agreement as well as areas of divergence