

Key Insights
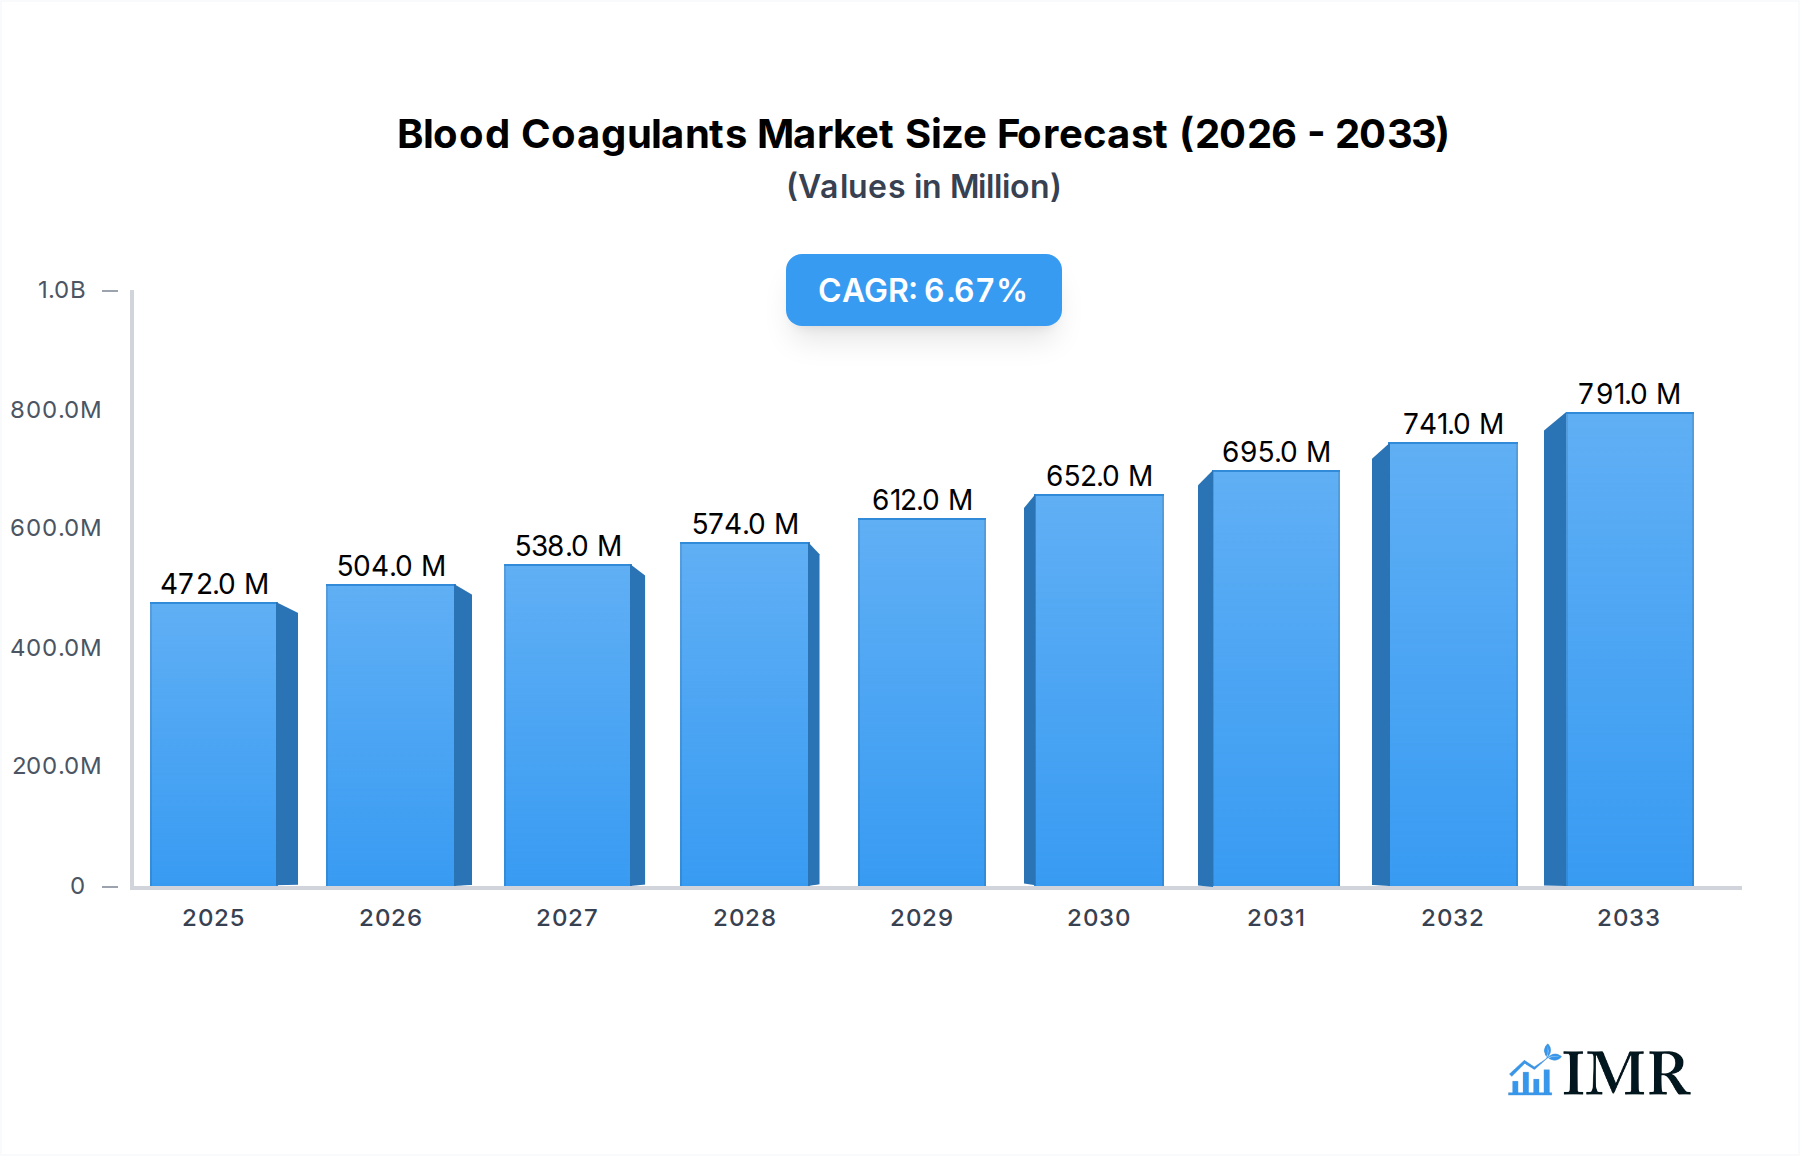
The global Blood Coagulants market is poised for robust expansion, projected to reach a significant $472 million in 2025, with an anticipated Compound Annual Growth Rate (CAGR) of 6.7% through 2033. This growth is underpinned by a confluence of factors, including the increasing prevalence of bleeding disorders like hemophilia and von Willebrand disease, coupled with advancements in recombinant DNA technology that have led to the development of more effective and safer coagulation factor therapies. The rising demand for minimally invasive procedures and the growing awareness among healthcare professionals and patients regarding early diagnosis and treatment further fuel market expansion. Geographically, North America and Europe are expected to lead the market, driven by high healthcare expenditure, developed healthcare infrastructure, and a strong emphasis on research and development for novel hemostatic agents.

Blood Coagulants Market Size (In Million)
The market is segmented into Recombinant Coagulation Factor and Plasma Coagulation Factor types, with recombinant therapies gaining traction due to their higher purity, consistency, and reduced risk of pathogen transmission compared to plasma-derived products. Applications span hospitals, pharmacies, and other healthcare settings, with hospitals representing the largest share due to their critical role in managing acute bleeding events and complex coagulation disorders. Key players such as Pfizer, Bayer, Novo Nordisk, and Takeda are actively investing in R&D to introduce innovative treatments and expand their product portfolios, further stimulating market dynamics. While the high cost of some advanced therapies and the stringent regulatory approval processes present certain restraints, the ongoing surge in demand for life-saving blood coagulants, particularly in emerging economies, is expected to outweigh these challenges, ensuring sustained market growth.
Blood Coagulants Company Market Share
Comprehensive Blood Coagulants Market Report: Dynamics, Trends, and Future Outlook (2019-2033)
This in-depth market research report provides a definitive analysis of the global blood coagulants market, encompassing a detailed examination of its dynamics, growth trajectories, regional dominance, product landscape, and future outlook. Covering the period from 2019 to 2033, with a base year of 2025, this report is an essential resource for stakeholders seeking to understand the evolving market for essential hemostatic agents and therapeutic solutions.
Blood Coagulants Market Dynamics & Structure
The global blood coagulants market is characterized by a moderate to high concentration, with leading players like Pfizer, Bayer, Novo Nordisk, Takeda, SOBI, Octapharma, and CSL holding significant market shares. Technological innovation is a primary driver, particularly the advancement of recombinant coagulation factors, offering improved safety profiles and efficacy compared to plasma-derived products. Regulatory frameworks, overseen by bodies such as the FDA and EMA, play a crucial role in product approval, pricing, and market access, influencing the pace of innovation and market entry. Competitive product substitutes, including antifibrinolytic agents and hemostatic devices, present a dynamic competitive landscape. End-user demographics, primarily driven by the prevalence of bleeding disorders like hemophilia and von Willebrand disease, as well as surgical procedures, significantly shape demand. Mergers and acquisitions (M&A) trends are notable, with companies strategically acquiring smaller firms or forming partnerships to expand their product portfolios and geographic reach.
- Market Concentration: Dominated by a few key players, with ongoing consolidation.
- Technological Innovation: Driven by advancements in recombinant therapies and gene therapy research.
- Regulatory Frameworks: Stringent approval processes influencing product lifecycle and market penetration.
- Competitive Substitutes: Growing influence of hemostatic devices and alternative therapies.
- End-User Demographics: Increasing diagnosis rates of bleeding disorders and an aging global population.
- M&A Trends: Strategic acquisitions and collaborations to enhance market position and R&D capabilities.
Blood Coagulants Growth Trends & Insights
The blood coagulants market is poised for robust growth, projected to expand from approximately USD 35,000 million in the historical period to an estimated USD 45,000 million by 2033. This expansion is fueled by a confluence of factors including increasing awareness and diagnosis of bleeding disorders, advancements in treatment modalities, and a growing demand for plasma-derived and recombinant therapies. The adoption rates for newer recombinant coagulation factors are steadily rising due to their enhanced safety and efficacy profiles, contributing to a shift away from traditional plasma-derived products in certain applications. Technological disruptions, such as the development of novel drug delivery systems and potential gene therapies, are anticipated to further reshape the market landscape in the coming years. Consumer behavior shifts are also evident, with patients and healthcare providers increasingly favoring treatments that offer greater convenience, reduced treatment burden, and improved quality of life. The market is expected to witness a Compound Annual Growth Rate (CAGR) of approximately 4.5% during the forecast period. This growth is underpinned by significant investments in research and development by leading pharmaceutical companies, aimed at discovering and commercializing next-generation coagulant therapies. The expanding global healthcare infrastructure, particularly in emerging economies, is also contributing to increased market penetration and access to advanced treatments.
Dominant Regions, Countries, or Segments in Blood Coagulants
North America currently holds a dominant position in the global blood coagulants market, driven by its advanced healthcare infrastructure, high prevalence of bleeding disorders, and substantial investment in research and development. The United States, in particular, is a key contributor, with a well-established reimbursement system and a strong presence of leading pharmaceutical companies like Pfizer and Bayer.
Dominant Segment: Recombinant Coagulation Factor
The Recombinant Coagulation Factor segment is the primary growth engine within the blood coagulants market. This segment's dominance is attributable to several factors:
- Enhanced Safety and Efficacy: Recombinant factors offer a significantly lower risk of pathogen transmission compared to plasma-derived products, leading to their preferential use.
- Technological Advancements: Continuous innovation in recombinant DNA technology allows for the development of more effective and longer-acting coagulation factors, improving patient outcomes and reducing dosing frequency.
- Growing Demand for Personalized Medicine: The ability to produce highly purified and specific recombinant factors aligns with the trend towards personalized treatment approaches for bleeding disorders.
- Market Share and Growth Potential: This segment is projected to account for a substantial market share, estimated to reach over USD 25,000 million by 2033, with a CAGR exceeding 5%.
Key Drivers in Dominant Segments:
- Healthcare Expenditure: High per capita healthcare spending in North America and Europe supports the adoption of expensive recombinant therapies.
- Prevalence of Bleeding Disorders: A higher incidence of hemophilia, von Willebrand disease, and other clotting factor deficiencies in developed nations fuels demand.
- Government Initiatives and Reimbursement Policies: Favorable reimbursement policies and government support for rare disease treatments encourage market growth.
- Technological Sophistication: The presence of a robust research ecosystem and advanced manufacturing capabilities enables the production of complex recombinant proteins.
While North America leads, Europe is another significant market, characterized by a strong regulatory environment and a focus on patient access to innovative treatments. The Asia-Pacific region is emerging as a high-growth area, driven by increasing healthcare expenditure, a rising middle class, and growing awareness of bleeding disorders, with countries like China and India showing considerable potential. The "Hospital" application segment is the largest contributor due to in-patient treatments and surgical procedures requiring coagulant therapies.
Blood Coagulants Product Landscape
The blood coagulants product landscape is continually evolving with a strong emphasis on recombinant technologies and innovative formulations. Key products include recombinant Factor VIII (rFVIII), recombinant Factor IX (rFIX), and von Willebrand factor (vWF) for hemophilia A and B, respectively. Newer generation products are focusing on extended half-life formulations, reducing the frequency of infusions and improving patient compliance. Advances in gene therapy are also emerging as a transformative application, offering the potential for long-term treatment of genetic bleeding disorders. The performance metrics of these products are increasingly measured by their efficacy in preventing bleeds, their safety profiles, and their impact on patient quality of life.
Key Drivers, Barriers & Challenges in Blood Coagulants
Key Drivers:
- Rising incidence of bleeding disorders: Increased diagnosis rates and improved awareness of hemophilia, von Willebrand disease, and other rare bleeding disorders.
- Technological advancements in recombinant therapies: Development of more efficacious and safer recombinant coagulation factors.
- Growing demand for extended half-life (EHL) formulations: Offering improved patient convenience and reduced treatment burden.
- Expansion of healthcare infrastructure in emerging economies: Increasing access to advanced treatments.
Key Barriers & Challenges:
- High cost of treatments: Recombinant therapies and gene therapies are significantly expensive, posing challenges for reimbursement and patient affordability.
- Regulatory hurdles and lengthy approval processes: Stringent regulatory requirements can delay market entry for new products.
- Supply chain complexities and raw material sourcing: Ensuring a consistent and high-quality supply of plasma-derived and recombinant proteins.
- Competition from biosimil and generic alternatives: As patents expire, the market faces pressure from lower-cost alternatives.
- Patient adherence and treatment burden: For some treatments, frequent infusions can still be a challenge for patients.
Emerging Opportunities in Blood Coagulants
Emerging opportunities in the blood coagulants market lie in the development of next-generation gene therapies that offer a potential cure for genetic bleeding disorders, moving beyond symptom management. The untapped market potential in emerging economies, coupled with increasing healthcare investments, presents a significant avenue for growth. Furthermore, innovative drug delivery systems, such as subcutaneous injections for certain recombinant factors, are gaining traction, enhancing patient convenience and reducing the need for intravenous administration. Personalized medicine approaches, tailoring treatments based on individual patient needs and genetic profiles, are also expected to drive innovation.
Growth Accelerators in the Blood Coagulants Industry
Long-term growth in the blood coagulants industry is being significantly accelerated by groundbreaking technological breakthroughs in gene therapy, offering the potential for one-time curative treatments for hemophilia and other inherited bleeding disorders. Strategic partnerships between large pharmaceutical companies and biotechnology firms specializing in gene editing and vector development are crucial for translating these advancements from research to clinical application. Furthermore, ongoing market expansion strategies targeting underserved populations and geographical regions, coupled with the development of novel drug formulations that enhance patient compliance and reduce treatment burden, are key catalysts for sustained growth.
Key Players Shaping the Blood Coagulants Market
- Pfizer
- Bayer
- Novo Nordisk
- Takeda
- SOBI
- Octapharma
- CSL
Notable Milestones in Blood Coagulants Sector
- 2019: Approval of [Specific Recombinant Coagulant Product] with extended half-life properties, enhancing patient convenience.
- 2020: Major pharmaceutical company initiates Phase III clinical trials for a novel gene therapy for Hemophilia B.
- 2021: Significant acquisition of a gene therapy startup by a leading biopharmaceutical firm, signaling increased investment in curative treatments.
- 2022: Launch of a new subcutaneous formulation for a recombinant coagulation factor, improving patient adherence.
- 2023: Emergence of promising early-stage research into novel hemostatic agents derived from extremophiles.
- 2024: Regulatory approval for a biosimilar of a widely used recombinant coagulation factor, potentially impacting market pricing.
In-Depth Blood Coagulants Market Outlook
The future of the blood coagulants market is exceptionally promising, driven by transformative gene therapies that offer the prospect of long-term solutions and even cures for inherited bleeding disorders. The continued innovation in extended half-life formulations will further enhance patient quality of life and reduce healthcare system costs associated with frequent treatments. Strategic collaborations and significant R&D investments are expected to accelerate the development and commercialization of these groundbreaking therapies. Moreover, the expansion into emerging markets presents substantial opportunities for growth, as healthcare access and awareness of bleeding disorders improve. This dynamic environment underscores a period of significant progress and opportunity for stakeholders in the blood coagulants sector.
Blood Coagulants Segmentation
-
1. Application
- 1.1. Hospital
- 1.2. Pharmacy
- 1.3. Other
-
2. Types
- 2.1. Recombinant Coagulation Factor
- 2.2. Plasma Coagulation Factor
Blood Coagulants Segmentation By Geography
-
1. North America
- 1.1. United States
- 1.2. Canada
- 1.3. Mexico
-
2. South America
- 2.1. Brazil
- 2.2. Argentina
- 2.3. Rest of South America
-
3. Europe
- 3.1. United Kingdom
- 3.2. Germany
- 3.3. France
- 3.4. Italy
- 3.5. Spain
- 3.6. Russia
- 3.7. Benelux
- 3.8. Nordics
- 3.9. Rest of Europe
-
4. Middle East & Africa
- 4.1. Turkey
- 4.2. Israel
- 4.3. GCC
- 4.4. North Africa
- 4.5. South Africa
- 4.6. Rest of Middle East & Africa
-
5. Asia Pacific
- 5.1. China
- 5.2. India
- 5.3. Japan
- 5.4. South Korea
- 5.5. ASEAN
- 5.6. Oceania
- 5.7. Rest of Asia Pacific
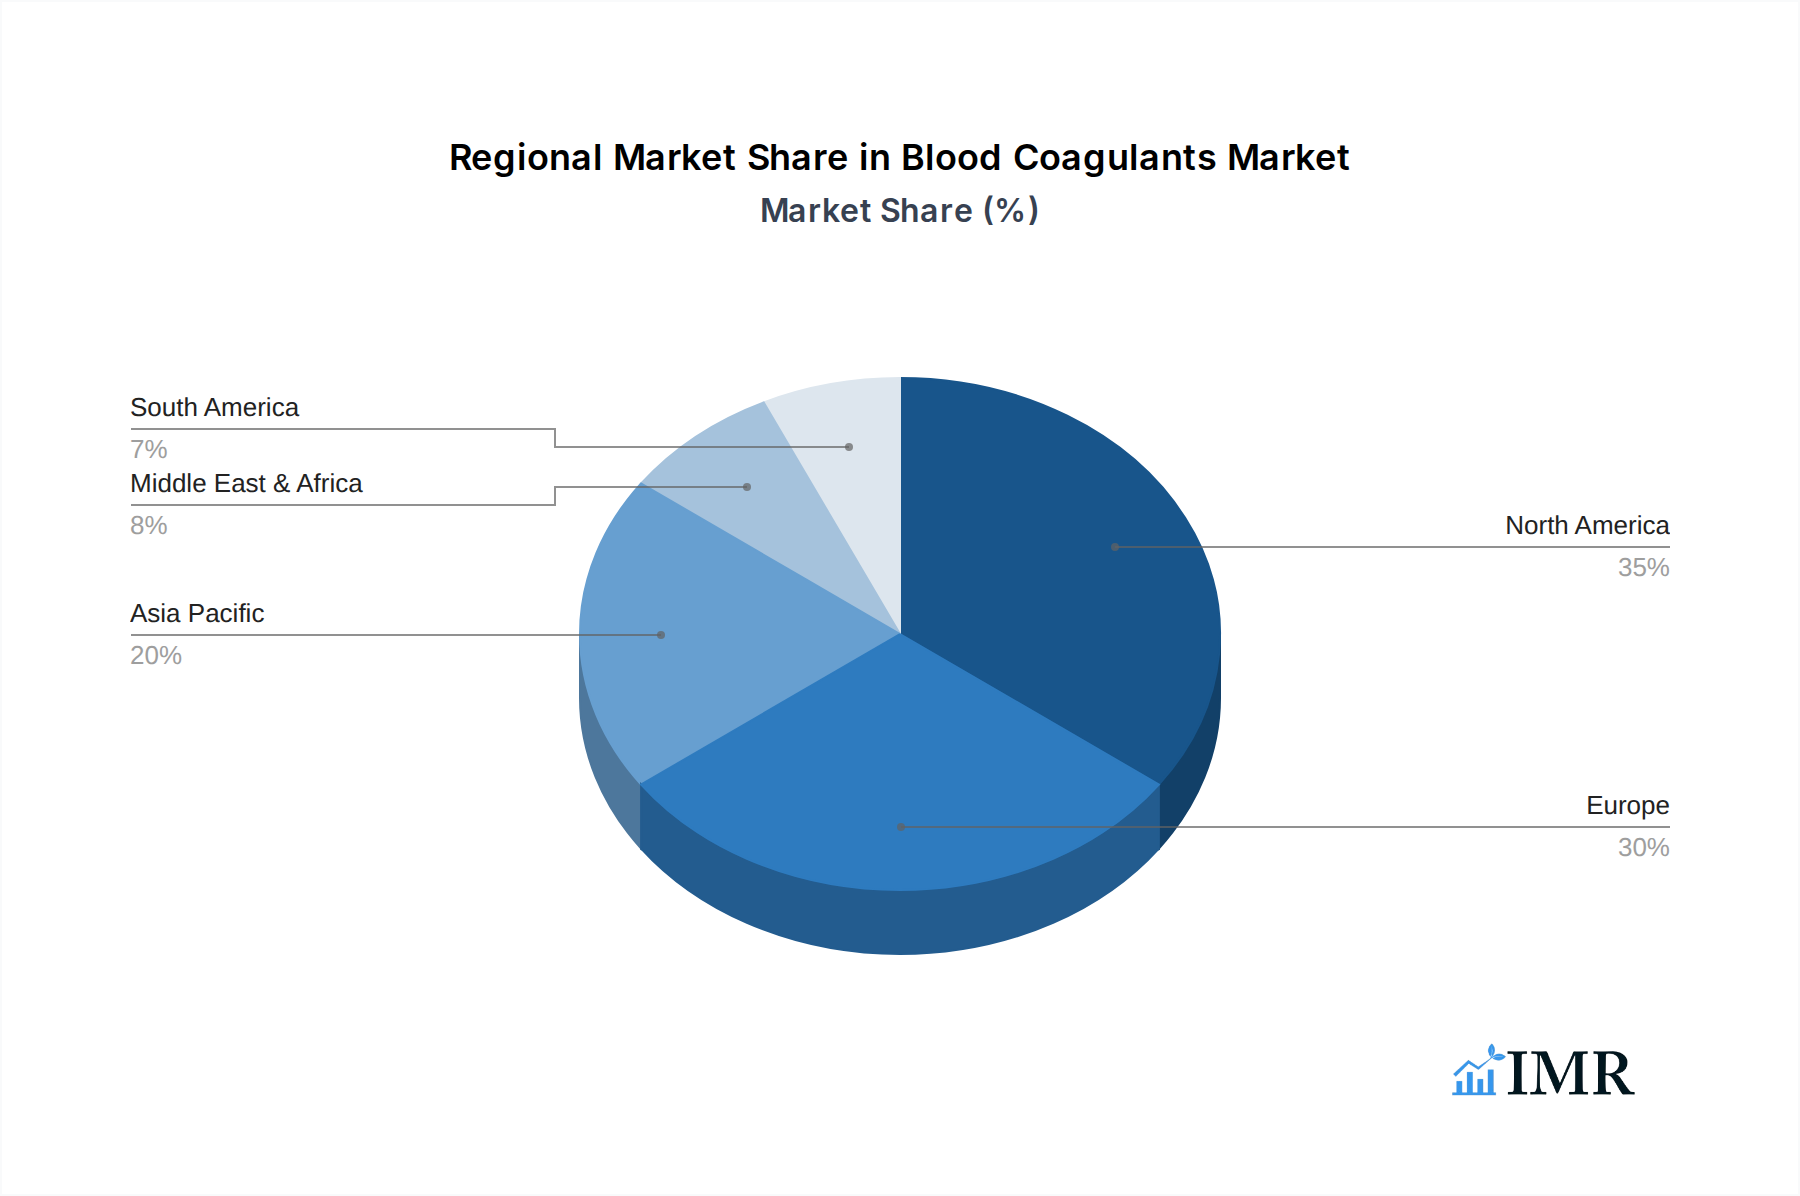
Blood Coagulants Regional Market Share
Geographic Coverage of Blood Coagulants
Blood Coagulants REPORT HIGHLIGHTS
| Aspects | Details |
|---|---|
| Study Period | 2020-2034 |
| Base Year | 2025 |
| Estimated Year | 2026 |
| Forecast Period | 2026-2034 |
| Historical Period | 2020-2025 |
| Growth Rate | CAGR of 6.7% from 2020-2034 |
| Segmentation |
|
Table of Contents
- 1. Introduction
- 1.1. Research Scope
- 1.2. Market Segmentation
- 1.3. Research Methodology
- 1.4. Definitions and Assumptions
- 2. Executive Summary
- 2.1. Introduction
- 3. Market Dynamics
- 3.1. Introduction
- 3.2. Market Drivers
- 3.3. Market Restrains
- 3.4. Market Trends
- 4. Market Factor Analysis
- 4.1. Porters Five Forces
- 4.2. Supply/Value Chain
- 4.3. PESTEL analysis
- 4.4. Market Entropy
- 4.5. Patent/Trademark Analysis
- 5. Global Blood Coagulants Analysis, Insights and Forecast, 2020-2032
- 5.1. Market Analysis, Insights and Forecast - by Application
- 5.1.1. Hospital
- 5.1.2. Pharmacy
- 5.1.3. Other
- 5.2. Market Analysis, Insights and Forecast - by Types
- 5.2.1. Recombinant Coagulation Factor
- 5.2.2. Plasma Coagulation Factor
- 5.3. Market Analysis, Insights and Forecast - by Region
- 5.3.1. North America
- 5.3.2. South America
- 5.3.3. Europe
- 5.3.4. Middle East & Africa
- 5.3.5. Asia Pacific
- 5.1. Market Analysis, Insights and Forecast - by Application
- 6. North America Blood Coagulants Analysis, Insights and Forecast, 2020-2032
- 6.1. Market Analysis, Insights and Forecast - by Application
- 6.1.1. Hospital
- 6.1.2. Pharmacy
- 6.1.3. Other
- 6.2. Market Analysis, Insights and Forecast - by Types
- 6.2.1. Recombinant Coagulation Factor
- 6.2.2. Plasma Coagulation Factor
- 6.1. Market Analysis, Insights and Forecast - by Application
- 7. South America Blood Coagulants Analysis, Insights and Forecast, 2020-2032
- 7.1. Market Analysis, Insights and Forecast - by Application
- 7.1.1. Hospital
- 7.1.2. Pharmacy
- 7.1.3. Other
- 7.2. Market Analysis, Insights and Forecast - by Types
- 7.2.1. Recombinant Coagulation Factor
- 7.2.2. Plasma Coagulation Factor
- 7.1. Market Analysis, Insights and Forecast - by Application
- 8. Europe Blood Coagulants Analysis, Insights and Forecast, 2020-2032
- 8.1. Market Analysis, Insights and Forecast - by Application
- 8.1.1. Hospital
- 8.1.2. Pharmacy
- 8.1.3. Other
- 8.2. Market Analysis, Insights and Forecast - by Types
- 8.2.1. Recombinant Coagulation Factor
- 8.2.2. Plasma Coagulation Factor
- 8.1. Market Analysis, Insights and Forecast - by Application
- 9. Middle East & Africa Blood Coagulants Analysis, Insights and Forecast, 2020-2032
- 9.1. Market Analysis, Insights and Forecast - by Application
- 9.1.1. Hospital
- 9.1.2. Pharmacy
- 9.1.3. Other
- 9.2. Market Analysis, Insights and Forecast - by Types
- 9.2.1. Recombinant Coagulation Factor
- 9.2.2. Plasma Coagulation Factor
- 9.1. Market Analysis, Insights and Forecast - by Application
- 10. Asia Pacific Blood Coagulants Analysis, Insights and Forecast, 2020-2032
- 10.1. Market Analysis, Insights and Forecast - by Application
- 10.1.1. Hospital
- 10.1.2. Pharmacy
- 10.1.3. Other
- 10.2. Market Analysis, Insights and Forecast - by Types
- 10.2.1. Recombinant Coagulation Factor
- 10.2.2. Plasma Coagulation Factor
- 10.1. Market Analysis, Insights and Forecast - by Application
- 11. Competitive Analysis
- 11.1. Global Market Share Analysis 2025
- 11.2. Company Profiles
- 11.2.1 Pfizer
- 11.2.1.1. Overview
- 11.2.1.2. Products
- 11.2.1.3. SWOT Analysis
- 11.2.1.4. Recent Developments
- 11.2.1.5. Financials (Based on Availability)
- 11.2.2 Bayer
- 11.2.2.1. Overview
- 11.2.2.2. Products
- 11.2.2.3. SWOT Analysis
- 11.2.2.4. Recent Developments
- 11.2.2.5. Financials (Based on Availability)
- 11.2.3 Novo Nordisk
- 11.2.3.1. Overview
- 11.2.3.2. Products
- 11.2.3.3. SWOT Analysis
- 11.2.3.4. Recent Developments
- 11.2.3.5. Financials (Based on Availability)
- 11.2.4 Takeda
- 11.2.4.1. Overview
- 11.2.4.2. Products
- 11.2.4.3. SWOT Analysis
- 11.2.4.4. Recent Developments
- 11.2.4.5. Financials (Based on Availability)
- 11.2.5 SOBI
- 11.2.5.1. Overview
- 11.2.5.2. Products
- 11.2.5.3. SWOT Analysis
- 11.2.5.4. Recent Developments
- 11.2.5.5. Financials (Based on Availability)
- 11.2.6 Octapharma
- 11.2.6.1. Overview
- 11.2.6.2. Products
- 11.2.6.3. SWOT Analysis
- 11.2.6.4. Recent Developments
- 11.2.6.5. Financials (Based on Availability)
- 11.2.7 CSL
- 11.2.7.1. Overview
- 11.2.7.2. Products
- 11.2.7.3. SWOT Analysis
- 11.2.7.4. Recent Developments
- 11.2.7.5. Financials (Based on Availability)
- 11.2.1 Pfizer
List of Figures
- Figure 1: Global Blood Coagulants Revenue Breakdown (undefined, %) by Region 2025 & 2033
- Figure 2: Global Blood Coagulants Volume Breakdown (K, %) by Region 2025 & 2033
- Figure 3: North America Blood Coagulants Revenue (undefined), by Application 2025 & 2033
- Figure 4: North America Blood Coagulants Volume (K), by Application 2025 & 2033
- Figure 5: North America Blood Coagulants Revenue Share (%), by Application 2025 & 2033
- Figure 6: North America Blood Coagulants Volume Share (%), by Application 2025 & 2033
- Figure 7: North America Blood Coagulants Revenue (undefined), by Types 2025 & 2033
- Figure 8: North America Blood Coagulants Volume (K), by Types 2025 & 2033
- Figure 9: North America Blood Coagulants Revenue Share (%), by Types 2025 & 2033
- Figure 10: North America Blood Coagulants Volume Share (%), by Types 2025 & 2033
- Figure 11: North America Blood Coagulants Revenue (undefined), by Country 2025 & 2033
- Figure 12: North America Blood Coagulants Volume (K), by Country 2025 & 2033
- Figure 13: North America Blood Coagulants Revenue Share (%), by Country 2025 & 2033
- Figure 14: North America Blood Coagulants Volume Share (%), by Country 2025 & 2033
- Figure 15: South America Blood Coagulants Revenue (undefined), by Application 2025 & 2033
- Figure 16: South America Blood Coagulants Volume (K), by Application 2025 & 2033
- Figure 17: South America Blood Coagulants Revenue Share (%), by Application 2025 & 2033
- Figure 18: South America Blood Coagulants Volume Share (%), by Application 2025 & 2033
- Figure 19: South America Blood Coagulants Revenue (undefined), by Types 2025 & 2033
- Figure 20: South America Blood Coagulants Volume (K), by Types 2025 & 2033
- Figure 21: South America Blood Coagulants Revenue Share (%), by Types 2025 & 2033
- Figure 22: South America Blood Coagulants Volume Share (%), by Types 2025 & 2033
- Figure 23: South America Blood Coagulants Revenue (undefined), by Country 2025 & 2033
- Figure 24: South America Blood Coagulants Volume (K), by Country 2025 & 2033
- Figure 25: South America Blood Coagulants Revenue Share (%), by Country 2025 & 2033
- Figure 26: South America Blood Coagulants Volume Share (%), by Country 2025 & 2033
- Figure 27: Europe Blood Coagulants Revenue (undefined), by Application 2025 & 2033
- Figure 28: Europe Blood Coagulants Volume (K), by Application 2025 & 2033
- Figure 29: Europe Blood Coagulants Revenue Share (%), by Application 2025 & 2033
- Figure 30: Europe Blood Coagulants Volume Share (%), by Application 2025 & 2033
- Figure 31: Europe Blood Coagulants Revenue (undefined), by Types 2025 & 2033
- Figure 32: Europe Blood Coagulants Volume (K), by Types 2025 & 2033
- Figure 33: Europe Blood Coagulants Revenue Share (%), by Types 2025 & 2033
- Figure 34: Europe Blood Coagulants Volume Share (%), by Types 2025 & 2033
- Figure 35: Europe Blood Coagulants Revenue (undefined), by Country 2025 & 2033
- Figure 36: Europe Blood Coagulants Volume (K), by Country 2025 & 2033
- Figure 37: Europe Blood Coagulants Revenue Share (%), by Country 2025 & 2033
- Figure 38: Europe Blood Coagulants Volume Share (%), by Country 2025 & 2033
- Figure 39: Middle East & Africa Blood Coagulants Revenue (undefined), by Application 2025 & 2033
- Figure 40: Middle East & Africa Blood Coagulants Volume (K), by Application 2025 & 2033
- Figure 41: Middle East & Africa Blood Coagulants Revenue Share (%), by Application 2025 & 2033
- Figure 42: Middle East & Africa Blood Coagulants Volume Share (%), by Application 2025 & 2033
- Figure 43: Middle East & Africa Blood Coagulants Revenue (undefined), by Types 2025 & 2033
- Figure 44: Middle East & Africa Blood Coagulants Volume (K), by Types 2025 & 2033
- Figure 45: Middle East & Africa Blood Coagulants Revenue Share (%), by Types 2025 & 2033
- Figure 46: Middle East & Africa Blood Coagulants Volume Share (%), by Types 2025 & 2033
- Figure 47: Middle East & Africa Blood Coagulants Revenue (undefined), by Country 2025 & 2033
- Figure 48: Middle East & Africa Blood Coagulants Volume (K), by Country 2025 & 2033
- Figure 49: Middle East & Africa Blood Coagulants Revenue Share (%), by Country 2025 & 2033
- Figure 50: Middle East & Africa Blood Coagulants Volume Share (%), by Country 2025 & 2033
- Figure 51: Asia Pacific Blood Coagulants Revenue (undefined), by Application 2025 & 2033
- Figure 52: Asia Pacific Blood Coagulants Volume (K), by Application 2025 & 2033
- Figure 53: Asia Pacific Blood Coagulants Revenue Share (%), by Application 2025 & 2033
- Figure 54: Asia Pacific Blood Coagulants Volume Share (%), by Application 2025 & 2033
- Figure 55: Asia Pacific Blood Coagulants Revenue (undefined), by Types 2025 & 2033
- Figure 56: Asia Pacific Blood Coagulants Volume (K), by Types 2025 & 2033
- Figure 57: Asia Pacific Blood Coagulants Revenue Share (%), by Types 2025 & 2033
- Figure 58: Asia Pacific Blood Coagulants Volume Share (%), by Types 2025 & 2033
- Figure 59: Asia Pacific Blood Coagulants Revenue (undefined), by Country 2025 & 2033
- Figure 60: Asia Pacific Blood Coagulants Volume (K), by Country 2025 & 2033
- Figure 61: Asia Pacific Blood Coagulants Revenue Share (%), by Country 2025 & 2033
- Figure 62: Asia Pacific Blood Coagulants Volume Share (%), by Country 2025 & 2033
List of Tables
- Table 1: Global Blood Coagulants Revenue undefined Forecast, by Application 2020 & 2033
- Table 2: Global Blood Coagulants Volume K Forecast, by Application 2020 & 2033
- Table 3: Global Blood Coagulants Revenue undefined Forecast, by Types 2020 & 2033
- Table 4: Global Blood Coagulants Volume K Forecast, by Types 2020 & 2033
- Table 5: Global Blood Coagulants Revenue undefined Forecast, by Region 2020 & 2033
- Table 6: Global Blood Coagulants Volume K Forecast, by Region 2020 & 2033
- Table 7: Global Blood Coagulants Revenue undefined Forecast, by Application 2020 & 2033
- Table 8: Global Blood Coagulants Volume K Forecast, by Application 2020 & 2033
- Table 9: Global Blood Coagulants Revenue undefined Forecast, by Types 2020 & 2033
- Table 10: Global Blood Coagulants Volume K Forecast, by Types 2020 & 2033
- Table 11: Global Blood Coagulants Revenue undefined Forecast, by Country 2020 & 2033
- Table 12: Global Blood Coagulants Volume K Forecast, by Country 2020 & 2033
- Table 13: United States Blood Coagulants Revenue (undefined) Forecast, by Application 2020 & 2033
- Table 14: United States Blood Coagulants Volume (K) Forecast, by Application 2020 & 2033
- Table 15: Canada Blood Coagulants Revenue (undefined) Forecast, by Application 2020 & 2033
- Table 16: Canada Blood Coagulants Volume (K) Forecast, by Application 2020 & 2033
- Table 17: Mexico Blood Coagulants Revenue (undefined) Forecast, by Application 2020 & 2033
- Table 18: Mexico Blood Coagulants Volume (K) Forecast, by Application 2020 & 2033
- Table 19: Global Blood Coagulants Revenue undefined Forecast, by Application 2020 & 2033
- Table 20: Global Blood Coagulants Volume K Forecast, by Application 2020 & 2033
- Table 21: Global Blood Coagulants Revenue undefined Forecast, by Types 2020 & 2033
- Table 22: Global Blood Coagulants Volume K Forecast, by Types 2020 & 2033
- Table 23: Global Blood Coagulants Revenue undefined Forecast, by Country 2020 & 2033
- Table 24: Global Blood Coagulants Volume K Forecast, by Country 2020 & 2033
- Table 25: Brazil Blood Coagulants Revenue (undefined) Forecast, by Application 2020 & 2033
- Table 26: Brazil Blood Coagulants Volume (K) Forecast, by Application 2020 & 2033
- Table 27: Argentina Blood Coagulants Revenue (undefined) Forecast, by Application 2020 & 2033
- Table 28: Argentina Blood Coagulants Volume (K) Forecast, by Application 2020 & 2033
- Table 29: Rest of South America Blood Coagulants Revenue (undefined) Forecast, by Application 2020 & 2033
- Table 30: Rest of South America Blood Coagulants Volume (K) Forecast, by Application 2020 & 2033
- Table 31: Global Blood Coagulants Revenue undefined Forecast, by Application 2020 & 2033
- Table 32: Global Blood Coagulants Volume K Forecast, by Application 2020 & 2033
- Table 33: Global Blood Coagulants Revenue undefined Forecast, by Types 2020 & 2033
- Table 34: Global Blood Coagulants Volume K Forecast, by Types 2020 & 2033
- Table 35: Global Blood Coagulants Revenue undefined Forecast, by Country 2020 & 2033
- Table 36: Global Blood Coagulants Volume K Forecast, by Country 2020 & 2033
- Table 37: United Kingdom Blood Coagulants Revenue (undefined) Forecast, by Application 2020 & 2033
- Table 38: United Kingdom Blood Coagulants Volume (K) Forecast, by Application 2020 & 2033
- Table 39: Germany Blood Coagulants Revenue (undefined) Forecast, by Application 2020 & 2033
- Table 40: Germany Blood Coagulants Volume (K) Forecast, by Application 2020 & 2033
- Table 41: France Blood Coagulants Revenue (undefined) Forecast, by Application 2020 & 2033
- Table 42: France Blood Coagulants Volume (K) Forecast, by Application 2020 & 2033
- Table 43: Italy Blood Coagulants Revenue (undefined) Forecast, by Application 2020 & 2033
- Table 44: Italy Blood Coagulants Volume (K) Forecast, by Application 2020 & 2033
- Table 45: Spain Blood Coagulants Revenue (undefined) Forecast, by Application 2020 & 2033
- Table 46: Spain Blood Coagulants Volume (K) Forecast, by Application 2020 & 2033
- Table 47: Russia Blood Coagulants Revenue (undefined) Forecast, by Application 2020 & 2033
- Table 48: Russia Blood Coagulants Volume (K) Forecast, by Application 2020 & 2033
- Table 49: Benelux Blood Coagulants Revenue (undefined) Forecast, by Application 2020 & 2033
- Table 50: Benelux Blood Coagulants Volume (K) Forecast, by Application 2020 & 2033
- Table 51: Nordics Blood Coagulants Revenue (undefined) Forecast, by Application 2020 & 2033
- Table 52: Nordics Blood Coagulants Volume (K) Forecast, by Application 2020 & 2033
- Table 53: Rest of Europe Blood Coagulants Revenue (undefined) Forecast, by Application 2020 & 2033
- Table 54: Rest of Europe Blood Coagulants Volume (K) Forecast, by Application 2020 & 2033
- Table 55: Global Blood Coagulants Revenue undefined Forecast, by Application 2020 & 2033
- Table 56: Global Blood Coagulants Volume K Forecast, by Application 2020 & 2033
- Table 57: Global Blood Coagulants Revenue undefined Forecast, by Types 2020 & 2033
- Table 58: Global Blood Coagulants Volume K Forecast, by Types 2020 & 2033
- Table 59: Global Blood Coagulants Revenue undefined Forecast, by Country 2020 & 2033
- Table 60: Global Blood Coagulants Volume K Forecast, by Country 2020 & 2033
- Table 61: Turkey Blood Coagulants Revenue (undefined) Forecast, by Application 2020 & 2033
- Table 62: Turkey Blood Coagulants Volume (K) Forecast, by Application 2020 & 2033
- Table 63: Israel Blood Coagulants Revenue (undefined) Forecast, by Application 2020 & 2033
- Table 64: Israel Blood Coagulants Volume (K) Forecast, by Application 2020 & 2033
- Table 65: GCC Blood Coagulants Revenue (undefined) Forecast, by Application 2020 & 2033
- Table 66: GCC Blood Coagulants Volume (K) Forecast, by Application 2020 & 2033
- Table 67: North Africa Blood Coagulants Revenue (undefined) Forecast, by Application 2020 & 2033
- Table 68: North Africa Blood Coagulants Volume (K) Forecast, by Application 2020 & 2033
- Table 69: South Africa Blood Coagulants Revenue (undefined) Forecast, by Application 2020 & 2033
- Table 70: South Africa Blood Coagulants Volume (K) Forecast, by Application 2020 & 2033
- Table 71: Rest of Middle East & Africa Blood Coagulants Revenue (undefined) Forecast, by Application 2020 & 2033
- Table 72: Rest of Middle East & Africa Blood Coagulants Volume (K) Forecast, by Application 2020 & 2033
- Table 73: Global Blood Coagulants Revenue undefined Forecast, by Application 2020 & 2033
- Table 74: Global Blood Coagulants Volume K Forecast, by Application 2020 & 2033
- Table 75: Global Blood Coagulants Revenue undefined Forecast, by Types 2020 & 2033
- Table 76: Global Blood Coagulants Volume K Forecast, by Types 2020 & 2033
- Table 77: Global Blood Coagulants Revenue undefined Forecast, by Country 2020 & 2033
- Table 78: Global Blood Coagulants Volume K Forecast, by Country 2020 & 2033
- Table 79: China Blood Coagulants Revenue (undefined) Forecast, by Application 2020 & 2033
- Table 80: China Blood Coagulants Volume (K) Forecast, by Application 2020 & 2033
- Table 81: India Blood Coagulants Revenue (undefined) Forecast, by Application 2020 & 2033
- Table 82: India Blood Coagulants Volume (K) Forecast, by Application 2020 & 2033
- Table 83: Japan Blood Coagulants Revenue (undefined) Forecast, by Application 2020 & 2033
- Table 84: Japan Blood Coagulants Volume (K) Forecast, by Application 2020 & 2033
- Table 85: South Korea Blood Coagulants Revenue (undefined) Forecast, by Application 2020 & 2033
- Table 86: South Korea Blood Coagulants Volume (K) Forecast, by Application 2020 & 2033
- Table 87: ASEAN Blood Coagulants Revenue (undefined) Forecast, by Application 2020 & 2033
- Table 88: ASEAN Blood Coagulants Volume (K) Forecast, by Application 2020 & 2033
- Table 89: Oceania Blood Coagulants Revenue (undefined) Forecast, by Application 2020 & 2033
- Table 90: Oceania Blood Coagulants Volume (K) Forecast, by Application 2020 & 2033
- Table 91: Rest of Asia Pacific Blood Coagulants Revenue (undefined) Forecast, by Application 2020 & 2033
- Table 92: Rest of Asia Pacific Blood Coagulants Volume (K) Forecast, by Application 2020 & 2033
Frequently Asked Questions
1. What is the projected Compound Annual Growth Rate (CAGR) of the Blood Coagulants?
The projected CAGR is approximately 6.7%.
2. Which companies are prominent players in the Blood Coagulants?
Key companies in the market include Pfizer, Bayer, Novo Nordisk, Takeda, SOBI, Octapharma, CSL.
3. What are the main segments of the Blood Coagulants?
The market segments include Application, Types.
4. Can you provide details about the market size?
The market size is estimated to be USD XXX N/A as of 2022.
5. What are some drivers contributing to market growth?
N/A
6. What are the notable trends driving market growth?
N/A
7. Are there any restraints impacting market growth?
N/A
8. Can you provide examples of recent developments in the market?
N/A
9. What pricing options are available for accessing the report?
Pricing options include single-user, multi-user, and enterprise licenses priced at USD 3350.00, USD 5025.00, and USD 6700.00 respectively.
10. Is the market size provided in terms of value or volume?
The market size is provided in terms of value, measured in N/A and volume, measured in K.
11. Are there any specific market keywords associated with the report?
Yes, the market keyword associated with the report is "Blood Coagulants," which aids in identifying and referencing the specific market segment covered.
12. How do I determine which pricing option suits my needs best?
The pricing options vary based on user requirements and access needs. Individual users may opt for single-user licenses, while businesses requiring broader access may choose multi-user or enterprise licenses for cost-effective access to the report.
13. Are there any additional resources or data provided in the Blood Coagulants report?
While the report offers comprehensive insights, it's advisable to review the specific contents or supplementary materials provided to ascertain if additional resources or data are available.
14. How can I stay updated on further developments or reports in the Blood Coagulants?
To stay informed about further developments, trends, and reports in the Blood Coagulants, consider subscribing to industry newsletters, following relevant companies and organizations, or regularly checking reputable industry news sources and publications.
Methodology
Step 1 - Identification of Relevant Samples Size from Population Database


Step 2 - Approaches for Defining Global Market Size (Value, Volume* & Price*)

Note*: In applicable scenarios
Step 3 - Data Sources
Primary Research
- Web Analytics
- Survey Reports
- Research Institute
- Latest Research Reports
- Opinion Leaders
Secondary Research
- Annual Reports
- White Paper
- Latest Press Release
- Industry Association
- Paid Database
- Investor Presentations

Step 4 - Data Triangulation
Involves using different sources of information in order to increase the validity of a study
These sources are likely to be stakeholders in a program - participants, other researchers, program staff, other community members, and so on.
Then we put all data in single framework & apply various statistical tools to find out the dynamic on the market.
During the analysis stage, feedback from the stakeholder groups would be compared to determine areas of agreement as well as areas of divergence