

Key Insights
The global bulletproof glass market, valued at $10.83 billion in the base year 2025, is projected for substantial expansion. Driven by a compelling CAGR of 11.78%, the market is anticipated to surpass significant valuation by 2033. This robust growth is primarily attributed to escalating security imperatives across critical sectors including automotive, construction, and defense. Key demand drivers include enhanced vehicle security features within the automotive industry, accelerated infrastructure development, and substantial investments in defense modernization initiatives globally. Advancements in manufacturing technologies, yielding lighter, stronger, and more transparent materials such as polycarbonate and glass-clad polycarbonate, are further catalyzing market ascent. The Asia Pacific region, spearheaded by China and India, is poised for market leadership, propelled by rapid urbanization, industrialization, and expanding automotive sectors. Conversely, elevated production costs and the availability of substitute security solutions may present market growth limitations. The market is segmented by type (solid acrylic, traditional laminated, polycarbonate, glass-clad polycarbonate, and others) and end-user industry (automotive, buildings and construction, defense, and others). While traditional laminated glass maintains a significant market share, demand for advanced alternatives like polycarbonate is experiencing rapid growth.
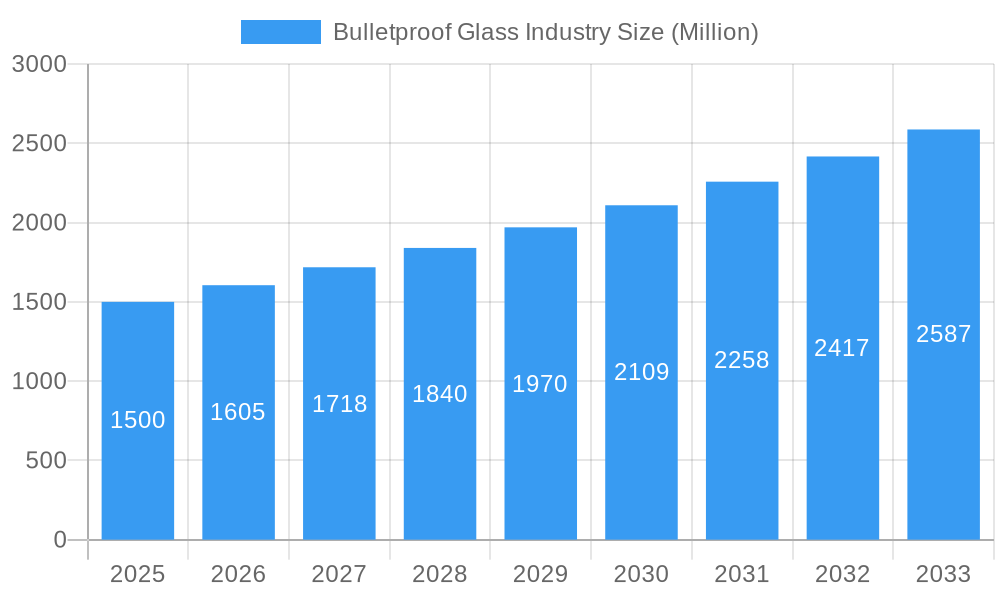
Bulletproof Glass Industry Market Size (In Billion)
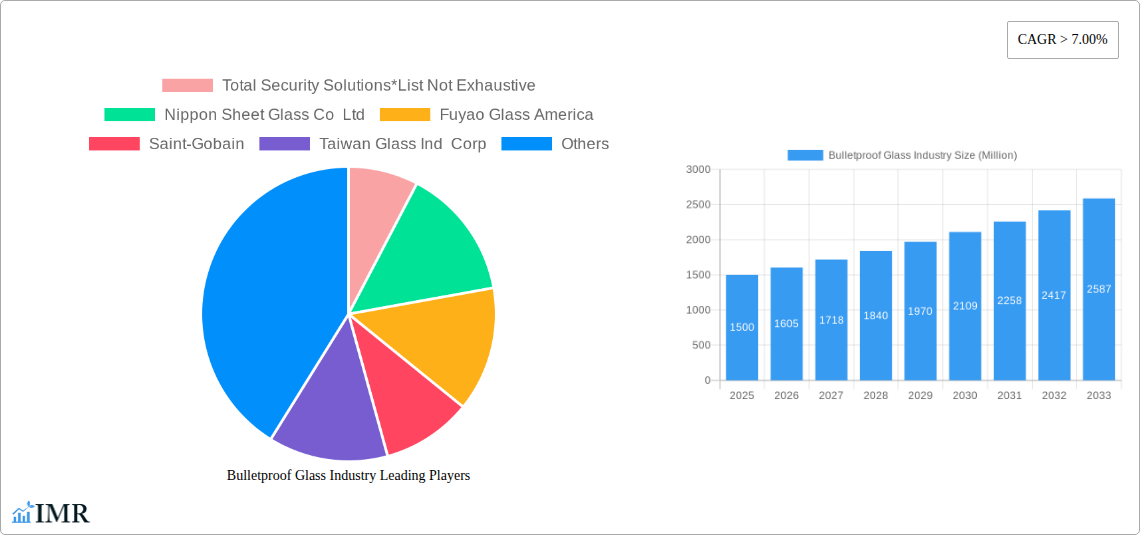
The competitive landscape features a dynamic interplay between established global entities and agile regional manufacturers. Prominent players such as Saint-Gobain, Nippon Sheet Glass Co Ltd, and Fuyao Glass America command significant market presence, leveraging extensive distribution networks and technological prowess. Regional manufacturers are increasingly influential, particularly in emerging economies, offering competitive pricing and tailored local solutions. Future market trajectory will be shaped by evolving government security regulations, continuous innovation in glass manufacturing, and the widespread adoption of integrated advanced security systems. Heightened geopolitical instability and an increase in security threats are expected to further stimulate demand for superior bulletproof glass solutions. A comprehensive understanding of these market dynamics is imperative for stakeholders aiming to capitalize on this lucrative and expanding sector.
Bulletproof Glass Industry Company Market Share
Bulletproof Glass Industry Market Report: 2019-2033
This comprehensive report provides a detailed analysis of the global bulletproof glass market, encompassing market size, growth trends, competitive landscape, and future outlook. Focusing on both the parent market (Security & Safety Products) and the child market (Protective Glass), this report delivers crucial insights for industry professionals, investors, and strategic decision-makers. The study period covers 2019-2033, with a base year of 2025 and a forecast period of 2025-2033.
Bulletproof Glass Industry Market Dynamics & Structure
The bulletproof glass market is characterized by a moderately concentrated landscape, with key players such as Total Security Solutions*, Nippon Sheet Glass Co Ltd, Fuyao Glass America, Saint-Gobain, and others holding significant market share. The market's dynamics are shaped by several factors:
- Technological Innovation: Ongoing R&D in materials science drives advancements in lighter, stronger, and more transparent bulletproof glass, expanding applications. Innovation barriers include high R&D costs and stringent safety testing requirements.
- Regulatory Frameworks: Government regulations on safety standards and building codes influence demand, particularly in the defense and construction sectors. Stringent regulations, particularly regarding security and transparency, create barriers to entry for smaller players.
- Competitive Product Substitutes: Alternatives like polycarbonate sheets and other advanced composites pose competitive pressure, although bulletproof glass retains a significant advantage in specific high-security applications. Market share for these substitutes sits at approximately xx Million units as of 2024, with a projected growth rate of xx% over the next decade.
- End-User Demographics: Growth is driven by increasing demand from defense, automotive, and building & construction sectors, with a significant influence from rising urban populations and security concerns. The market is predicted to see the most growth in the building and construction sector, accounting for an estimated xx Million units of the market by 2033.
- Mergers & Acquisitions (M&A): Consolidation is evident through recent M&A activity, with deals focused on expanding product portfolios and geographical reach. The number of M&A deals in this sector averaged xx per year between 2019-2024, with a projected increase in the coming years.
Bulletproof Glass Industry Growth Trends & Insights
The global bulletproof glass market exhibited a CAGR of xx% during the historical period (2019-2024), reaching a market size of xx Million units in 2024. This growth is projected to continue, with a forecasted CAGR of xx% during the forecast period (2025-2033), reaching xx Million units by 2033. Market penetration is highest in developed regions due to higher security awareness and spending capacity. Technological disruptions, such as the introduction of advanced composite materials, are driving adoption rates in new applications. Shifting consumer preferences toward enhanced security and increased transparency are also significantly impacting demand.
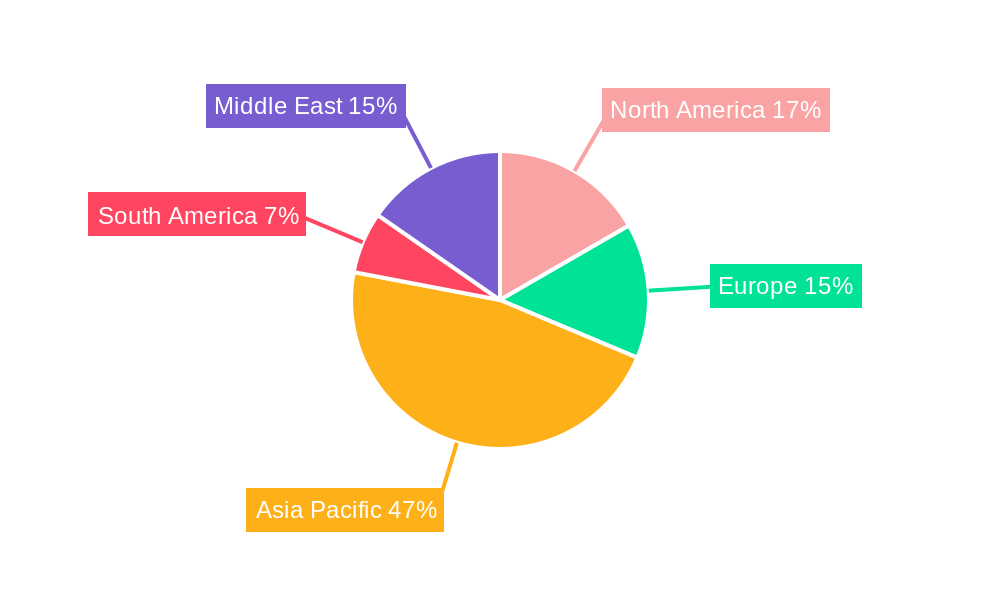
Dominant Regions, Countries, or Segments in Bulletproof Glass Industry
North America and Europe currently dominate the market due to stringent security regulations and higher spending on defense and building infrastructure. However, the Asia-Pacific region is experiencing rapid growth due to increasing urbanization and infrastructure development.
Key Drivers:
- North America: Strong defense spending, advanced construction techniques, and higher security awareness.
- Europe: Stringent building codes, growth in the automotive industry, and government initiatives.
- Asia-Pacific: Rapid urbanization, infrastructure development, and growing investments in defense.
Segment Dominance:
- Type: Traditional laminated glass currently holds the largest market share, owing to its cost-effectiveness and widespread use. However, polycarbonate and glass-clad polycarbonate segments are exhibiting faster growth due to improved properties and application expansion. Solid acrylic holds a smaller niche segment.
- End-user Industry: The building and construction segment is the largest consumer of bulletproof glass, followed by the defense sector, showcasing higher demand compared to the automotive sector.
Bulletproof Glass Industry Product Landscape
The bulletproof glass market offers diverse product types including solid acrylic, traditional laminated, polycarbonate, glass-clad polycarbonate, and other specialized types. These products differ in their material composition, thickness, weight, transparency, and ballistic resistance. Innovation focuses on enhancing impact resistance, optical clarity, and weight reduction through advanced composite materials and manufacturing processes. Unique selling propositions include customizable ballistic ratings, improved aesthetics, and enhanced durability.
Key Drivers, Barriers & Challenges in Bulletproof Glass Industry
Key Drivers:
- Increasing security concerns in various sectors (defense, automotive, commercial buildings).
- Advancements in material science leading to lighter, stronger, and more transparent glass.
- Growing investments in infrastructure and construction globally.
Key Challenges:
- High production costs and raw material prices resulting in high final product cost impacting market penetration especially in developing economies.
- Stringent regulatory compliance requirements leading to higher compliance costs.
- Intense competition from substitute materials (e.g., polycarbonate) reducing market share. Supply chain disruptions, particularly experienced during 2020-2022, are leading to xx% of companies facing production delays, creating higher prices and lower profitability.
Emerging Opportunities in Bulletproof Glass Industry
- Expansion into untapped markets (developing countries with rising infrastructure investment).
- Development of specialized glass for specific applications (e.g., anti-vandal glass for public transport).
- Integration of smart technologies (e.g., sensors, self-healing capabilities) to enhance functionality.
Growth Accelerators in the Bulletproof Glass Industry
Technological advancements in material science and manufacturing processes are significant growth drivers. Strategic partnerships between glass manufacturers and security system integrators are expanding market reach. Government initiatives promoting infrastructure development and security enhancements further fuel market expansion.
Key Players Shaping the Bulletproof Glass Industry Market
- Total Security Solutions*
- Nippon Sheet Glass Co Ltd
- Fuyao Glass America
- Saint-Gobain
- Taiwan Glass Ind Corp
- Armortex
- Centigon Security Group
- Guardian Industries Holdings
- Asahi India Glass Limited
- Armass glass
- STEC ARMOUR GLASS
- Consolidated Glass Holdings Inc
- Binswanger Glass
- Guangdong Golden Glass Technologies Limited
- SCHOTT AG
*List Not Exhaustive
Notable Milestones in Bulletproof Glass Industry Sector
- January 2023: Asahi India Glass Limited collaborated with Enormous Brands to enhance its brand visibility in the doors and windows market. This collaboration is expected to significantly impact the overall market.
- January 2023: Guardian Glass acquired Vortex Glass, expanding its product portfolio and market reach in the residential and commercial construction sectors. This acquisition signals a significant consolidation phase in the market.
In-Depth Bulletproof Glass Industry Market Outlook
The future of the bulletproof glass market appears bright, driven by continuous technological innovation, increasing security concerns, and rising infrastructure investments globally. Strategic partnerships and market expansion into new geographies will further accelerate market growth. The market presents significant opportunities for players focusing on product differentiation, cost optimization, and advanced technological integration. The projected growth suggests a strong potential for increased investment and market consolidation in the coming years.
Bulletproof Glass Industry Segmentation
-
1. Type
- 1.1. Solid Acrylic
- 1.2. Traditional Laminated
- 1.3. Polycarbonate
- 1.4. Glass-clad Polycarbonate
- 1.5. Other Types
-
2. End-user Industry
- 2.1. Automotive
- 2.2. Buildings and Construction
- 2.3. Defense
- 2.4. Other End-user Industries
Bulletproof Glass Industry Segmentation By Geography
-
1. Asia Pacific
- 1.1. China
- 1.2. India
- 1.3. Japan
- 1.4. South Korea
- 1.5. Rest of Asia Pacific
-
2. North America
- 2.1. United States
- 2.2. Canada
- 2.3. Mexico
-
3. Europe
- 3.1. Germany
- 3.2. United Kingdom
- 3.3. France
- 3.4. Italy
- 3.5. Rest of Europe
-
4. South America
- 4.1. Brazil
- 4.2. Argentina
- 4.3. Rest of South America
- 5. Middle East
-
6. Saudi Arabia
- 6.1. South Africa
- 6.2. Rest of Middle East
Bulletproof Glass Industry Regional Market Share
Geographic Coverage of Bulletproof Glass Industry
Bulletproof Glass Industry REPORT HIGHLIGHTS
| Aspects | Details |
|---|---|
| Study Period | 2020-2034 |
| Base Year | 2025 |
| Estimated Year | 2026 |
| Forecast Period | 2026-2034 |
| Historical Period | 2020-2025 |
| Growth Rate | CAGR of 11.78% from 2020-2034 |
| Segmentation |
|
Table of Contents
- 1. Introduction
- 1.1. Research Scope
- 1.2. Market Segmentation
- 1.3. Research Objective
- 1.4. Definitions and Assumptions
- 2. Executive Summary
- 2.1. Market Snapshot
- 3. Market Dynamics
- 3.1. Market Drivers
- 3.2. Market Restrains
- 3.3. Market Trends
- 3.4. Market Opportunities
- 4. Market Factor Analysis
- 4.1. Porters Five Forces
- 4.1.1. Bargaining Power of Suppliers
- 4.1.2. Bargaining Power of Buyers
- 4.1.3. Threat of New Entrants
- 4.1.4. Threat of Substitutes
- 4.1.5. Competitive Rivalry
- 4.2. PESTEL analysis
- 4.3. BCG Analysis
- 4.3.1. Stars (High Growth, High Market Share)
- 4.3.2. Cash Cows (Low Growth, High Market Share)
- 4.3.3. Question Mark (High Growth, Low Market Share)
- 4.3.4. Dogs (Low Growth, Low Market Share)
- 4.4. Ansoff Matrix Analysis
- 4.5. Supply Chain Analysis
- 4.6. Regulatory Landscape
- 4.7. Current Market Potential and Opportunity Assessment (TAM–SAM–SOM Framework)
- 4.8. IMR Analyst Note
- 4.1. Porters Five Forces
- 5. Market Analysis, Insights and Forecast 2021-2033
- 5.1. Market Analysis, Insights and Forecast - by Type
- 5.1.1. Solid Acrylic
- 5.1.2. Traditional Laminated
- 5.1.3. Polycarbonate
- 5.1.4. Glass-clad Polycarbonate
- 5.1.5. Other Types
- 5.2. Market Analysis, Insights and Forecast - by End-user Industry
- 5.2.1. Automotive
- 5.2.2. Buildings and Construction
- 5.2.3. Defense
- 5.2.4. Other End-user Industries
- 5.3. Market Analysis, Insights and Forecast - by Region
- 5.3.1. Asia Pacific
- 5.3.2. North America
- 5.3.3. Europe
- 5.3.4. South America
- 5.3.5. Middle East
- 5.3.6. Saudi Arabia
- 5.1. Market Analysis, Insights and Forecast - by Type
- 6. Global Bulletproof Glass Industry Analysis, Insights and Forecast, 2021-2033
- 6.1. Market Analysis, Insights and Forecast - by Type
- 6.1.1. Solid Acrylic
- 6.1.2. Traditional Laminated
- 6.1.3. Polycarbonate
- 6.1.4. Glass-clad Polycarbonate
- 6.1.5. Other Types
- 6.2. Market Analysis, Insights and Forecast - by End-user Industry
- 6.2.1. Automotive
- 6.2.2. Buildings and Construction
- 6.2.3. Defense
- 6.2.4. Other End-user Industries
- 6.1. Market Analysis, Insights and Forecast - by Type
- 7. Asia Pacific Bulletproof Glass Industry Analysis, Insights and Forecast, 2020-2032
- 7.1. Market Analysis, Insights and Forecast - by Type
- 7.1.1. Solid Acrylic
- 7.1.2. Traditional Laminated
- 7.1.3. Polycarbonate
- 7.1.4. Glass-clad Polycarbonate
- 7.1.5. Other Types
- 7.2. Market Analysis, Insights and Forecast - by End-user Industry
- 7.2.1. Automotive
- 7.2.2. Buildings and Construction
- 7.2.3. Defense
- 7.2.4. Other End-user Industries
- 7.1. Market Analysis, Insights and Forecast - by Type
- 8. North America Bulletproof Glass Industry Analysis, Insights and Forecast, 2020-2032
- 8.1. Market Analysis, Insights and Forecast - by Type
- 8.1.1. Solid Acrylic
- 8.1.2. Traditional Laminated
- 8.1.3. Polycarbonate
- 8.1.4. Glass-clad Polycarbonate
- 8.1.5. Other Types
- 8.2. Market Analysis, Insights and Forecast - by End-user Industry
- 8.2.1. Automotive
- 8.2.2. Buildings and Construction
- 8.2.3. Defense
- 8.2.4. Other End-user Industries
- 8.1. Market Analysis, Insights and Forecast - by Type
- 9. Europe Bulletproof Glass Industry Analysis, Insights and Forecast, 2020-2032
- 9.1. Market Analysis, Insights and Forecast - by Type
- 9.1.1. Solid Acrylic
- 9.1.2. Traditional Laminated
- 9.1.3. Polycarbonate
- 9.1.4. Glass-clad Polycarbonate
- 9.1.5. Other Types
- 9.2. Market Analysis, Insights and Forecast - by End-user Industry
- 9.2.1. Automotive
- 9.2.2. Buildings and Construction
- 9.2.3. Defense
- 9.2.4. Other End-user Industries
- 9.1. Market Analysis, Insights and Forecast - by Type
- 10. South America Bulletproof Glass Industry Analysis, Insights and Forecast, 2020-2032
- 10.1. Market Analysis, Insights and Forecast - by Type
- 10.1.1. Solid Acrylic
- 10.1.2. Traditional Laminated
- 10.1.3. Polycarbonate
- 10.1.4. Glass-clad Polycarbonate
- 10.1.5. Other Types
- 10.2. Market Analysis, Insights and Forecast - by End-user Industry
- 10.2.1. Automotive
- 10.2.2. Buildings and Construction
- 10.2.3. Defense
- 10.2.4. Other End-user Industries
- 10.1. Market Analysis, Insights and Forecast - by Type
- 11. Middle East Bulletproof Glass Industry Analysis, Insights and Forecast, 2020-2032
- 11.1. Market Analysis, Insights and Forecast - by Type
- 11.1.1. Solid Acrylic
- 11.1.2. Traditional Laminated
- 11.1.3. Polycarbonate
- 11.1.4. Glass-clad Polycarbonate
- 11.1.5. Other Types
- 11.2. Market Analysis, Insights and Forecast - by End-user Industry
- 11.2.1. Automotive
- 11.2.2. Buildings and Construction
- 11.2.3. Defense
- 11.2.4. Other End-user Industries
- 11.1. Market Analysis, Insights and Forecast - by Type
- 12. Saudi Arabia Bulletproof Glass Industry Analysis, Insights and Forecast, 2020-2032
- 12.1. Market Analysis, Insights and Forecast - by Type
- 12.1.1. Solid Acrylic
- 12.1.2. Traditional Laminated
- 12.1.3. Polycarbonate
- 12.1.4. Glass-clad Polycarbonate
- 12.1.5. Other Types
- 12.2. Market Analysis, Insights and Forecast - by End-user Industry
- 12.2.1. Automotive
- 12.2.2. Buildings and Construction
- 12.2.3. Defense
- 12.2.4. Other End-user Industries
- 12.1. Market Analysis, Insights and Forecast - by Type
- 13. Competitive Analysis
- 13.1. Company Profiles
- 13.1.1 Total Security Solutions*List Not Exhaustive
- 13.1.1.1. Company Overview
- 13.1.1.2. Products
- 13.1.1.3. Company Financials
- 13.1.1.4. SWOT Analysis
- 13.1.2 Nippon Sheet Glass Co Ltd
- 13.1.2.1. Company Overview
- 13.1.2.2. Products
- 13.1.2.3. Company Financials
- 13.1.2.4. SWOT Analysis
- 13.1.3 Fuyao Glass America
- 13.1.3.1. Company Overview
- 13.1.3.2. Products
- 13.1.3.3. Company Financials
- 13.1.3.4. SWOT Analysis
- 13.1.4 Saint-Gobain
- 13.1.4.1. Company Overview
- 13.1.4.2. Products
- 13.1.4.3. Company Financials
- 13.1.4.4. SWOT Analysis
- 13.1.5 Taiwan Glass Ind Corp
- 13.1.5.1. Company Overview
- 13.1.5.2. Products
- 13.1.5.3. Company Financials
- 13.1.5.4. SWOT Analysis
- 13.1.6 Armortex
- 13.1.6.1. Company Overview
- 13.1.6.2. Products
- 13.1.6.3. Company Financials
- 13.1.6.4. SWOT Analysis
- 13.1.7 Centigon Security Group
- 13.1.7.1. Company Overview
- 13.1.7.2. Products
- 13.1.7.3. Company Financials
- 13.1.7.4. SWOT Analysis
- 13.1.8 Guardian Industries Holdings
- 13.1.8.1. Company Overview
- 13.1.8.2. Products
- 13.1.8.3. Company Financials
- 13.1.8.4. SWOT Analysis
- 13.1.9 Asahi India Glass Limited
- 13.1.9.1. Company Overview
- 13.1.9.2. Products
- 13.1.9.3. Company Financials
- 13.1.9.4. SWOT Analysis
- 13.1.10 Armass glass
- 13.1.10.1. Company Overview
- 13.1.10.2. Products
- 13.1.10.3. Company Financials
- 13.1.10.4. SWOT Analysis
- 13.1.11 STEC ARMOUR GLASS
- 13.1.11.1. Company Overview
- 13.1.11.2. Products
- 13.1.11.3. Company Financials
- 13.1.11.4. SWOT Analysis
- 13.1.12 Consolidated Glass Holdings Inc
- 13.1.12.1. Company Overview
- 13.1.12.2. Products
- 13.1.12.3. Company Financials
- 13.1.12.4. SWOT Analysis
- 13.1.13 Binswanger Glass
- 13.1.13.1. Company Overview
- 13.1.13.2. Products
- 13.1.13.3. Company Financials
- 13.1.13.4. SWOT Analysis
- 13.1.14 Guangdong Golden Glass Technologies Limited
- 13.1.14.1. Company Overview
- 13.1.14.2. Products
- 13.1.14.3. Company Financials
- 13.1.14.4. SWOT Analysis
- 13.1.15 SCHOTT AG
- 13.1.15.1. Company Overview
- 13.1.15.2. Products
- 13.1.15.3. Company Financials
- 13.1.15.4. SWOT Analysis
- 13.1.1 Total Security Solutions*List Not Exhaustive
- 13.2. Market Entropy
- 13.2.1 Company's Key Areas Served
- 13.2.2 Recent Developments
- 13.3. Company Market Share Analysis 2025
- 13.3.1 Top 5 Companies Market Share Analysis
- 13.3.2 Top 3 Companies Market Share Analysis
- 13.4. List of Potential Customers
- 14. Research Methodology
List of Figures
- Figure 1: Global Bulletproof Glass Industry Revenue Breakdown (billion, %) by Region 2025 & 2033
- Figure 2: Asia Pacific Bulletproof Glass Industry Revenue (billion), by Type 2025 & 2033
- Figure 3: Asia Pacific Bulletproof Glass Industry Revenue Share (%), by Type 2025 & 2033
- Figure 4: Asia Pacific Bulletproof Glass Industry Revenue (billion), by End-user Industry 2025 & 2033
- Figure 5: Asia Pacific Bulletproof Glass Industry Revenue Share (%), by End-user Industry 2025 & 2033
- Figure 6: Asia Pacific Bulletproof Glass Industry Revenue (billion), by Country 2025 & 2033
- Figure 7: Asia Pacific Bulletproof Glass Industry Revenue Share (%), by Country 2025 & 2033
- Figure 8: North America Bulletproof Glass Industry Revenue (billion), by Type 2025 & 2033
- Figure 9: North America Bulletproof Glass Industry Revenue Share (%), by Type 2025 & 2033
- Figure 10: North America Bulletproof Glass Industry Revenue (billion), by End-user Industry 2025 & 2033
- Figure 11: North America Bulletproof Glass Industry Revenue Share (%), by End-user Industry 2025 & 2033
- Figure 12: North America Bulletproof Glass Industry Revenue (billion), by Country 2025 & 2033
- Figure 13: North America Bulletproof Glass Industry Revenue Share (%), by Country 2025 & 2033
- Figure 14: Europe Bulletproof Glass Industry Revenue (billion), by Type 2025 & 2033
- Figure 15: Europe Bulletproof Glass Industry Revenue Share (%), by Type 2025 & 2033
- Figure 16: Europe Bulletproof Glass Industry Revenue (billion), by End-user Industry 2025 & 2033
- Figure 17: Europe Bulletproof Glass Industry Revenue Share (%), by End-user Industry 2025 & 2033
- Figure 18: Europe Bulletproof Glass Industry Revenue (billion), by Country 2025 & 2033
- Figure 19: Europe Bulletproof Glass Industry Revenue Share (%), by Country 2025 & 2033
- Figure 20: South America Bulletproof Glass Industry Revenue (billion), by Type 2025 & 2033
- Figure 21: South America Bulletproof Glass Industry Revenue Share (%), by Type 2025 & 2033
- Figure 22: South America Bulletproof Glass Industry Revenue (billion), by End-user Industry 2025 & 2033
- Figure 23: South America Bulletproof Glass Industry Revenue Share (%), by End-user Industry 2025 & 2033
- Figure 24: South America Bulletproof Glass Industry Revenue (billion), by Country 2025 & 2033
- Figure 25: South America Bulletproof Glass Industry Revenue Share (%), by Country 2025 & 2033
- Figure 26: Middle East Bulletproof Glass Industry Revenue (billion), by Type 2025 & 2033
- Figure 27: Middle East Bulletproof Glass Industry Revenue Share (%), by Type 2025 & 2033
- Figure 28: Middle East Bulletproof Glass Industry Revenue (billion), by End-user Industry 2025 & 2033
- Figure 29: Middle East Bulletproof Glass Industry Revenue Share (%), by End-user Industry 2025 & 2033
- Figure 30: Middle East Bulletproof Glass Industry Revenue (billion), by Country 2025 & 2033
- Figure 31: Middle East Bulletproof Glass Industry Revenue Share (%), by Country 2025 & 2033
- Figure 32: Saudi Arabia Bulletproof Glass Industry Revenue (billion), by Type 2025 & 2033
- Figure 33: Saudi Arabia Bulletproof Glass Industry Revenue Share (%), by Type 2025 & 2033
- Figure 34: Saudi Arabia Bulletproof Glass Industry Revenue (billion), by End-user Industry 2025 & 2033
- Figure 35: Saudi Arabia Bulletproof Glass Industry Revenue Share (%), by End-user Industry 2025 & 2033
- Figure 36: Saudi Arabia Bulletproof Glass Industry Revenue (billion), by Country 2025 & 2033
- Figure 37: Saudi Arabia Bulletproof Glass Industry Revenue Share (%), by Country 2025 & 2033
List of Tables
- Table 1: Global Bulletproof Glass Industry Revenue billion Forecast, by Type 2020 & 2033
- Table 2: Global Bulletproof Glass Industry Revenue billion Forecast, by End-user Industry 2020 & 2033
- Table 3: Global Bulletproof Glass Industry Revenue billion Forecast, by Region 2020 & 2033
- Table 4: Global Bulletproof Glass Industry Revenue billion Forecast, by Type 2020 & 2033
- Table 5: Global Bulletproof Glass Industry Revenue billion Forecast, by End-user Industry 2020 & 2033
- Table 6: Global Bulletproof Glass Industry Revenue billion Forecast, by Country 2020 & 2033
- Table 7: China Bulletproof Glass Industry Revenue (billion) Forecast, by Application 2020 & 2033
- Table 8: India Bulletproof Glass Industry Revenue (billion) Forecast, by Application 2020 & 2033
- Table 9: Japan Bulletproof Glass Industry Revenue (billion) Forecast, by Application 2020 & 2033
- Table 10: South Korea Bulletproof Glass Industry Revenue (billion) Forecast, by Application 2020 & 2033
- Table 11: Rest of Asia Pacific Bulletproof Glass Industry Revenue (billion) Forecast, by Application 2020 & 2033
- Table 12: Global Bulletproof Glass Industry Revenue billion Forecast, by Type 2020 & 2033
- Table 13: Global Bulletproof Glass Industry Revenue billion Forecast, by End-user Industry 2020 & 2033
- Table 14: Global Bulletproof Glass Industry Revenue billion Forecast, by Country 2020 & 2033
- Table 15: United States Bulletproof Glass Industry Revenue (billion) Forecast, by Application 2020 & 2033
- Table 16: Canada Bulletproof Glass Industry Revenue (billion) Forecast, by Application 2020 & 2033
- Table 17: Mexico Bulletproof Glass Industry Revenue (billion) Forecast, by Application 2020 & 2033
- Table 18: Global Bulletproof Glass Industry Revenue billion Forecast, by Type 2020 & 2033
- Table 19: Global Bulletproof Glass Industry Revenue billion Forecast, by End-user Industry 2020 & 2033
- Table 20: Global Bulletproof Glass Industry Revenue billion Forecast, by Country 2020 & 2033
- Table 21: Germany Bulletproof Glass Industry Revenue (billion) Forecast, by Application 2020 & 2033
- Table 22: United Kingdom Bulletproof Glass Industry Revenue (billion) Forecast, by Application 2020 & 2033
- Table 23: France Bulletproof Glass Industry Revenue (billion) Forecast, by Application 2020 & 2033
- Table 24: Italy Bulletproof Glass Industry Revenue (billion) Forecast, by Application 2020 & 2033
- Table 25: Rest of Europe Bulletproof Glass Industry Revenue (billion) Forecast, by Application 2020 & 2033
- Table 26: Global Bulletproof Glass Industry Revenue billion Forecast, by Type 2020 & 2033
- Table 27: Global Bulletproof Glass Industry Revenue billion Forecast, by End-user Industry 2020 & 2033
- Table 28: Global Bulletproof Glass Industry Revenue billion Forecast, by Country 2020 & 2033
- Table 29: Brazil Bulletproof Glass Industry Revenue (billion) Forecast, by Application 2020 & 2033
- Table 30: Argentina Bulletproof Glass Industry Revenue (billion) Forecast, by Application 2020 & 2033
- Table 31: Rest of South America Bulletproof Glass Industry Revenue (billion) Forecast, by Application 2020 & 2033
- Table 32: Global Bulletproof Glass Industry Revenue billion Forecast, by Type 2020 & 2033
- Table 33: Global Bulletproof Glass Industry Revenue billion Forecast, by End-user Industry 2020 & 2033
- Table 34: Global Bulletproof Glass Industry Revenue billion Forecast, by Country 2020 & 2033
- Table 35: Global Bulletproof Glass Industry Revenue billion Forecast, by Type 2020 & 2033
- Table 36: Global Bulletproof Glass Industry Revenue billion Forecast, by End-user Industry 2020 & 2033
- Table 37: Global Bulletproof Glass Industry Revenue billion Forecast, by Country 2020 & 2033
- Table 38: South Africa Bulletproof Glass Industry Revenue (billion) Forecast, by Application 2020 & 2033
- Table 39: Rest of Middle East Bulletproof Glass Industry Revenue (billion) Forecast, by Application 2020 & 2033
Frequently Asked Questions
1. What is the projected Compound Annual Growth Rate (CAGR) of the Bulletproof Glass Industry?
The projected CAGR is approximately 11.78%.
2. Which companies are prominent players in the Bulletproof Glass Industry?
Key companies in the market include Total Security Solutions*List Not Exhaustive, Nippon Sheet Glass Co Ltd, Fuyao Glass America, Saint-Gobain, Taiwan Glass Ind Corp, Armortex, Centigon Security Group, Guardian Industries Holdings, Asahi India Glass Limited, Armass glass, STEC ARMOUR GLASS, Consolidated Glass Holdings Inc, Binswanger Glass, Guangdong Golden Glass Technologies Limited, SCHOTT AG.
3. What are the main segments of the Bulletproof Glass Industry?
The market segments include Type, End-user Industry.
4. Can you provide details about the market size?
The market size is estimated to be USD 10.83 billion as of 2022.
5. What are some drivers contributing to market growth?
High Military Spending; Increased Development and Construction Activity.
6. What are the notable trends driving market growth?
Increasing Demand from Defense Sector to Dominate the Market.
7. Are there any restraints impacting market growth?
High-end pricing of Raw Materials.
8. Can you provide examples of recent developments in the market?
January 2023: Asahi India Glass Limited announced its collaboration with Enormous Brands to create brand films for its complete doors and windows solutions brand, AIS Windows. With this collaboration, AIS Windows is aiming to make a large impact in the doors and windows segment.
9. What pricing options are available for accessing the report?
Pricing options include single-user, multi-user, and enterprise licenses priced at USD 4750, USD 5250, and USD 8750 respectively.
10. Is the market size provided in terms of value or volume?
The market size is provided in terms of value, measured in billion.
11. Are there any specific market keywords associated with the report?
Yes, the market keyword associated with the report is "Bulletproof Glass Industry," which aids in identifying and referencing the specific market segment covered.
12. How do I determine which pricing option suits my needs best?
The pricing options vary based on user requirements and access needs. Individual users may opt for single-user licenses, while businesses requiring broader access may choose multi-user or enterprise licenses for cost-effective access to the report.
13. Are there any additional resources or data provided in the Bulletproof Glass Industry report?
While the report offers comprehensive insights, it's advisable to review the specific contents or supplementary materials provided to ascertain if additional resources or data are available.
14. How can I stay updated on further developments or reports in the Bulletproof Glass Industry?
To stay informed about further developments, trends, and reports in the Bulletproof Glass Industry, consider subscribing to industry newsletters, following relevant companies and organizations, or regularly checking reputable industry news sources and publications.
Methodology
Step 1 - Identification of Relevant Samples Size from Population Database


Step 2 - Approaches for Defining Global Market Size (Value, Volume* & Price*)

Note*: In applicable scenarios
Step 3 - Data Sources
Primary Research
- Web Analytics
- Survey Reports
- Research Institute
- Latest Research Reports
- Opinion Leaders
Secondary Research
- Annual Reports
- White Paper
- Latest Press Release
- Industry Association
- Paid Database
- Investor Presentations

Step 4 - Data Triangulation
Involves using different sources of information in order to increase the validity of a study
These sources are likely to be stakeholders in a program - participants, other researchers, program staff, other community members, and so on.
Then we put all data in single framework & apply various statistical tools to find out the dynamic on the market.
During the analysis stage, feedback from the stakeholder groups would be compared to determine areas of agreement as well as areas of divergence