

Key Insights
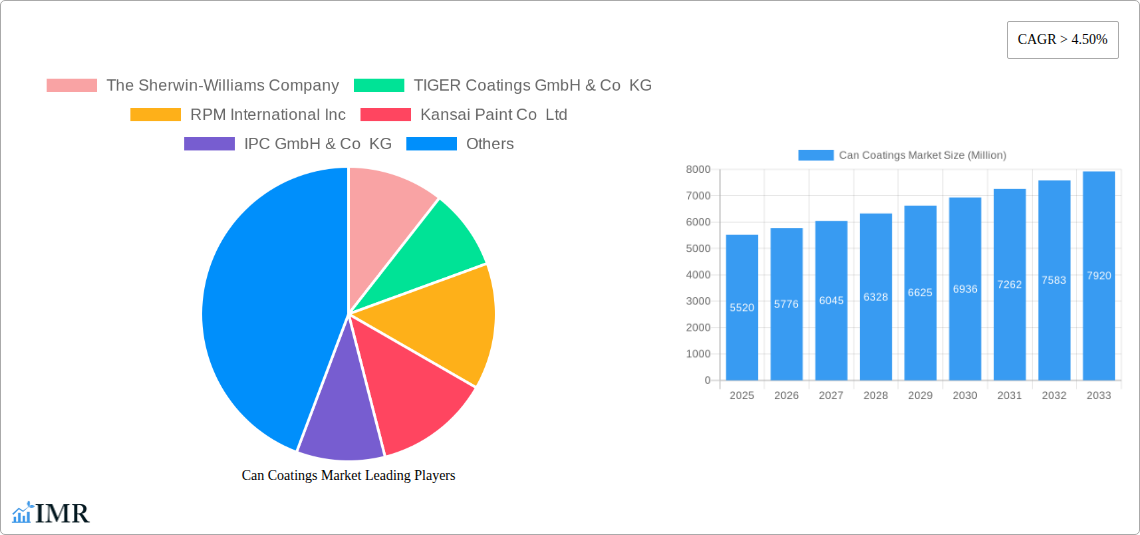
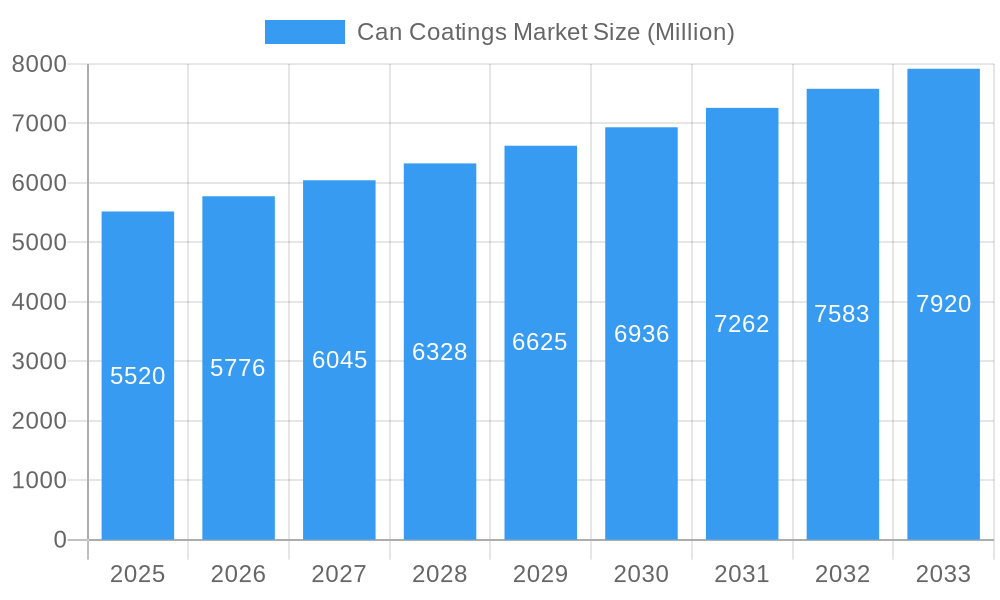
The global can coatings market, valued at $5.52 billion in 2025, is projected to experience robust growth, exhibiting a Compound Annual Growth Rate (CAGR) exceeding 4.50% from 2025 to 2033. This expansion is driven by several key factors. The burgeoning food and beverage industry, coupled with rising demand for convenient packaging solutions, fuels the need for protective and aesthetically pleasing can coatings. Increasing consumer awareness of food safety and product shelf life further necessitates high-quality coatings that prevent corrosion, contamination, and maintain product integrity. Technological advancements in coating formulations, such as the development of eco-friendly, water-based options and improved performance characteristics (e.g., enhanced scratch resistance and UV protection), are also significant drivers. Furthermore, the growing adoption of decorative coatings to enhance brand appeal and product differentiation within the competitive marketplace contributes to market growth. Regional growth varies, with North America and Europe holding significant market shares, while the Asia-Pacific region is poised for rapid expansion due to increasing industrialization and rising disposable incomes.
Can Coatings Market Market Size (In Billion)
However, the market faces certain challenges. Fluctuations in raw material prices, particularly those of resins and solvents, can impact profitability. Stringent environmental regulations regarding volatile organic compound (VOC) emissions necessitate the development and adoption of more sustainable coating technologies, posing both opportunities and challenges for manufacturers. Competition from alternative packaging materials, such as flexible pouches and glass containers, also exerts pressure on the can coatings market. Nevertheless, the ongoing trend toward sustainability and innovation within the coatings industry, combined with the sustained demand for canned goods, positions the can coatings market for continued, albeit moderated, growth throughout the forecast period. The market segmentation by type (acrylic, epoxy, polyester, and others) and application (beverage cans, food cans, aerosol cans, and others) provides further insights into the diverse nature of this dynamic market. Leading companies like Sherwin-Williams, PPG Industries, and Akzo Nobel are actively engaged in R&D and strategic partnerships to maintain their market positions and capitalize on growth opportunities.
Can Coatings Market Company Market Share
Can Coatings Market: A Comprehensive Report (2019-2033)
This comprehensive report provides an in-depth analysis of the Can Coatings market, encompassing market dynamics, growth trends, regional analysis, product landscape, key players, and future outlook. The report covers the period from 2019 to 2033, with 2025 serving as the base year and estimated year. The historical period analyzed is 2019-2024, while the forecast period extends from 2025 to 2033. The market is segmented by type (Acrylic, Epoxy, Polyester, Other Types) and application (Beverage Can, Food Can, Aerosol Can, Other Applications). The total market value is projected at xx Million units by 2033.
Can Coatings Market Dynamics & Structure
The Can Coatings market is characterized by moderate concentration, with key players holding significant market share. The market's structure is influenced by technological advancements, stringent regulatory frameworks concerning sustainability and safety (e.g., BPA-free regulations), and the availability of competitive substitutes. End-user demographics, particularly within the food and beverage industries, significantly impact demand. M&A activity has been moderate in recent years, with a focus on expanding product portfolios and geographical reach. Quantitative insights are scarce due to the private nature of many deals.
- Market Concentration: Moderately concentrated, with top 5 players holding approximately xx% market share in 2024.
- Technological Innovation: Focus on sustainable and eco-friendly coatings (e.g., BPA-free options) is a major driver. Innovation barriers include high R&D costs and stringent regulatory approvals.
- Regulatory Frameworks: Growing emphasis on environmental regulations and food safety standards influences product development and adoption.
- Competitive Substitutes: Limited direct substitutes exist; however, alternative packaging materials pose indirect competition.
- End-User Demographics: Growth is largely driven by the increasing demand for canned food and beverages, particularly in developing economies.
- M&A Trends: Moderate M&A activity observed in recent years, primarily for strategic acquisitions and geographical expansion; xx deals were recorded between 2019-2024.
Can Coatings Market Growth Trends & Insights
The Can Coatings market experienced steady growth between 2019 and 2024, driven by increasing demand from the food and beverage industry. The market size reached xx Million units in 2024, exhibiting a CAGR of xx% during the historical period. Technological advancements, particularly the development of sustainable and high-performance coatings, are expected to further accelerate growth during the forecast period. Consumer preference for convenience and the rise of e-commerce are also contributing factors. Adoption rates of new coatings are increasing, with a particular emphasis on BPA-free alternatives. The market penetration of eco-friendly coatings is steadily growing, exceeding xx% in 2024 and projected to reach xx% by 2033. Disruptions like the introduction of innovative coating technologies and changes in consumer behavior influence the demand for specific coating types. The overall market is projected to reach xx Million units by 2033, with a forecasted CAGR of xx% during the forecast period (2025-2033).
Dominant Regions, Countries, or Segments in Can Coatings Market
The Asia-Pacific region is currently the dominant market for can coatings, driven by the high consumption of canned food and beverages, rapid industrialization, and a growing middle class. North America and Europe also hold significant market shares. Within the segmentations, the beverage can application segment dominates, followed by food cans. The Acrylic type holds the largest market share among coating types due to its versatility and cost-effectiveness.
Key Drivers:
- Asia-Pacific: High consumption of canned goods, rapid economic growth, and expanding industrial base.
- North America: Established food and beverage industry, significant technological advancements.
- Europe: Stringent environmental regulations driving demand for sustainable coatings.
- Beverage Can Application: Higher demand due to the widespread consumption of canned beverages.
- Acrylic Type: Cost-effectiveness and versatility make it the preferred choice for many applications.
Dominance Factors:
- High consumption of canned food and beverages.
- Favorable economic conditions and industrial growth.
- Government support for sustainable packaging solutions.
- Growing consumer preference for convenience and portability.
Can Coatings Market Product Landscape
The can coatings market showcases a diverse range of products, characterized by ongoing innovation in terms of performance, sustainability, and application methods. Recent advancements focus on developing BPA-free coatings that meet stringent food safety regulations and enhance the recyclability of aluminum cans. These coatings offer superior corrosion resistance, improved scratch resistance, and enhanced aesthetic appeal. Unique selling propositions include improved durability, reduced environmental impact, and enhanced application efficiency.
Key Drivers, Barriers & Challenges in Can Coatings Market
Key Drivers:
- Increasing demand for canned food and beverages globally.
- Growing focus on sustainable and eco-friendly packaging solutions.
- Technological advancements leading to improved coating performance.
- Stringent regulatory requirements driving innovation in BPA-free coatings.
Key Challenges and Restraints:
- Fluctuations in raw material prices impacting production costs.
- Stringent environmental regulations and compliance requirements.
- Intense competition from existing and new market players.
- Supply chain disruptions affecting raw material availability and timely delivery. This resulted in a xx% increase in production costs in 2022.
Emerging Opportunities in Can Coatings Market
- Expanding into emerging markets with high growth potential.
- Development of specialized coatings for niche applications.
- Focus on innovative packaging solutions enhancing recyclability.
- Exploring new coating technologies with improved performance and sustainability.
Growth Accelerators in the Can Coatings Market Industry
The can coatings market is poised for sustained growth driven by technological breakthroughs in sustainable coating formulations, strategic partnerships fostering innovation, and the expansion into untapped markets. Increased collaboration between coating manufacturers and packaging companies to develop recyclable and eco-friendly packaging is a significant growth catalyst. The market's long-term potential is high, particularly in developing economies experiencing rapid industrialization and urbanization.
Key Players Shaping the Can Coatings Market Market
- The Sherwin-Williams Company
- TIGER Coatings GmbH & Co KG
- RPM International Inc
- Kansai Paint Co Ltd
- IPC GmbH & Co KG
- PPG Industries Inc
- TOYOCHEM CO LTD
- VPL Coatings GmbH & Co KG
- Axalta Coating Systems
- Akzo Nobel N V
- National Paints Factories Co Ltd
- Kupsa Coatings
Notable Milestones in Can Coatings Market Sector
- November 2023: AkzoNobel's EUR 32 million (~USD 34.99 million) investment in a new bisphenol-free coatings factory in Vilafranca, Spain, signifies a major commitment to sustainable packaging solutions and strengthens its position in the EMEA market. Projected operational start: mid-2025.
- August 2022: PPG Industries, Inc. launched PPG INNOVEL PRO, a BPA-free internal spray coating for infinitely recyclable aluminum beverage cans, showcasing innovation in sustainable coatings technology.
- July 2022: PPG Industries, Inc. expanded its Delaware, Ohio facility, increasing production capacity for over-varnish coatings for beverage can exteriors, including PPG ISENSE Gloss coatings, demonstrating commitment to meeting increasing market demand.
In-Depth Can Coatings Market Market Outlook
The Can Coatings market exhibits significant future potential, driven by continuous innovation in sustainable and high-performance coatings, coupled with the increasing demand for canned food and beverages globally. Strategic partnerships, market expansions into emerging economies, and the growing focus on eco-friendly solutions will further propel the market's growth in the coming years. The market is expected to witness a considerable expansion, presenting lucrative opportunities for established players and new entrants alike.
Can Coatings Market Segmentation
-
1. Type
- 1.1. Acrylic
- 1.2. Epoxy
- 1.3. Polyester
- 1.4. Other Types
-
2. Application
- 2.1. Beverage Can
- 2.2. Food Can
- 2.3. Aerosol Can
- 2.4. Other Applications
Can Coatings Market Segmentation By Geography
-
1. Asia Pacific
- 1.1. China
- 1.2. India
- 1.3. Japan
- 1.4. South Korea
- 1.5. Indonesia
- 1.6. Malaysia
- 1.7. Thailand
- 1.8. Vietnam
- 1.9. Rest of Asia Pacific
-
2. North America
- 2.1. United States
- 2.2. Canada
- 2.3. Mexico
-
3. Europe
- 3.1. Germany
- 3.2. United Kingdom
- 3.3. France
- 3.4. Italy
- 3.5. Spain
- 3.6. Russia
- 3.7. Turkey
- 3.8. NORDIC Countries
- 3.9. Rest of Europe
-
4. South America
- 4.1. Brazil
- 4.2. Argentina
- 4.3. Colombia
- 4.4. Rest of South America
-
5. Middle East and Africa
- 5.1. Saudi Arabia
- 5.2. South Africa
- 5.3. Qatar
- 5.4. UAE
- 5.5. Egypt
- 5.6. Algeria
- 5.7. Rest of Middle East and Africa
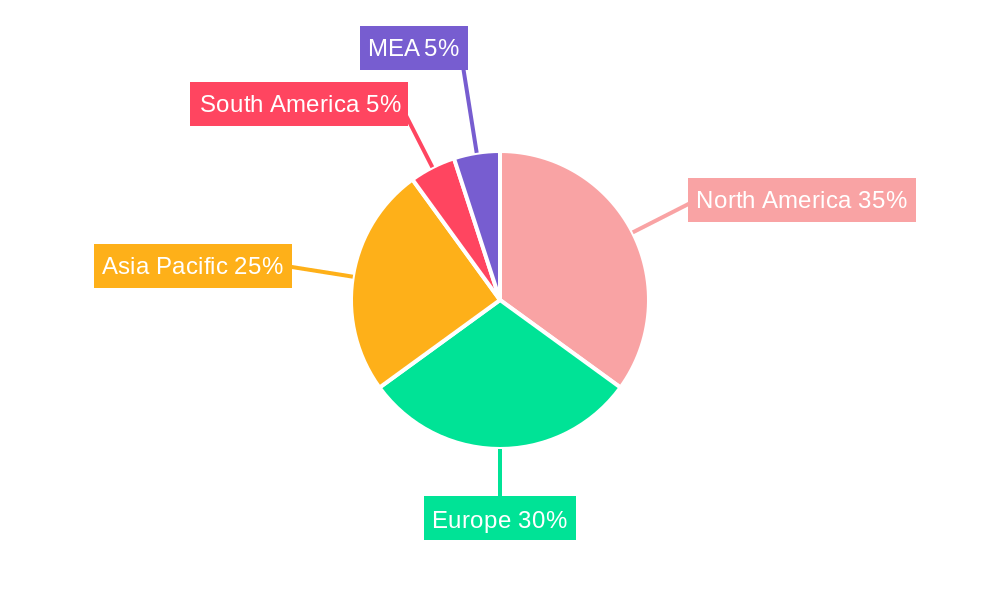
Can Coatings Market Regional Market Share
Geographic Coverage of Can Coatings Market
Can Coatings Market REPORT HIGHLIGHTS
| Aspects | Details |
|---|---|
| Study Period | 2020-2034 |
| Base Year | 2025 |
| Estimated Year | 2026 |
| Forecast Period | 2026-2034 |
| Historical Period | 2020-2025 |
| Growth Rate | CAGR of > 4.50% from 2020-2034 |
| Segmentation |
|
Table of Contents
- 1. Introduction
- 1.1. Research Scope
- 1.2. Market Segmentation
- 1.3. Research Objective
- 1.4. Definitions and Assumptions
- 2. Executive Summary
- 2.1. Market Snapshot
- 3. Market Dynamics
- 3.1. Market Drivers
- 3.2. Market Restrains
- 3.3. Market Trends
- 3.4. Market Opportunities
- 4. Market Factor Analysis
- 4.1. Porters Five Forces
- 4.1.1. Bargaining Power of Suppliers
- 4.1.2. Bargaining Power of Buyers
- 4.1.3. Threat of New Entrants
- 4.1.4. Threat of Substitutes
- 4.1.5. Competitive Rivalry
- 4.2. PESTEL analysis
- 4.3. BCG Analysis
- 4.3.1. Stars (High Growth, High Market Share)
- 4.3.2. Cash Cows (Low Growth, High Market Share)
- 4.3.3. Question Mark (High Growth, Low Market Share)
- 4.3.4. Dogs (Low Growth, Low Market Share)
- 4.4. Ansoff Matrix Analysis
- 4.5. Supply Chain Analysis
- 4.6. Regulatory Landscape
- 4.7. Current Market Potential and Opportunity Assessment (TAM–SAM–SOM Framework)
- 4.8. IMR Analyst Note
- 4.1. Porters Five Forces
- 5. Market Analysis, Insights and Forecast 2021-2033
- 5.1. Market Analysis, Insights and Forecast - by Type
- 5.1.1. Acrylic
- 5.1.2. Epoxy
- 5.1.3. Polyester
- 5.1.4. Other Types
- 5.2. Market Analysis, Insights and Forecast - by Application
- 5.2.1. Beverage Can
- 5.2.2. Food Can
- 5.2.3. Aerosol Can
- 5.2.4. Other Applications
- 5.3. Market Analysis, Insights and Forecast - by Region
- 5.3.1. Asia Pacific
- 5.3.2. North America
- 5.3.3. Europe
- 5.3.4. South America
- 5.3.5. Middle East and Africa
- 5.1. Market Analysis, Insights and Forecast - by Type
- 6. Global Can Coatings Market Analysis, Insights and Forecast, 2021-2033
- 6.1. Market Analysis, Insights and Forecast - by Type
- 6.1.1. Acrylic
- 6.1.2. Epoxy
- 6.1.3. Polyester
- 6.1.4. Other Types
- 6.2. Market Analysis, Insights and Forecast - by Application
- 6.2.1. Beverage Can
- 6.2.2. Food Can
- 6.2.3. Aerosol Can
- 6.2.4. Other Applications
- 6.1. Market Analysis, Insights and Forecast - by Type
- 7. Asia Pacific Can Coatings Market Analysis, Insights and Forecast, 2020-2032
- 7.1. Market Analysis, Insights and Forecast - by Type
- 7.1.1. Acrylic
- 7.1.2. Epoxy
- 7.1.3. Polyester
- 7.1.4. Other Types
- 7.2. Market Analysis, Insights and Forecast - by Application
- 7.2.1. Beverage Can
- 7.2.2. Food Can
- 7.2.3. Aerosol Can
- 7.2.4. Other Applications
- 7.1. Market Analysis, Insights and Forecast - by Type
- 8. North America Can Coatings Market Analysis, Insights and Forecast, 2020-2032
- 8.1. Market Analysis, Insights and Forecast - by Type
- 8.1.1. Acrylic
- 8.1.2. Epoxy
- 8.1.3. Polyester
- 8.1.4. Other Types
- 8.2. Market Analysis, Insights and Forecast - by Application
- 8.2.1. Beverage Can
- 8.2.2. Food Can
- 8.2.3. Aerosol Can
- 8.2.4. Other Applications
- 8.1. Market Analysis, Insights and Forecast - by Type
- 9. Europe Can Coatings Market Analysis, Insights and Forecast, 2020-2032
- 9.1. Market Analysis, Insights and Forecast - by Type
- 9.1.1. Acrylic
- 9.1.2. Epoxy
- 9.1.3. Polyester
- 9.1.4. Other Types
- 9.2. Market Analysis, Insights and Forecast - by Application
- 9.2.1. Beverage Can
- 9.2.2. Food Can
- 9.2.3. Aerosol Can
- 9.2.4. Other Applications
- 9.1. Market Analysis, Insights and Forecast - by Type
- 10. South America Can Coatings Market Analysis, Insights and Forecast, 2020-2032
- 10.1. Market Analysis, Insights and Forecast - by Type
- 10.1.1. Acrylic
- 10.1.2. Epoxy
- 10.1.3. Polyester
- 10.1.4. Other Types
- 10.2. Market Analysis, Insights and Forecast - by Application
- 10.2.1. Beverage Can
- 10.2.2. Food Can
- 10.2.3. Aerosol Can
- 10.2.4. Other Applications
- 10.1. Market Analysis, Insights and Forecast - by Type
- 11. Middle East and Africa Can Coatings Market Analysis, Insights and Forecast, 2020-2032
- 11.1. Market Analysis, Insights and Forecast - by Type
- 11.1.1. Acrylic
- 11.1.2. Epoxy
- 11.1.3. Polyester
- 11.1.4. Other Types
- 11.2. Market Analysis, Insights and Forecast - by Application
- 11.2.1. Beverage Can
- 11.2.2. Food Can
- 11.2.3. Aerosol Can
- 11.2.4. Other Applications
- 11.1. Market Analysis, Insights and Forecast - by Type
- 12. Competitive Analysis
- 12.1. Company Profiles
- 12.1.1 The Sherwin-Williams Company
- 12.1.1.1. Company Overview
- 12.1.1.2. Products
- 12.1.1.3. Company Financials
- 12.1.1.4. SWOT Analysis
- 12.1.2 TIGER Coatings GmbH & Co KG
- 12.1.2.1. Company Overview
- 12.1.2.2. Products
- 12.1.2.3. Company Financials
- 12.1.2.4. SWOT Analysis
- 12.1.3 RPM International Inc
- 12.1.3.1. Company Overview
- 12.1.3.2. Products
- 12.1.3.3. Company Financials
- 12.1.3.4. SWOT Analysis
- 12.1.4 Kansai Paint Co Ltd
- 12.1.4.1. Company Overview
- 12.1.4.2. Products
- 12.1.4.3. Company Financials
- 12.1.4.4. SWOT Analysis
- 12.1.5 IPC GmbH & Co KG
- 12.1.5.1. Company Overview
- 12.1.5.2. Products
- 12.1.5.3. Company Financials
- 12.1.5.4. SWOT Analysis
- 12.1.6 PPG Industries Inc
- 12.1.6.1. Company Overview
- 12.1.6.2. Products
- 12.1.6.3. Company Financials
- 12.1.6.4. SWOT Analysis
- 12.1.7 TOYOCHEM CO LTD
- 12.1.7.1. Company Overview
- 12.1.7.2. Products
- 12.1.7.3. Company Financials
- 12.1.7.4. SWOT Analysis
- 12.1.8 VPL Coatings GmbH & Co KG*List Not Exhaustive
- 12.1.8.1. Company Overview
- 12.1.8.2. Products
- 12.1.8.3. Company Financials
- 12.1.8.4. SWOT Analysis
- 12.1.9 Axalta Coating Systems
- 12.1.9.1. Company Overview
- 12.1.9.2. Products
- 12.1.9.3. Company Financials
- 12.1.9.4. SWOT Analysis
- 12.1.10 Akzo Nobel N V
- 12.1.10.1. Company Overview
- 12.1.10.2. Products
- 12.1.10.3. Company Financials
- 12.1.10.4. SWOT Analysis
- 12.1.11 National Paints Factories Co Ltd
- 12.1.11.1. Company Overview
- 12.1.11.2. Products
- 12.1.11.3. Company Financials
- 12.1.11.4. SWOT Analysis
- 12.1.12 Kupsa Coatings
- 12.1.12.1. Company Overview
- 12.1.12.2. Products
- 12.1.12.3. Company Financials
- 12.1.12.4. SWOT Analysis
- 12.1.1 The Sherwin-Williams Company
- 12.2. Market Entropy
- 12.2.1 Company's Key Areas Served
- 12.2.2 Recent Developments
- 12.3. Company Market Share Analysis 2025
- 12.3.1 Top 5 Companies Market Share Analysis
- 12.3.2 Top 3 Companies Market Share Analysis
- 12.4. List of Potential Customers
- 13. Research Methodology
List of Figures
- Figure 1: Global Can Coatings Market Revenue Breakdown (Million, %) by Region 2025 & 2033
- Figure 2: Global Can Coatings Market Volume Breakdown (liter per unit, %) by Region 2025 & 2033
- Figure 3: Asia Pacific Can Coatings Market Revenue (Million), by Type 2025 & 2033
- Figure 4: Asia Pacific Can Coatings Market Volume (liter per unit), by Type 2025 & 2033
- Figure 5: Asia Pacific Can Coatings Market Revenue Share (%), by Type 2025 & 2033
- Figure 6: Asia Pacific Can Coatings Market Volume Share (%), by Type 2025 & 2033
- Figure 7: Asia Pacific Can Coatings Market Revenue (Million), by Application 2025 & 2033
- Figure 8: Asia Pacific Can Coatings Market Volume (liter per unit), by Application 2025 & 2033
- Figure 9: Asia Pacific Can Coatings Market Revenue Share (%), by Application 2025 & 2033
- Figure 10: Asia Pacific Can Coatings Market Volume Share (%), by Application 2025 & 2033
- Figure 11: Asia Pacific Can Coatings Market Revenue (Million), by Country 2025 & 2033
- Figure 12: Asia Pacific Can Coatings Market Volume (liter per unit), by Country 2025 & 2033
- Figure 13: Asia Pacific Can Coatings Market Revenue Share (%), by Country 2025 & 2033
- Figure 14: Asia Pacific Can Coatings Market Volume Share (%), by Country 2025 & 2033
- Figure 15: North America Can Coatings Market Revenue (Million), by Type 2025 & 2033
- Figure 16: North America Can Coatings Market Volume (liter per unit), by Type 2025 & 2033
- Figure 17: North America Can Coatings Market Revenue Share (%), by Type 2025 & 2033
- Figure 18: North America Can Coatings Market Volume Share (%), by Type 2025 & 2033
- Figure 19: North America Can Coatings Market Revenue (Million), by Application 2025 & 2033
- Figure 20: North America Can Coatings Market Volume (liter per unit), by Application 2025 & 2033
- Figure 21: North America Can Coatings Market Revenue Share (%), by Application 2025 & 2033
- Figure 22: North America Can Coatings Market Volume Share (%), by Application 2025 & 2033
- Figure 23: North America Can Coatings Market Revenue (Million), by Country 2025 & 2033
- Figure 24: North America Can Coatings Market Volume (liter per unit), by Country 2025 & 2033
- Figure 25: North America Can Coatings Market Revenue Share (%), by Country 2025 & 2033
- Figure 26: North America Can Coatings Market Volume Share (%), by Country 2025 & 2033
- Figure 27: Europe Can Coatings Market Revenue (Million), by Type 2025 & 2033
- Figure 28: Europe Can Coatings Market Volume (liter per unit), by Type 2025 & 2033
- Figure 29: Europe Can Coatings Market Revenue Share (%), by Type 2025 & 2033
- Figure 30: Europe Can Coatings Market Volume Share (%), by Type 2025 & 2033
- Figure 31: Europe Can Coatings Market Revenue (Million), by Application 2025 & 2033
- Figure 32: Europe Can Coatings Market Volume (liter per unit), by Application 2025 & 2033
- Figure 33: Europe Can Coatings Market Revenue Share (%), by Application 2025 & 2033
- Figure 34: Europe Can Coatings Market Volume Share (%), by Application 2025 & 2033
- Figure 35: Europe Can Coatings Market Revenue (Million), by Country 2025 & 2033
- Figure 36: Europe Can Coatings Market Volume (liter per unit), by Country 2025 & 2033
- Figure 37: Europe Can Coatings Market Revenue Share (%), by Country 2025 & 2033
- Figure 38: Europe Can Coatings Market Volume Share (%), by Country 2025 & 2033
- Figure 39: South America Can Coatings Market Revenue (Million), by Type 2025 & 2033
- Figure 40: South America Can Coatings Market Volume (liter per unit), by Type 2025 & 2033
- Figure 41: South America Can Coatings Market Revenue Share (%), by Type 2025 & 2033
- Figure 42: South America Can Coatings Market Volume Share (%), by Type 2025 & 2033
- Figure 43: South America Can Coatings Market Revenue (Million), by Application 2025 & 2033
- Figure 44: South America Can Coatings Market Volume (liter per unit), by Application 2025 & 2033
- Figure 45: South America Can Coatings Market Revenue Share (%), by Application 2025 & 2033
- Figure 46: South America Can Coatings Market Volume Share (%), by Application 2025 & 2033
- Figure 47: South America Can Coatings Market Revenue (Million), by Country 2025 & 2033
- Figure 48: South America Can Coatings Market Volume (liter per unit), by Country 2025 & 2033
- Figure 49: South America Can Coatings Market Revenue Share (%), by Country 2025 & 2033
- Figure 50: South America Can Coatings Market Volume Share (%), by Country 2025 & 2033
- Figure 51: Middle East and Africa Can Coatings Market Revenue (Million), by Type 2025 & 2033
- Figure 52: Middle East and Africa Can Coatings Market Volume (liter per unit), by Type 2025 & 2033
- Figure 53: Middle East and Africa Can Coatings Market Revenue Share (%), by Type 2025 & 2033
- Figure 54: Middle East and Africa Can Coatings Market Volume Share (%), by Type 2025 & 2033
- Figure 55: Middle East and Africa Can Coatings Market Revenue (Million), by Application 2025 & 2033
- Figure 56: Middle East and Africa Can Coatings Market Volume (liter per unit), by Application 2025 & 2033
- Figure 57: Middle East and Africa Can Coatings Market Revenue Share (%), by Application 2025 & 2033
- Figure 58: Middle East and Africa Can Coatings Market Volume Share (%), by Application 2025 & 2033
- Figure 59: Middle East and Africa Can Coatings Market Revenue (Million), by Country 2025 & 2033
- Figure 60: Middle East and Africa Can Coatings Market Volume (liter per unit), by Country 2025 & 2033
- Figure 61: Middle East and Africa Can Coatings Market Revenue Share (%), by Country 2025 & 2033
- Figure 62: Middle East and Africa Can Coatings Market Volume Share (%), by Country 2025 & 2033
List of Tables
- Table 1: Global Can Coatings Market Revenue Million Forecast, by Type 2020 & 2033
- Table 2: Global Can Coatings Market Volume liter per unit Forecast, by Type 2020 & 2033
- Table 3: Global Can Coatings Market Revenue Million Forecast, by Application 2020 & 2033
- Table 4: Global Can Coatings Market Volume liter per unit Forecast, by Application 2020 & 2033
- Table 5: Global Can Coatings Market Revenue Million Forecast, by Region 2020 & 2033
- Table 6: Global Can Coatings Market Volume liter per unit Forecast, by Region 2020 & 2033
- Table 7: Global Can Coatings Market Revenue Million Forecast, by Type 2020 & 2033
- Table 8: Global Can Coatings Market Volume liter per unit Forecast, by Type 2020 & 2033
- Table 9: Global Can Coatings Market Revenue Million Forecast, by Application 2020 & 2033
- Table 10: Global Can Coatings Market Volume liter per unit Forecast, by Application 2020 & 2033
- Table 11: Global Can Coatings Market Revenue Million Forecast, by Country 2020 & 2033
- Table 12: Global Can Coatings Market Volume liter per unit Forecast, by Country 2020 & 2033
- Table 13: China Can Coatings Market Revenue (Million) Forecast, by Application 2020 & 2033
- Table 14: China Can Coatings Market Volume (liter per unit) Forecast, by Application 2020 & 2033
- Table 15: India Can Coatings Market Revenue (Million) Forecast, by Application 2020 & 2033
- Table 16: India Can Coatings Market Volume (liter per unit) Forecast, by Application 2020 & 2033
- Table 17: Japan Can Coatings Market Revenue (Million) Forecast, by Application 2020 & 2033
- Table 18: Japan Can Coatings Market Volume (liter per unit) Forecast, by Application 2020 & 2033
- Table 19: South Korea Can Coatings Market Revenue (Million) Forecast, by Application 2020 & 2033
- Table 20: South Korea Can Coatings Market Volume (liter per unit) Forecast, by Application 2020 & 2033
- Table 21: Indonesia Can Coatings Market Revenue (Million) Forecast, by Application 2020 & 2033
- Table 22: Indonesia Can Coatings Market Volume (liter per unit) Forecast, by Application 2020 & 2033
- Table 23: Malaysia Can Coatings Market Revenue (Million) Forecast, by Application 2020 & 2033
- Table 24: Malaysia Can Coatings Market Volume (liter per unit) Forecast, by Application 2020 & 2033
- Table 25: Thailand Can Coatings Market Revenue (Million) Forecast, by Application 2020 & 2033
- Table 26: Thailand Can Coatings Market Volume (liter per unit) Forecast, by Application 2020 & 2033
- Table 27: Vietnam Can Coatings Market Revenue (Million) Forecast, by Application 2020 & 2033
- Table 28: Vietnam Can Coatings Market Volume (liter per unit) Forecast, by Application 2020 & 2033
- Table 29: Rest of Asia Pacific Can Coatings Market Revenue (Million) Forecast, by Application 2020 & 2033
- Table 30: Rest of Asia Pacific Can Coatings Market Volume (liter per unit) Forecast, by Application 2020 & 2033
- Table 31: Global Can Coatings Market Revenue Million Forecast, by Type 2020 & 2033
- Table 32: Global Can Coatings Market Volume liter per unit Forecast, by Type 2020 & 2033
- Table 33: Global Can Coatings Market Revenue Million Forecast, by Application 2020 & 2033
- Table 34: Global Can Coatings Market Volume liter per unit Forecast, by Application 2020 & 2033
- Table 35: Global Can Coatings Market Revenue Million Forecast, by Country 2020 & 2033
- Table 36: Global Can Coatings Market Volume liter per unit Forecast, by Country 2020 & 2033
- Table 37: United States Can Coatings Market Revenue (Million) Forecast, by Application 2020 & 2033
- Table 38: United States Can Coatings Market Volume (liter per unit) Forecast, by Application 2020 & 2033
- Table 39: Canada Can Coatings Market Revenue (Million) Forecast, by Application 2020 & 2033
- Table 40: Canada Can Coatings Market Volume (liter per unit) Forecast, by Application 2020 & 2033
- Table 41: Mexico Can Coatings Market Revenue (Million) Forecast, by Application 2020 & 2033
- Table 42: Mexico Can Coatings Market Volume (liter per unit) Forecast, by Application 2020 & 2033
- Table 43: Global Can Coatings Market Revenue Million Forecast, by Type 2020 & 2033
- Table 44: Global Can Coatings Market Volume liter per unit Forecast, by Type 2020 & 2033
- Table 45: Global Can Coatings Market Revenue Million Forecast, by Application 2020 & 2033
- Table 46: Global Can Coatings Market Volume liter per unit Forecast, by Application 2020 & 2033
- Table 47: Global Can Coatings Market Revenue Million Forecast, by Country 2020 & 2033
- Table 48: Global Can Coatings Market Volume liter per unit Forecast, by Country 2020 & 2033
- Table 49: Germany Can Coatings Market Revenue (Million) Forecast, by Application 2020 & 2033
- Table 50: Germany Can Coatings Market Volume (liter per unit) Forecast, by Application 2020 & 2033
- Table 51: United Kingdom Can Coatings Market Revenue (Million) Forecast, by Application 2020 & 2033
- Table 52: United Kingdom Can Coatings Market Volume (liter per unit) Forecast, by Application 2020 & 2033
- Table 53: France Can Coatings Market Revenue (Million) Forecast, by Application 2020 & 2033
- Table 54: France Can Coatings Market Volume (liter per unit) Forecast, by Application 2020 & 2033
- Table 55: Italy Can Coatings Market Revenue (Million) Forecast, by Application 2020 & 2033
- Table 56: Italy Can Coatings Market Volume (liter per unit) Forecast, by Application 2020 & 2033
- Table 57: Spain Can Coatings Market Revenue (Million) Forecast, by Application 2020 & 2033
- Table 58: Spain Can Coatings Market Volume (liter per unit) Forecast, by Application 2020 & 2033
- Table 59: Russia Can Coatings Market Revenue (Million) Forecast, by Application 2020 & 2033
- Table 60: Russia Can Coatings Market Volume (liter per unit) Forecast, by Application 2020 & 2033
- Table 61: Turkey Can Coatings Market Revenue (Million) Forecast, by Application 2020 & 2033
- Table 62: Turkey Can Coatings Market Volume (liter per unit) Forecast, by Application 2020 & 2033
- Table 63: NORDIC Countries Can Coatings Market Revenue (Million) Forecast, by Application 2020 & 2033
- Table 64: NORDIC Countries Can Coatings Market Volume (liter per unit) Forecast, by Application 2020 & 2033
- Table 65: Rest of Europe Can Coatings Market Revenue (Million) Forecast, by Application 2020 & 2033
- Table 66: Rest of Europe Can Coatings Market Volume (liter per unit) Forecast, by Application 2020 & 2033
- Table 67: Global Can Coatings Market Revenue Million Forecast, by Type 2020 & 2033
- Table 68: Global Can Coatings Market Volume liter per unit Forecast, by Type 2020 & 2033
- Table 69: Global Can Coatings Market Revenue Million Forecast, by Application 2020 & 2033
- Table 70: Global Can Coatings Market Volume liter per unit Forecast, by Application 2020 & 2033
- Table 71: Global Can Coatings Market Revenue Million Forecast, by Country 2020 & 2033
- Table 72: Global Can Coatings Market Volume liter per unit Forecast, by Country 2020 & 2033
- Table 73: Brazil Can Coatings Market Revenue (Million) Forecast, by Application 2020 & 2033
- Table 74: Brazil Can Coatings Market Volume (liter per unit) Forecast, by Application 2020 & 2033
- Table 75: Argentina Can Coatings Market Revenue (Million) Forecast, by Application 2020 & 2033
- Table 76: Argentina Can Coatings Market Volume (liter per unit) Forecast, by Application 2020 & 2033
- Table 77: Colombia Can Coatings Market Revenue (Million) Forecast, by Application 2020 & 2033
- Table 78: Colombia Can Coatings Market Volume (liter per unit) Forecast, by Application 2020 & 2033
- Table 79: Rest of South America Can Coatings Market Revenue (Million) Forecast, by Application 2020 & 2033
- Table 80: Rest of South America Can Coatings Market Volume (liter per unit) Forecast, by Application 2020 & 2033
- Table 81: Global Can Coatings Market Revenue Million Forecast, by Type 2020 & 2033
- Table 82: Global Can Coatings Market Volume liter per unit Forecast, by Type 2020 & 2033
- Table 83: Global Can Coatings Market Revenue Million Forecast, by Application 2020 & 2033
- Table 84: Global Can Coatings Market Volume liter per unit Forecast, by Application 2020 & 2033
- Table 85: Global Can Coatings Market Revenue Million Forecast, by Country 2020 & 2033
- Table 86: Global Can Coatings Market Volume liter per unit Forecast, by Country 2020 & 2033
- Table 87: Saudi Arabia Can Coatings Market Revenue (Million) Forecast, by Application 2020 & 2033
- Table 88: Saudi Arabia Can Coatings Market Volume (liter per unit) Forecast, by Application 2020 & 2033
- Table 89: South Africa Can Coatings Market Revenue (Million) Forecast, by Application 2020 & 2033
- Table 90: South Africa Can Coatings Market Volume (liter per unit) Forecast, by Application 2020 & 2033
- Table 91: Qatar Can Coatings Market Revenue (Million) Forecast, by Application 2020 & 2033
- Table 92: Qatar Can Coatings Market Volume (liter per unit) Forecast, by Application 2020 & 2033
- Table 93: UAE Can Coatings Market Revenue (Million) Forecast, by Application 2020 & 2033
- Table 94: UAE Can Coatings Market Volume (liter per unit) Forecast, by Application 2020 & 2033
- Table 95: Egypt Can Coatings Market Revenue (Million) Forecast, by Application 2020 & 2033
- Table 96: Egypt Can Coatings Market Volume (liter per unit) Forecast, by Application 2020 & 2033
- Table 97: Algeria Can Coatings Market Revenue (Million) Forecast, by Application 2020 & 2033
- Table 98: Algeria Can Coatings Market Volume (liter per unit) Forecast, by Application 2020 & 2033
- Table 99: Rest of Middle East and Africa Can Coatings Market Revenue (Million) Forecast, by Application 2020 & 2033
- Table 100: Rest of Middle East and Africa Can Coatings Market Volume (liter per unit) Forecast, by Application 2020 & 2033
Frequently Asked Questions
1. What is the projected Compound Annual Growth Rate (CAGR) of the Can Coatings Market?
The projected CAGR is approximately > 4.50%.
2. Which companies are prominent players in the Can Coatings Market?
Key companies in the market include The Sherwin-Williams Company, TIGER Coatings GmbH & Co KG, RPM International Inc, Kansai Paint Co Ltd, IPC GmbH & Co KG, PPG Industries Inc, TOYOCHEM CO LTD, VPL Coatings GmbH & Co KG*List Not Exhaustive, Axalta Coating Systems, Akzo Nobel N V, National Paints Factories Co Ltd, Kupsa Coatings.
3. What are the main segments of the Can Coatings Market?
The market segments include Type, Application.
4. Can you provide details about the market size?
The market size is estimated to be USD 5.52 Million as of 2022.
5. What are some drivers contributing to market growth?
Increasing Demand from Food and Beverage Packaging; Growing Utilization of Aerosol Cans for Personal Care Industry.
6. What are the notable trends driving market growth?
Beverage Cans to Dominate the market.
7. Are there any restraints impacting market growth?
Stringent VOC Regulatory Policies; Other Restraints.
8. Can you provide examples of recent developments in the market?
November 2023: AkzoNobel will invest EUR 32 million (~USD 34.99 million) in a new factory at its Vilafranca site to manufacture bisphenol-free coatings for the metal packaging industry in EMEA (Europe, Middle East, and Africa). The facility will use advanced automation and has been designed to meet high eco-efficiency requirements, allowing the company to achieve significant improvements in energy and material economy. It is projected to be operational by the middle of 2025.
9. What pricing options are available for accessing the report?
Pricing options include single-user, multi-user, and enterprise licenses priced at USD 4750, USD 5250, and USD 8750 respectively.
10. Is the market size provided in terms of value or volume?
The market size is provided in terms of value, measured in Million and volume, measured in liter per unit.
11. Are there any specific market keywords associated with the report?
Yes, the market keyword associated with the report is "Can Coatings Market," which aids in identifying and referencing the specific market segment covered.
12. How do I determine which pricing option suits my needs best?
The pricing options vary based on user requirements and access needs. Individual users may opt for single-user licenses, while businesses requiring broader access may choose multi-user or enterprise licenses for cost-effective access to the report.
13. Are there any additional resources or data provided in the Can Coatings Market report?
While the report offers comprehensive insights, it's advisable to review the specific contents or supplementary materials provided to ascertain if additional resources or data are available.
14. How can I stay updated on further developments or reports in the Can Coatings Market?
To stay informed about further developments, trends, and reports in the Can Coatings Market, consider subscribing to industry newsletters, following relevant companies and organizations, or regularly checking reputable industry news sources and publications.
Methodology
Step 1 - Identification of Relevant Samples Size from Population Database


Step 2 - Approaches for Defining Global Market Size (Value, Volume* & Price*)

Note*: In applicable scenarios
Step 3 - Data Sources
Primary Research
- Web Analytics
- Survey Reports
- Research Institute
- Latest Research Reports
- Opinion Leaders
Secondary Research
- Annual Reports
- White Paper
- Latest Press Release
- Industry Association
- Paid Database
- Investor Presentations

Step 4 - Data Triangulation
Involves using different sources of information in order to increase the validity of a study
These sources are likely to be stakeholders in a program - participants, other researchers, program staff, other community members, and so on.
Then we put all data in single framework & apply various statistical tools to find out the dynamic on the market.
During the analysis stage, feedback from the stakeholder groups would be compared to determine areas of agreement as well as areas of divergence