

Key Insights
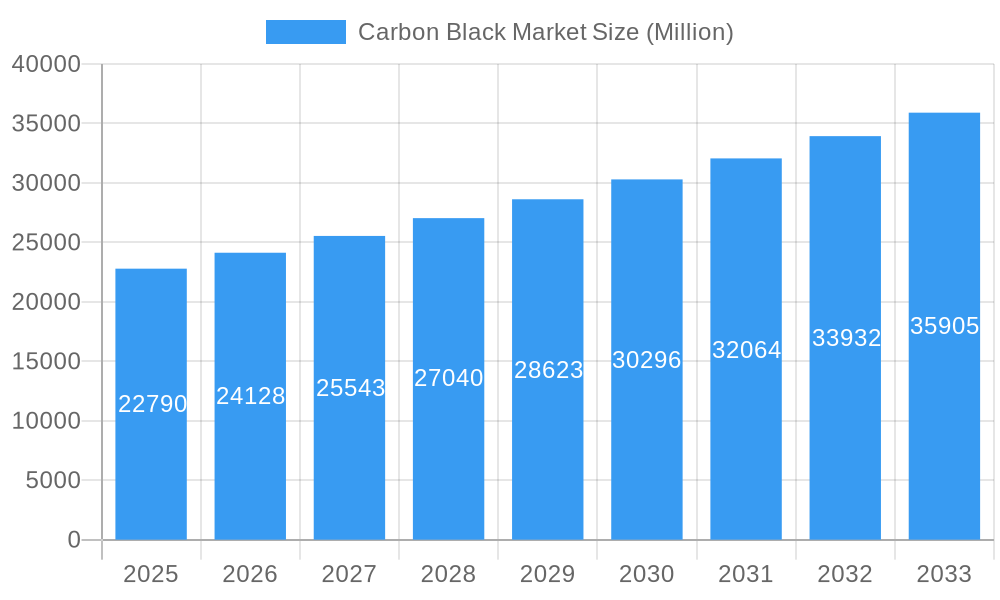
The global carbon black market, valued at $22.79 billion in 2025, is projected to experience robust growth, driven by a compound annual growth rate (CAGR) of 5.75% from 2025 to 2033. This expansion is fueled by several key factors. The burgeoning tire and industrial rubber products sector, a major consumer of carbon black, is a primary driver. Increased demand for vehicles globally, coupled with the rising adoption of high-performance tires requiring enhanced carbon black content, significantly contributes to market growth. Furthermore, the expanding plastics industry, particularly in packaging and construction, fuels demand for carbon black as a pigment and reinforcing agent. Growth in the printing and coatings industries also plays a crucial role, with carbon black used extensively in toners, inks, and paints. Technological advancements in carbon black production, leading to improved quality and efficiency, further enhance market prospects. However, environmental concerns surrounding carbon black production and its potential impact on air quality pose a restraint to market expansion. Stricter emission regulations in various regions are prompting companies to adopt cleaner production technologies, impacting overall market dynamics. The market is segmented by process type (furnace black, gas black, lamp black, thermal black) and application (tires and industrial rubber products, plastics, toners and printing inks, coatings, textile fibers, other applications), offering diverse avenues for market participants.
Carbon Black Market Market Size (In Billion)
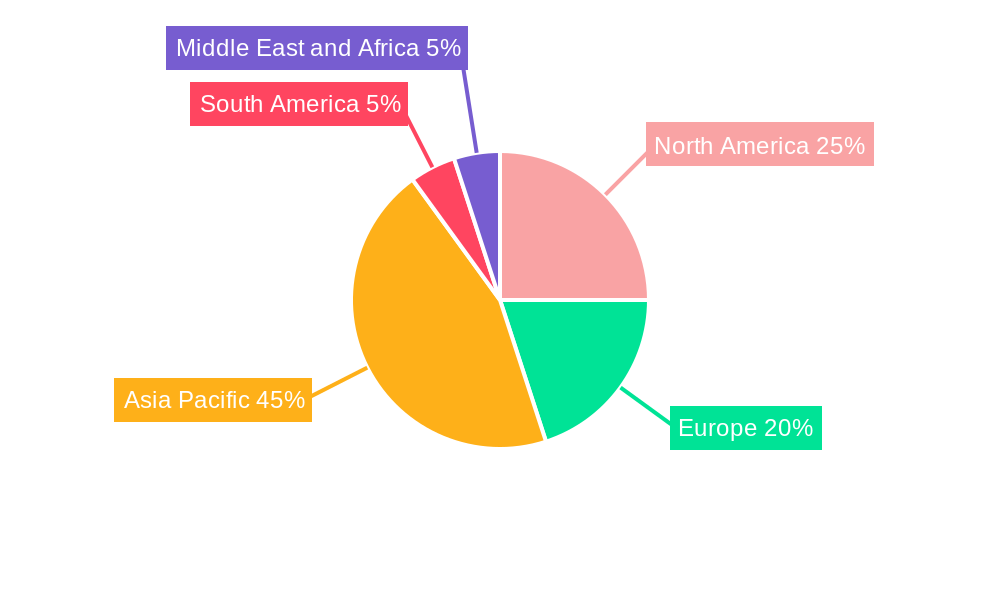
The Asia Pacific region, particularly China and India, dominates the carbon black market, driven by rapid industrialization and burgeoning automotive sectors in these countries. North America and Europe also represent significant markets, though their growth rates might be slightly lower compared to the Asia Pacific region due to already established infrastructure and relatively mature markets. Competition within the carbon black market is intense, with numerous multinational corporations and regional players vying for market share. Key players like Cabot Corporation, Birla Carbon, and Mitsubishi Chemical Corporation are investing in research and development to develop innovative carbon black products catering to specific application needs. The forecast period (2025-2033) indicates continued growth, fueled by increasing demand from diverse end-use sectors and ongoing innovations in carbon black production technologies. This positive outlook suggests substantial investment opportunities in the carbon black market for both producers and related industries.
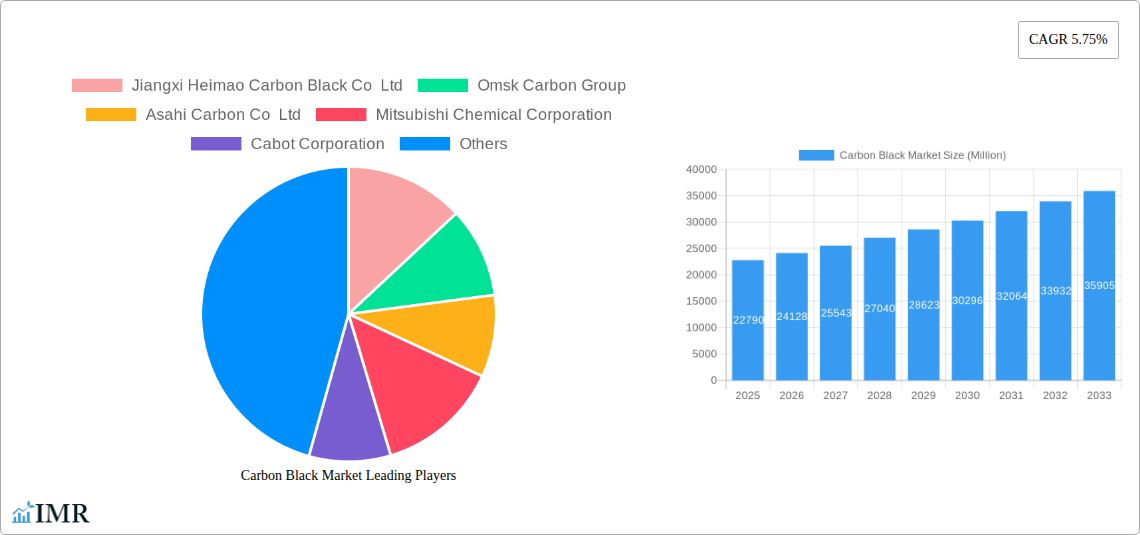
Carbon Black Market Company Market Share
This in-depth report provides a comprehensive analysis of the global carbon black market, encompassing market dynamics, growth trends, regional dominance, product landscape, key challenges, emerging opportunities, and key players. The study period covers 2019-2033, with 2025 as the base and estimated year. The report segments the market by process type (Furnace Black, Gas Black, Lamp Black, Thermal Black) and application (Tires and Industrial Rubber Products, Plastic, Toners and Printing Inks, Coatings, Textile Fiber, Other Applications), providing granular insights for informed decision-making. The report values are presented in Million units.
Carbon Black Market Market Dynamics & Structure
The carbon black market is characterized by a moderately concentrated landscape, with several major players holding significant market share. Market concentration is approximately xx%, with the top 5 companies holding xx%. Technological innovation, particularly in enhancing carbon black properties like conductivity and dispersion, is a key driver, alongside stricter environmental regulations pushing for more sustainable production methods. The market faces competition from alternative materials in specific applications, but carbon black retains its dominance due to its cost-effectiveness and performance characteristics. End-user demographics, primarily driven by the automotive and tire industries, influence market demand significantly. Mergers and acquisitions (M&A) activity in the sector remains moderate, with xx deals recorded in the past five years, primarily focused on consolidating production capacity and expanding geographical reach.
- Market Concentration: Approximately xx%
- Top 5 Companies Market Share: xx%
- M&A Deal Volume (2019-2024): xx deals
- Key Innovation Drivers: Improved conductivity, enhanced dispersion, sustainable production
- Competitive Substitutes: Specific alternative materials in niche applications
- Innovation Barriers: High R&D costs, stringent regulatory compliance
Carbon Black Market Growth Trends & Insights
The global carbon black market is projected to experience robust growth throughout the forecast period (2025-2033), driven by increasing demand from key end-use sectors. The market size is estimated at xx Million in 2025 and is anticipated to reach xx Million by 2033, exhibiting a CAGR of xx%. Rising vehicle production, particularly in developing economies, is fueling demand in the tire industry. Growth is also supported by expanding applications in plastics, inks, and coatings. Technological advancements, such as the development of specialized carbon blacks with enhanced properties, further contribute to market expansion. Consumer behavior shifts towards more durable and high-performance products also positively influence market growth. However, fluctuating raw material prices and environmental concerns pose potential challenges.
Dominant Regions, Countries, or Segments in Carbon Black Market
The Asia-Pacific region dominates the global carbon black market, accounting for approximately xx% of the market share in 2025. This dominance is attributed to rapid industrialization, significant automotive production, and expanding infrastructure development in countries like China and India. Within application segments, the tires and industrial rubber products sector remains the largest consumer of carbon black, holding around xx% of market share in 2025, driven by the ever-increasing demand for vehicles worldwide. Furnace black holds the largest share in the process type segment, exceeding xx% in 2025, due to its cost-effectiveness and suitability for various applications.
- Leading Region: Asia-Pacific (xx% market share in 2025)
- Key Country Drivers: China, India
- Largest Application Segment: Tires and Industrial Rubber Products (xx% market share in 2025)
- Dominant Process Type: Furnace Black (xx% market share in 2025)
- Growth Drivers: Rapid industrialization, automotive growth, infrastructure development
Carbon Black Market Product Landscape
Product innovation in the carbon black market focuses on enhancing key properties such as particle size distribution, surface area, and structure to meet specific application requirements. Manufacturers are developing specialized carbon blacks with improved conductivity, dispersion, and reinforcement characteristics. These advancements cater to the demands of high-performance applications in electric vehicles, advanced materials, and specialized coatings. The unique selling propositions often include enhanced durability, improved processing efficiency, and reduced environmental impact.
Key Drivers, Barriers & Challenges in Carbon Black Market
Key Drivers:
- Rising demand from the automotive and tire industries.
- Growth in construction and infrastructure development.
- Expanding applications in plastics, inks, and coatings.
- Technological advancements leading to enhanced product properties.
Key Challenges and Restraints:
- Fluctuating raw material prices (crude oil) impacting production costs.
- Stringent environmental regulations requiring sustainable production methods.
- Intense competition among established and emerging players.
- Supply chain disruptions impacting production and distribution. The impact of supply chain issues on overall market growth is estimated at xx%.
Emerging Opportunities in Carbon Black Market
Emerging opportunities exist in specialized high-performance applications, such as conductive inks for electronics, specialized coatings for renewable energy technologies, and advanced materials for electric vehicles. Untapped markets in developing economies present significant growth potential. Furthermore, the increasing focus on sustainability is creating opportunities for carbon black produced from recycled sources or through eco-friendly processes.
Growth Accelerators in the Carbon Black Market Industry
Technological breakthroughs in carbon black synthesis, leading to superior product performance, are driving long-term growth. Strategic partnerships between carbon black manufacturers and downstream users are enhancing supply chain efficiency and facilitating product development. Expansion into new geographical markets, particularly in developing economies with growing industrial sectors, is also a key catalyst for market expansion.
Key Players Shaping the Carbon Black Market Market
- Jiangxi Heimao Carbon Black Co Ltd
- Omsk Carbon Group
- Asahi Carbon Co Ltd
- Mitsubishi Chemical Corporation
- Cabot Corporation
- Epsilon Carbon Private Limited
- NNPC Limited
- Himadri Speciality Chemical Ltd
- ADNOC Group
- Longxing Chemical Stock Co Ltd
- PCBL Limited
- International CSRC Investment Holdings Co Ltd
- Imerys SA
- Tokai Carbon Co Ltd
- OCI Company Ltd
- BKT Carbon
- Orion Engineered Carbons SA
- Birla Carbon (Aditya Birla Group)
Notable Milestones in Carbon Black Market Sector
- June 2023: PCBL Limited announces two growth projects, expanding its manufacturing capacity to 790,000 MTPA and adding 122 MW of renewable energy.
- February 2023: BKT intensifies carbon black production, planning a near 20% capacity increase at its Bhuj plant, adding 198 kilotons per year.
- June 2022: ADNOC Distribution enters a new carbon black supply agreement with ADNOC, facilitating market testing.
In-Depth Carbon Black Market Market Outlook
The future of the carbon black market appears promising, driven by continuous innovation in product properties and expanding applications across various sectors. Strategic partnerships, investments in sustainable production technologies, and penetration into new markets will shape future growth. The market is poised to benefit from the increasing demand for high-performance materials, particularly within the automotive, electronics, and renewable energy sectors, presenting significant strategic opportunities for established and emerging players.
Carbon Black Market Segmentation
-
1. Process Type
- 1.1. Furnace Black
- 1.2. Gas Black
- 1.3. Lamp Black
- 1.4. Thermal Black
-
2. Application
- 2.1. Tires and Industrial Rubber Products
- 2.2. Plastic
- 2.3. Toners and Printing Inks
- 2.4. Coatings
- 2.5. Textile Fiber
- 2.6. Other Applications
Carbon Black Market Segmentation By Geography
-
1. Asia Pacific
- 1.1. China
- 1.2. India
- 1.3. Japan
- 1.4. South Korea
- 1.5. Rest of Asia Pacific
-
2. North America
- 2.1. United States
- 2.2. Canada
- 2.3. Mexico
-
3. Europe
- 3.1. Germany
- 3.2. United Kingdom
- 3.3. Italy
- 3.4. France
- 3.5. Rest of Europe
-
4. South America
- 4.1. Brazil
- 4.2. Argentina
- 4.3. Rest of South America
-
5. Middle East and Africa
- 5.1. Saudi Arabia
- 5.2. South Africa
- 5.3. United Arab Emirates
- 5.4. Rest of Middle East and Africa
Carbon Black Market Regional Market Share
Geographic Coverage of Carbon Black Market
Carbon Black Market REPORT HIGHLIGHTS
| Aspects | Details |
|---|---|
| Study Period | 2020-2034 |
| Base Year | 2025 |
| Estimated Year | 2026 |
| Forecast Period | 2026-2034 |
| Historical Period | 2020-2025 |
| Growth Rate | CAGR of 5.75% from 2020-2034 |
| Segmentation |
|
Table of Contents
- 1. Introduction
- 1.1. Research Scope
- 1.2. Market Segmentation
- 1.3. Research Objective
- 1.4. Definitions and Assumptions
- 2. Executive Summary
- 2.1. Market Snapshot
- 3. Market Dynamics
- 3.1. Market Drivers
- 3.2. Market Restrains
- 3.3. Market Trends
- 3.4. Market Opportunities
- 4. Market Factor Analysis
- 4.1. Porters Five Forces
- 4.1.1. Bargaining Power of Suppliers
- 4.1.2. Bargaining Power of Buyers
- 4.1.3. Threat of New Entrants
- 4.1.4. Threat of Substitutes
- 4.1.5. Competitive Rivalry
- 4.2. PESTEL analysis
- 4.3. BCG Analysis
- 4.3.1. Stars (High Growth, High Market Share)
- 4.3.2. Cash Cows (Low Growth, High Market Share)
- 4.3.3. Question Mark (High Growth, Low Market Share)
- 4.3.4. Dogs (Low Growth, Low Market Share)
- 4.4. Ansoff Matrix Analysis
- 4.5. Supply Chain Analysis
- 4.6. Regulatory Landscape
- 4.7. Current Market Potential and Opportunity Assessment (TAM–SAM–SOM Framework)
- 4.8. IMR Analyst Note
- 4.1. Porters Five Forces
- 5. Market Analysis, Insights and Forecast 2021-2033
- 5.1. Market Analysis, Insights and Forecast - by Process Type
- 5.1.1. Furnace Black
- 5.1.2. Gas Black
- 5.1.3. Lamp Black
- 5.1.4. Thermal Black
- 5.2. Market Analysis, Insights and Forecast - by Application
- 5.2.1. Tires and Industrial Rubber Products
- 5.2.2. Plastic
- 5.2.3. Toners and Printing Inks
- 5.2.4. Coatings
- 5.2.5. Textile Fiber
- 5.2.6. Other Applications
- 5.3. Market Analysis, Insights and Forecast - by Region
- 5.3.1. Asia Pacific
- 5.3.2. North America
- 5.3.3. Europe
- 5.3.4. South America
- 5.3.5. Middle East and Africa
- 5.1. Market Analysis, Insights and Forecast - by Process Type
- 6. Global Carbon Black Market Analysis, Insights and Forecast, 2021-2033
- 6.1. Market Analysis, Insights and Forecast - by Process Type
- 6.1.1. Furnace Black
- 6.1.2. Gas Black
- 6.1.3. Lamp Black
- 6.1.4. Thermal Black
- 6.2. Market Analysis, Insights and Forecast - by Application
- 6.2.1. Tires and Industrial Rubber Products
- 6.2.2. Plastic
- 6.2.3. Toners and Printing Inks
- 6.2.4. Coatings
- 6.2.5. Textile Fiber
- 6.2.6. Other Applications
- 6.1. Market Analysis, Insights and Forecast - by Process Type
- 7. Asia Pacific Carbon Black Market Analysis, Insights and Forecast, 2020-2032
- 7.1. Market Analysis, Insights and Forecast - by Process Type
- 7.1.1. Furnace Black
- 7.1.2. Gas Black
- 7.1.3. Lamp Black
- 7.1.4. Thermal Black
- 7.2. Market Analysis, Insights and Forecast - by Application
- 7.2.1. Tires and Industrial Rubber Products
- 7.2.2. Plastic
- 7.2.3. Toners and Printing Inks
- 7.2.4. Coatings
- 7.2.5. Textile Fiber
- 7.2.6. Other Applications
- 7.1. Market Analysis, Insights and Forecast - by Process Type
- 8. North America Carbon Black Market Analysis, Insights and Forecast, 2020-2032
- 8.1. Market Analysis, Insights and Forecast - by Process Type
- 8.1.1. Furnace Black
- 8.1.2. Gas Black
- 8.1.3. Lamp Black
- 8.1.4. Thermal Black
- 8.2. Market Analysis, Insights and Forecast - by Application
- 8.2.1. Tires and Industrial Rubber Products
- 8.2.2. Plastic
- 8.2.3. Toners and Printing Inks
- 8.2.4. Coatings
- 8.2.5. Textile Fiber
- 8.2.6. Other Applications
- 8.1. Market Analysis, Insights and Forecast - by Process Type
- 9. Europe Carbon Black Market Analysis, Insights and Forecast, 2020-2032
- 9.1. Market Analysis, Insights and Forecast - by Process Type
- 9.1.1. Furnace Black
- 9.1.2. Gas Black
- 9.1.3. Lamp Black
- 9.1.4. Thermal Black
- 9.2. Market Analysis, Insights and Forecast - by Application
- 9.2.1. Tires and Industrial Rubber Products
- 9.2.2. Plastic
- 9.2.3. Toners and Printing Inks
- 9.2.4. Coatings
- 9.2.5. Textile Fiber
- 9.2.6. Other Applications
- 9.1. Market Analysis, Insights and Forecast - by Process Type
- 10. South America Carbon Black Market Analysis, Insights and Forecast, 2020-2032
- 10.1. Market Analysis, Insights and Forecast - by Process Type
- 10.1.1. Furnace Black
- 10.1.2. Gas Black
- 10.1.3. Lamp Black
- 10.1.4. Thermal Black
- 10.2. Market Analysis, Insights and Forecast - by Application
- 10.2.1. Tires and Industrial Rubber Products
- 10.2.2. Plastic
- 10.2.3. Toners and Printing Inks
- 10.2.4. Coatings
- 10.2.5. Textile Fiber
- 10.2.6. Other Applications
- 10.1. Market Analysis, Insights and Forecast - by Process Type
- 11. Middle East and Africa Carbon Black Market Analysis, Insights and Forecast, 2020-2032
- 11.1. Market Analysis, Insights and Forecast - by Process Type
- 11.1.1. Furnace Black
- 11.1.2. Gas Black
- 11.1.3. Lamp Black
- 11.1.4. Thermal Black
- 11.2. Market Analysis, Insights and Forecast - by Application
- 11.2.1. Tires and Industrial Rubber Products
- 11.2.2. Plastic
- 11.2.3. Toners and Printing Inks
- 11.2.4. Coatings
- 11.2.5. Textile Fiber
- 11.2.6. Other Applications
- 11.1. Market Analysis, Insights and Forecast - by Process Type
- 12. Competitive Analysis
- 12.1. Company Profiles
- 12.1.1 Jiangxi Heimao Carbon Black Co Ltd
- 12.1.1.1. Company Overview
- 12.1.1.2. Products
- 12.1.1.3. Company Financials
- 12.1.1.4. SWOT Analysis
- 12.1.2 Omsk Carbon Group
- 12.1.2.1. Company Overview
- 12.1.2.2. Products
- 12.1.2.3. Company Financials
- 12.1.2.4. SWOT Analysis
- 12.1.3 Asahi Carbon Co Ltd
- 12.1.3.1. Company Overview
- 12.1.3.2. Products
- 12.1.3.3. Company Financials
- 12.1.3.4. SWOT Analysis
- 12.1.4 Mitsubishi Chemical Corporation
- 12.1.4.1. Company Overview
- 12.1.4.2. Products
- 12.1.4.3. Company Financials
- 12.1.4.4. SWOT Analysis
- 12.1.5 Cabot Corporation
- 12.1.5.1. Company Overview
- 12.1.5.2. Products
- 12.1.5.3. Company Financials
- 12.1.5.4. SWOT Analysis
- 12.1.6 Epsilon Carbon Private Limited
- 12.1.6.1. Company Overview
- 12.1.6.2. Products
- 12.1.6.3. Company Financials
- 12.1.6.4. SWOT Analysis
- 12.1.7 NNPC Limited
- 12.1.7.1. Company Overview
- 12.1.7.2. Products
- 12.1.7.3. Company Financials
- 12.1.7.4. SWOT Analysis
- 12.1.8 Himadri Speciality Chemical Ltd
- 12.1.8.1. Company Overview
- 12.1.8.2. Products
- 12.1.8.3. Company Financials
- 12.1.8.4. SWOT Analysis
- 12.1.9 ADNOC Group
- 12.1.9.1. Company Overview
- 12.1.9.2. Products
- 12.1.9.3. Company Financials
- 12.1.9.4. SWOT Analysis
- 12.1.10 Longxing Chemical Stock Co Ltd
- 12.1.10.1. Company Overview
- 12.1.10.2. Products
- 12.1.10.3. Company Financials
- 12.1.10.4. SWOT Analysis
- 12.1.11 PCBL Limited
- 12.1.11.1. Company Overview
- 12.1.11.2. Products
- 12.1.11.3. Company Financials
- 12.1.11.4. SWOT Analysis
- 12.1.12 International CSRC Investment Holdings Co Ltd
- 12.1.12.1. Company Overview
- 12.1.12.2. Products
- 12.1.12.3. Company Financials
- 12.1.12.4. SWOT Analysis
- 12.1.13 Imerys SA
- 12.1.13.1. Company Overview
- 12.1.13.2. Products
- 12.1.13.3. Company Financials
- 12.1.13.4. SWOT Analysis
- 12.1.14 Tokai Carbon Co Ltd*List Not Exhaustive
- 12.1.14.1. Company Overview
- 12.1.14.2. Products
- 12.1.14.3. Company Financials
- 12.1.14.4. SWOT Analysis
- 12.1.15 OCI Company Ltd
- 12.1.15.1. Company Overview
- 12.1.15.2. Products
- 12.1.15.3. Company Financials
- 12.1.15.4. SWOT Analysis
- 12.1.16 BKT Carbon
- 12.1.16.1. Company Overview
- 12.1.16.2. Products
- 12.1.16.3. Company Financials
- 12.1.16.4. SWOT Analysis
- 12.1.17 Orion Engineered Carbons SA
- 12.1.17.1. Company Overview
- 12.1.17.2. Products
- 12.1.17.3. Company Financials
- 12.1.17.4. SWOT Analysis
- 12.1.18 Birla Carbon (Aditya Birla Group)
- 12.1.18.1. Company Overview
- 12.1.18.2. Products
- 12.1.18.3. Company Financials
- 12.1.18.4. SWOT Analysis
- 12.1.1 Jiangxi Heimao Carbon Black Co Ltd
- 12.2. Market Entropy
- 12.2.1 Company's Key Areas Served
- 12.2.2 Recent Developments
- 12.3. Company Market Share Analysis 2025
- 12.3.1 Top 5 Companies Market Share Analysis
- 12.3.2 Top 3 Companies Market Share Analysis
- 12.4. List of Potential Customers
- 13. Research Methodology
List of Figures
- Figure 1: Global Carbon Black Market Revenue Breakdown (Million, %) by Region 2025 & 2033
- Figure 2: Asia Pacific Carbon Black Market Revenue (Million), by Process Type 2025 & 2033
- Figure 3: Asia Pacific Carbon Black Market Revenue Share (%), by Process Type 2025 & 2033
- Figure 4: Asia Pacific Carbon Black Market Revenue (Million), by Application 2025 & 2033
- Figure 5: Asia Pacific Carbon Black Market Revenue Share (%), by Application 2025 & 2033
- Figure 6: Asia Pacific Carbon Black Market Revenue (Million), by Country 2025 & 2033
- Figure 7: Asia Pacific Carbon Black Market Revenue Share (%), by Country 2025 & 2033
- Figure 8: North America Carbon Black Market Revenue (Million), by Process Type 2025 & 2033
- Figure 9: North America Carbon Black Market Revenue Share (%), by Process Type 2025 & 2033
- Figure 10: North America Carbon Black Market Revenue (Million), by Application 2025 & 2033
- Figure 11: North America Carbon Black Market Revenue Share (%), by Application 2025 & 2033
- Figure 12: North America Carbon Black Market Revenue (Million), by Country 2025 & 2033
- Figure 13: North America Carbon Black Market Revenue Share (%), by Country 2025 & 2033
- Figure 14: Europe Carbon Black Market Revenue (Million), by Process Type 2025 & 2033
- Figure 15: Europe Carbon Black Market Revenue Share (%), by Process Type 2025 & 2033
- Figure 16: Europe Carbon Black Market Revenue (Million), by Application 2025 & 2033
- Figure 17: Europe Carbon Black Market Revenue Share (%), by Application 2025 & 2033
- Figure 18: Europe Carbon Black Market Revenue (Million), by Country 2025 & 2033
- Figure 19: Europe Carbon Black Market Revenue Share (%), by Country 2025 & 2033
- Figure 20: South America Carbon Black Market Revenue (Million), by Process Type 2025 & 2033
- Figure 21: South America Carbon Black Market Revenue Share (%), by Process Type 2025 & 2033
- Figure 22: South America Carbon Black Market Revenue (Million), by Application 2025 & 2033
- Figure 23: South America Carbon Black Market Revenue Share (%), by Application 2025 & 2033
- Figure 24: South America Carbon Black Market Revenue (Million), by Country 2025 & 2033
- Figure 25: South America Carbon Black Market Revenue Share (%), by Country 2025 & 2033
- Figure 26: Middle East and Africa Carbon Black Market Revenue (Million), by Process Type 2025 & 2033
- Figure 27: Middle East and Africa Carbon Black Market Revenue Share (%), by Process Type 2025 & 2033
- Figure 28: Middle East and Africa Carbon Black Market Revenue (Million), by Application 2025 & 2033
- Figure 29: Middle East and Africa Carbon Black Market Revenue Share (%), by Application 2025 & 2033
- Figure 30: Middle East and Africa Carbon Black Market Revenue (Million), by Country 2025 & 2033
- Figure 31: Middle East and Africa Carbon Black Market Revenue Share (%), by Country 2025 & 2033
List of Tables
- Table 1: Global Carbon Black Market Revenue Million Forecast, by Process Type 2020 & 2033
- Table 2: Global Carbon Black Market Revenue Million Forecast, by Application 2020 & 2033
- Table 3: Global Carbon Black Market Revenue Million Forecast, by Region 2020 & 2033
- Table 4: Global Carbon Black Market Revenue Million Forecast, by Process Type 2020 & 2033
- Table 5: Global Carbon Black Market Revenue Million Forecast, by Application 2020 & 2033
- Table 6: Global Carbon Black Market Revenue Million Forecast, by Country 2020 & 2033
- Table 7: China Carbon Black Market Revenue (Million) Forecast, by Application 2020 & 2033
- Table 8: India Carbon Black Market Revenue (Million) Forecast, by Application 2020 & 2033
- Table 9: Japan Carbon Black Market Revenue (Million) Forecast, by Application 2020 & 2033
- Table 10: South Korea Carbon Black Market Revenue (Million) Forecast, by Application 2020 & 2033
- Table 11: Rest of Asia Pacific Carbon Black Market Revenue (Million) Forecast, by Application 2020 & 2033
- Table 12: Global Carbon Black Market Revenue Million Forecast, by Process Type 2020 & 2033
- Table 13: Global Carbon Black Market Revenue Million Forecast, by Application 2020 & 2033
- Table 14: Global Carbon Black Market Revenue Million Forecast, by Country 2020 & 2033
- Table 15: United States Carbon Black Market Revenue (Million) Forecast, by Application 2020 & 2033
- Table 16: Canada Carbon Black Market Revenue (Million) Forecast, by Application 2020 & 2033
- Table 17: Mexico Carbon Black Market Revenue (Million) Forecast, by Application 2020 & 2033
- Table 18: Global Carbon Black Market Revenue Million Forecast, by Process Type 2020 & 2033
- Table 19: Global Carbon Black Market Revenue Million Forecast, by Application 2020 & 2033
- Table 20: Global Carbon Black Market Revenue Million Forecast, by Country 2020 & 2033
- Table 21: Germany Carbon Black Market Revenue (Million) Forecast, by Application 2020 & 2033
- Table 22: United Kingdom Carbon Black Market Revenue (Million) Forecast, by Application 2020 & 2033
- Table 23: Italy Carbon Black Market Revenue (Million) Forecast, by Application 2020 & 2033
- Table 24: France Carbon Black Market Revenue (Million) Forecast, by Application 2020 & 2033
- Table 25: Rest of Europe Carbon Black Market Revenue (Million) Forecast, by Application 2020 & 2033
- Table 26: Global Carbon Black Market Revenue Million Forecast, by Process Type 2020 & 2033
- Table 27: Global Carbon Black Market Revenue Million Forecast, by Application 2020 & 2033
- Table 28: Global Carbon Black Market Revenue Million Forecast, by Country 2020 & 2033
- Table 29: Brazil Carbon Black Market Revenue (Million) Forecast, by Application 2020 & 2033
- Table 30: Argentina Carbon Black Market Revenue (Million) Forecast, by Application 2020 & 2033
- Table 31: Rest of South America Carbon Black Market Revenue (Million) Forecast, by Application 2020 & 2033
- Table 32: Global Carbon Black Market Revenue Million Forecast, by Process Type 2020 & 2033
- Table 33: Global Carbon Black Market Revenue Million Forecast, by Application 2020 & 2033
- Table 34: Global Carbon Black Market Revenue Million Forecast, by Country 2020 & 2033
- Table 35: Saudi Arabia Carbon Black Market Revenue (Million) Forecast, by Application 2020 & 2033
- Table 36: South Africa Carbon Black Market Revenue (Million) Forecast, by Application 2020 & 2033
- Table 37: United Arab Emirates Carbon Black Market Revenue (Million) Forecast, by Application 2020 & 2033
- Table 38: Rest of Middle East and Africa Carbon Black Market Revenue (Million) Forecast, by Application 2020 & 2033
Frequently Asked Questions
1. What is the projected Compound Annual Growth Rate (CAGR) of the Carbon Black Market?
The projected CAGR is approximately 5.75%.
2. Which companies are prominent players in the Carbon Black Market?
Key companies in the market include Jiangxi Heimao Carbon Black Co Ltd, Omsk Carbon Group, Asahi Carbon Co Ltd, Mitsubishi Chemical Corporation, Cabot Corporation, Epsilon Carbon Private Limited, NNPC Limited, Himadri Speciality Chemical Ltd, ADNOC Group, Longxing Chemical Stock Co Ltd, PCBL Limited, International CSRC Investment Holdings Co Ltd, Imerys SA, Tokai Carbon Co Ltd*List Not Exhaustive, OCI Company Ltd, BKT Carbon, Orion Engineered Carbons SA, Birla Carbon (Aditya Birla Group).
3. What are the main segments of the Carbon Black Market?
The market segments include Process Type, Application.
4. Can you provide details about the market size?
The market size is estimated to be USD 22.79 Million as of 2022.
5. What are some drivers contributing to market growth?
Increasing Market Penetration of Specialty Black; Growing Applications in the Batteries Segment.
6. What are the notable trends driving market growth?
Increasing Application of Tires and Industrial Rubber Products.
7. Are there any restraints impacting market growth?
Increasing Investments for Recovered Carbon Black; Volatility in Prices of Raw Materials.
8. Can you provide examples of recent developments in the market?
June 2023: PCBL Limited initiated two growth projects which incorporate the new plant expansion in Chennai, Tamil Nadu, and an existing plant project at Mundra, Gujarat. This expansion is divided into two stages, and the first stage of the specialty chemical line is expected to be put into operation by the first quarter of the fiscal year 2023-24. As a result, the overall manufacturing capacity of the company is estimated to reach 790,000 MTPA and 122 MW of renewable energy.
9. What pricing options are available for accessing the report?
Pricing options include single-user, multi-user, and enterprise licenses priced at USD 4750, USD 5250, and USD 8750 respectively.
10. Is the market size provided in terms of value or volume?
The market size is provided in terms of value, measured in Million.
11. Are there any specific market keywords associated with the report?
Yes, the market keyword associated with the report is "Carbon Black Market," which aids in identifying and referencing the specific market segment covered.
12. How do I determine which pricing option suits my needs best?
The pricing options vary based on user requirements and access needs. Individual users may opt for single-user licenses, while businesses requiring broader access may choose multi-user or enterprise licenses for cost-effective access to the report.
13. Are there any additional resources or data provided in the Carbon Black Market report?
While the report offers comprehensive insights, it's advisable to review the specific contents or supplementary materials provided to ascertain if additional resources or data are available.
14. How can I stay updated on further developments or reports in the Carbon Black Market?
To stay informed about further developments, trends, and reports in the Carbon Black Market, consider subscribing to industry newsletters, following relevant companies and organizations, or regularly checking reputable industry news sources and publications.
Methodology
Step 1 - Identification of Relevant Samples Size from Population Database


Step 2 - Approaches for Defining Global Market Size (Value, Volume* & Price*)

Note*: In applicable scenarios
Step 3 - Data Sources
Primary Research
- Web Analytics
- Survey Reports
- Research Institute
- Latest Research Reports
- Opinion Leaders
Secondary Research
- Annual Reports
- White Paper
- Latest Press Release
- Industry Association
- Paid Database
- Investor Presentations

Step 4 - Data Triangulation
Involves using different sources of information in order to increase the validity of a study
These sources are likely to be stakeholders in a program - participants, other researchers, program staff, other community members, and so on.
Then we put all data in single framework & apply various statistical tools to find out the dynamic on the market.
During the analysis stage, feedback from the stakeholder groups would be compared to determine areas of agreement as well as areas of divergence