

Key Insights
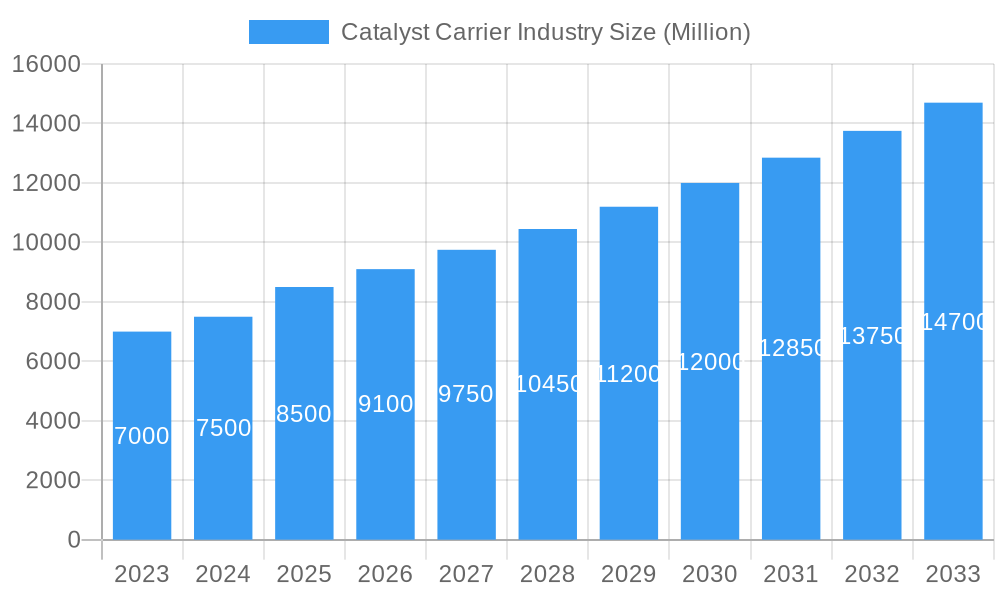
The global Catalyst Carrier Market is poised for robust expansion, projected to reach an estimated $8,500 million by 2025, with a Compound Annual Growth Rate (CAGR) exceeding 5.00% throughout the forecast period of 2025-2033. This significant growth is primarily propelled by the escalating demand across diverse end-user industries, most notably the Oil and Gas and Chemical Manufacturing sectors, where catalyst carriers are indispensable for enhancing reaction efficiency and selectivity. The burgeoning need for cleaner fuel production, stringent environmental regulations mandating reduced emissions, and the continuous development of novel catalytic processes further fuel market momentum. Advancements in material science are leading to the creation of more durable, high-performance catalyst carriers, such as advanced ceramics and specialized zeolites, capable of withstanding extreme operating conditions and extending catalyst lifespan. This innovation is a key driver for market penetration and value creation.
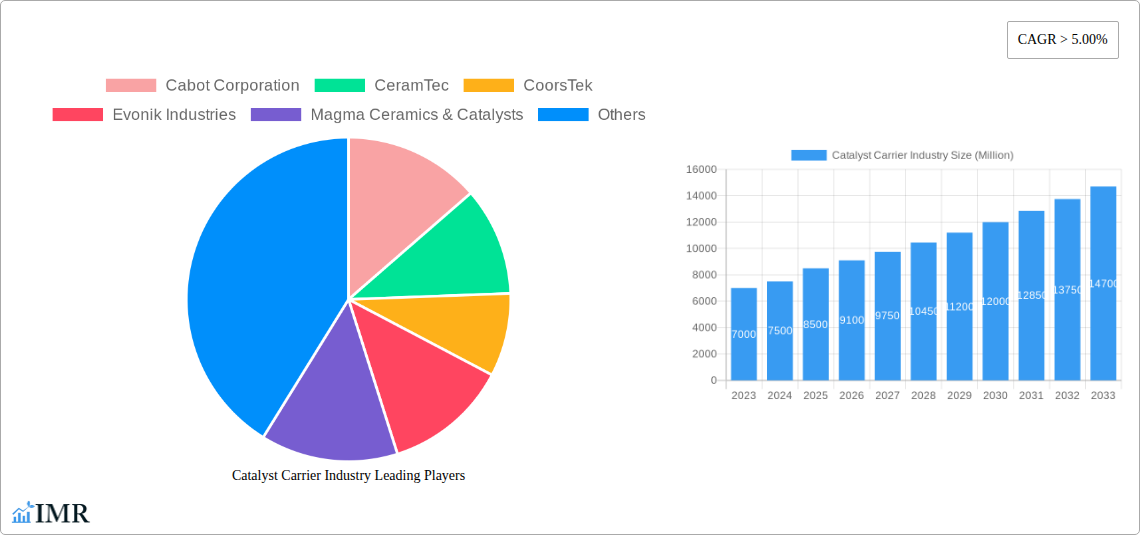
Catalyst Carrier Industry Market Size (In Billion)
The market dynamics are further shaped by emerging trends like the increasing adoption of tailored catalyst carrier solutions for specific applications, reflecting a move towards greater process optimization. The shift towards sustainable chemical manufacturing and the growing interest in renewable energy sources, such as biofuel production, are also creating new avenues for catalyst carrier application. While the market demonstrates a strong upward trajectory, certain restraints such as the high initial cost of advanced catalyst materials and the complex recycling processes for spent catalysts can pose challenges. However, ongoing research and development efforts aimed at cost reduction and improved sustainability are expected to mitigate these concerns. The market is characterized by the presence of established global players, including Cabot Corporation, CeramTec, and Saint-Gobain, alongside emerging innovators, all contributing to a competitive landscape driven by product innovation and strategic collaborations.
Catalyst Carrier Industry Company Market Share
This in-depth report provides a definitive analysis of the global Catalyst Carrier industry, offering unparalleled insights into market dynamics, growth trajectories, and future potential. Covering the period from 2019 to 2033, with a base year of 2025, this study is an indispensable resource for industry stakeholders, investors, and strategists seeking to navigate this evolving landscape.
Catalyst Carrier Industry Market Dynamics & Structure
The Catalyst Carrier industry exhibits a moderately concentrated market structure, characterized by the strategic presence of established global players alongside a growing number of specialized manufacturers. Technological innovation serves as a primary driver, particularly in the development of novel materials with enhanced surface area, pore structure, and thermal stability. Stringent regulatory frameworks, primarily focused on environmental emissions and process efficiency in end-user industries like oil and gas and chemical manufacturing, are shaping product development and adoption.
- Market Concentration: Dominated by a few key players, but with increasing fragmentation in niche segments.
- Technological Innovation: Driven by demand for higher catalytic activity, selectivity, and longevity. Key areas include advanced material science and nanotechnologies.
- Regulatory Frameworks: Environmental regulations (e.g., emissions standards) and process safety mandates are key influences.
- Competitive Product Substitutes: While direct substitutes are limited, advancements in alternative catalytic processes or materials can pose indirect competition.
- End-User Demographics: A growing demand from the automotive sector for cleaner emissions and from the oil and gas sector for more efficient refining processes.
- M&A Trends: Acquisitions are focused on expanding technological capabilities, market reach, and product portfolios. Deal volumes in the parent market are projected to be around 50-70 deals annually between 2025-2028.
Catalyst Carrier Industry Growth Trends & Insights
The Catalyst Carrier industry is poised for robust growth, driven by increasing global demand for cleaner energy, more efficient chemical processes, and advanced manufacturing techniques. The parent market for catalyst carriers is projected to reach approximately $12,500 million by 2025, with the child market (specialized and advanced carriers) estimated at $4,200 million in the same year. This growth is underpinned by a projected Compound Annual Growth Rate (CAGR) of 6.5% for the parent market and 7.2% for the child market during the forecast period of 2025–2033.
The historical period (2019–2024) witnessed steady expansion, with the parent market growing from an estimated $9,800 million to $11,800 million. Adoption rates of advanced catalyst carriers are accelerating, particularly in emerging economies, as industries strive to meet stringent environmental regulations and enhance operational efficiency. Technological disruptions are primarily focused on the development of lightweight, high-strength, and environmentally sustainable carrier materials, including novel ceramic formulations and advanced zeolites. Consumer behavior shifts are evident in the increasing preference for carriers that offer a lower environmental footprint and extended operational lifespan, thereby reducing waste and maintenance costs. Market penetration of high-performance catalyst carriers in the automotive and chemical manufacturing sectors is expected to surge by 15% and 12% respectively by 2028.
Dominant Regions, Countries, or Segments in Catalyst Carrier Industry
The Asia Pacific region is emerging as the dominant force in the Catalyst Carrier industry, driven by rapid industrialization, significant investments in chemical manufacturing and automotive production, and a growing focus on environmental sustainability. Within Asia Pacific, China stands out as a key country, accounting for an estimated 35% of the global market share in 2025. This dominance is fueled by its extensive manufacturing base, proactive government initiatives supporting green technologies, and substantial demand from its burgeoning automotive and petrochemical sectors.
Dominant Segment (Product Type): Ceramics
- Market Share (2025): Approximately 45% of the global market.
- Key Drivers: Superior thermal stability, chemical inertness, and structural integrity, making them ideal for high-temperature and corrosive applications in oil and gas refining and chemical synthesis. Innovations in tailored porosity and surface functionalization are further enhancing their performance.
- Growth Potential: High, particularly with the development of advanced ceramic composites.
Dominant Segment (Material Type): Alumina
- Market Share (2025): Estimated at 30% of the global market.
- Key Drivers: Versatility, cost-effectiveness, and good mechanical strength. Widely used in various catalytic processes across multiple industries.
- Growth Potential: Steady, with continued demand in established applications.
Dominant Segment (End-user Industry): Oil and Gas
- Market Share (2025): Expected to hold around 38% of the market.
- Key Drivers: Essential for refining processes such as hydrocracking, catalytic cracking, and reforming. The increasing global demand for refined petroleum products and the need for more efficient extraction and processing drive this segment.
- Growth Potential: Moderate to high, influenced by energy market dynamics and the transition towards cleaner fuels.
Economic policies promoting industrial growth and infrastructure development in countries like China and India are significant contributors to the dominance of the Asia Pacific region. Furthermore, stringent environmental regulations in developed nations are also indirectly boosting demand for advanced catalyst carriers that enable cleaner emissions, thereby benefiting regional players with superior technological capabilities. The Honeycomb shape is also gaining significant traction due to its high surface area to volume ratio and low-pressure drop, particularly in automotive catalysts, contributing to its market prominence.
Catalyst Carrier Industry Product Landscape
The catalyst carrier product landscape is characterized by continuous innovation aimed at enhancing catalytic efficiency and application-specific performance. Key product advancements include the development of nanoporous alumina and silica carriers with precisely controlled pore sizes and surface chemistries, significantly boosting active site accessibility and reaction rates. Ceramic monoliths with intricate honeycomb structures are gaining prominence in automotive exhaust systems for their exceptional thermal shock resistance and high geometric surface area, enabling efficient catalytic conversion of pollutants.
Novel zeolite-based carriers are being engineered for specialized applications in petrochemical cracking and selective catalytic reduction (SCR) systems, offering tailored acidity and molecular sieving properties. The incorporation of rare earth elements and precious metals onto these carriers is further enhancing their catalytic activity and selectivity. Unique selling propositions lie in carriers offering extended operational lifetimes, reduced attrition rates, and improved resistance to poisoning, directly translating to lower operating costs and enhanced sustainability for end-users.
Key Drivers, Barriers & Challenges in Catalyst Carrier Industry
Key Drivers:
- Stringent Environmental Regulations: Driving demand for efficient catalytic processes to reduce emissions in automotive, oil and gas, and chemical manufacturing.
- Growing Demand for Petrochemicals and Fuels: Underpinning the need for advanced refining and processing catalysts.
- Technological Advancements: Development of novel materials with enhanced surface area, porosity, and thermal stability.
- Growth in Automotive Sector: Especially the increasing adoption of catalytic converters for emission control.
- Focus on Process Efficiency: Industries are seeking catalysts that improve yield, selectivity, and energy efficiency.
Barriers & Challenges:
- High R&D Costs: Developing new and advanced catalyst carriers requires significant investment in research and development.
- Supply Chain Volatility: Fluctuations in the availability and cost of raw materials like alumina, silica, and zeolites.
- Complex Manufacturing Processes: Achieving precise material properties and intricate shapes can be challenging and costly.
- Price Sensitivity of End-Users: Particularly in commodity chemical production, there is pressure to keep catalyst costs low.
- Competition from Emerging Technologies: While not direct substitutes, alternative catalytic approaches or process innovations can impact demand.
- Navigating Global Trade and Tariffs: Can impact the cost and accessibility of raw materials and finished products.
Emerging Opportunities in Catalyst Carrier Industry
Emerging opportunities within the Catalyst Carrier industry are largely centered around the development of sustainable and high-performance solutions. The burgeoning demand for green hydrogen production presents a significant avenue, requiring specialized carriers for electrolysis and fuel cell applications. Furthermore, the increasing focus on carbon capture and utilization (CCU) technologies necessitates novel carriers capable of supporting catalysts for CO2 conversion into valuable chemicals.
The pharmaceutical industry's growing reliance on complex synthesis and chiral catalysis offers a niche for highly selective and pure catalyst carriers. Innovations in additive manufacturing (3D printing) are also opening doors for the creation of complex, customized catalyst carrier geometries, enabling unprecedented control over flow dynamics and reaction environments. The development of biodegradable or recyclable catalyst carriers is another area poised for growth, aligning with global sustainability initiatives.
Growth Accelerators in the Catalyst Carrier Industry Industry
Several key factors are accelerating the growth trajectory of the Catalyst Carrier industry. Technological breakthroughs in nanomaterial synthesis and advanced ceramic engineering are leading to carriers with superior performance characteristics, such as significantly increased surface area and optimized pore architectures. The automotive sector's robust demand for emission control technologies, coupled with evolving regulatory standards worldwide, acts as a consistent growth accelerator.
Strategic partnerships between catalyst manufacturers and end-users, particularly in the oil and gas and chemical sectors, foster collaborative innovation and accelerate the adoption of new carrier technologies tailored to specific process needs. Furthermore, the increasing global emphasis on circular economy principles and sustainable manufacturing is driving the development and adoption of carriers that offer longer lifespans and are more amenable to regeneration or recycling.
Key Players Shaping the Catalyst Carrier Industry Market
- Cabot Corporation
- CeramTec
- CoorsTek
- Evonik Industries
- Magma Ceramics & Catalysts
- Noritake Co Limited
- Saint-Gobain
- Sasol Performance Chemicals
- ALMATIS AN OYAK GROUP COMPANY
- W R Grace & Co -Conn
Notable Milestones in Catalyst Carrier Industry Sector
- 2019: Launch of a new generation of highly porous alumina carriers by leading manufacturers, offering increased active site dispersion.
- 2020: Increased investment in R&D for zeolite-based carriers for selective catalytic reduction (SCR) applications, driven by stricter NOx emission standards.
- 2021: Significant M&A activity in the parent market, with larger players acquiring specialized ceramic or activated carbon carrier manufacturers to expand portfolios.
- 2022: Advancements in honeycomb monolith production technologies for automotive catalytic converters, enabling thinner walls and higher cell densities.
- 2023: Growing interest and pilot projects exploring catalyst carriers for CO2 conversion technologies and green hydrogen production.
- 2024: Introduction of advanced composite carriers incorporating novel binders for improved mechanical strength and thermal stability in extreme operating conditions.
In-Depth Catalyst Carrier Industry Market Outlook
The future outlook for the Catalyst Carrier industry is exceptionally promising, driven by an confluence of global megatrends. The relentless pursuit of cleaner energy solutions, stricter environmental regulations across major economies, and the continuous drive for enhanced industrial process efficiency will fuel sustained demand for advanced catalyst carriers. Strategic opportunities lie in the burgeoning markets for renewable energy catalysts, advanced petrochemical processes, and innovative pharmaceutical synthesis. Continued investment in research and development, particularly in areas like nanotechnology, advanced materials science, and additive manufacturing, will be crucial for market leaders to maintain their competitive edge and capitalize on emerging application areas. The industry is set for significant value creation as it moves towards more specialized, high-performance, and sustainable carrier solutions.
Catalyst Carrier Industry Segmentation
-
1. Product Type
- 1.1. Ceramics
- 1.2. Activated Carbon
- 1.3. Zeolites
- 1.4. Other Product Types
-
2. Material Type
- 2.1. Alumina
- 2.2. Titania
- 2.3. Zirconia
- 2.4. Silica
- 2.5. Other Material Types
-
3. Shape
- 3.1. Sphere
- 3.2. Ring
- 3.3. Honeycomb
- 3.4. Other Shapes
-
4. End-user Industry
- 4.1. Oil and Gas
- 4.2. Chemical Manufacturing
- 4.3. Automotive
- 4.4. Pharmaceuticals
- 4.5. Other End-user Industries
Catalyst Carrier Industry Segmentation By Geography
-
1. Asia Pacific
- 1.1. China
- 1.2. India
- 1.3. Japan
- 1.4. South Korea
- 1.5. Rest of Asia Pacific
-
2. North America
- 2.1. United States
- 2.2. Canada
- 2.3. Mexico
-
3. Europe
- 3.1. Germany
- 3.2. United Kingdom
- 3.3. France
- 3.4. Italy
- 3.5. Rest of Europe
-
4. South America
- 4.1. Brazil
- 4.2. Argentina
- 4.3. Rest of South America
-
5. Middle East and Africa
- 5.1. Saudi Arabia
- 5.2. South Africa
- 5.3. Rest of Middle East and Africa
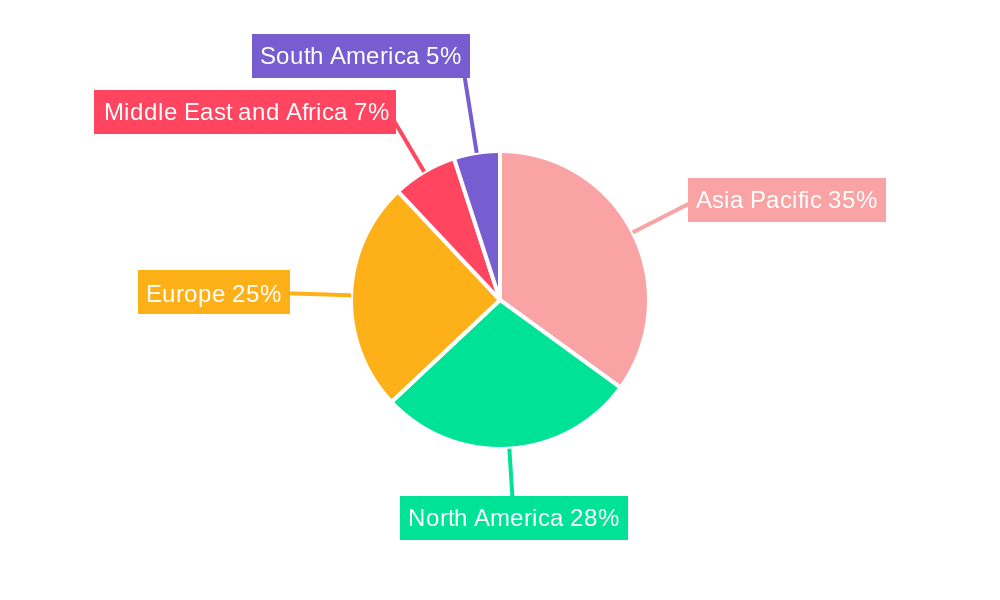
Catalyst Carrier Industry Regional Market Share
Geographic Coverage of Catalyst Carrier Industry
Catalyst Carrier Industry REPORT HIGHLIGHTS
| Aspects | Details |
|---|---|
| Study Period | 2020-2034 |
| Base Year | 2025 |
| Estimated Year | 2026 |
| Forecast Period | 2026-2034 |
| Historical Period | 2020-2025 |
| Growth Rate | CAGR of 4.8% from 2020-2034 |
| Segmentation |
|
Table of Contents
- 1. Introduction
- 1.1. Research Scope
- 1.2. Market Segmentation
- 1.3. Research Objective
- 1.4. Definitions and Assumptions
- 2. Executive Summary
- 2.1. Market Snapshot
- 3. Market Dynamics
- 3.1. Market Drivers
- 3.2. Market Restrains
- 3.3. Market Trends
- 3.4. Market Opportunities
- 4. Market Factor Analysis
- 4.1. Porters Five Forces
- 4.1.1. Bargaining Power of Suppliers
- 4.1.2. Bargaining Power of Buyers
- 4.1.3. Threat of New Entrants
- 4.1.4. Threat of Substitutes
- 4.1.5. Competitive Rivalry
- 4.2. PESTEL analysis
- 4.3. BCG Analysis
- 4.3.1. Stars (High Growth, High Market Share)
- 4.3.2. Cash Cows (Low Growth, High Market Share)
- 4.3.3. Question Mark (High Growth, Low Market Share)
- 4.3.4. Dogs (Low Growth, Low Market Share)
- 4.4. Ansoff Matrix Analysis
- 4.5. Supply Chain Analysis
- 4.6. Regulatory Landscape
- 4.7. Current Market Potential and Opportunity Assessment (TAM–SAM–SOM Framework)
- 4.8. IMR Analyst Note
- 4.1. Porters Five Forces
- 5. Market Analysis, Insights and Forecast 2021-2033
- 5.1. Market Analysis, Insights and Forecast - by Product Type
- 5.1.1. Ceramics
- 5.1.2. Activated Carbon
- 5.1.3. Zeolites
- 5.1.4. Other Product Types
- 5.2. Market Analysis, Insights and Forecast - by Material Type
- 5.2.1. Alumina
- 5.2.2. Titania
- 5.2.3. Zirconia
- 5.2.4. Silica
- 5.2.5. Other Material Types
- 5.3. Market Analysis, Insights and Forecast - by Shape
- 5.3.1. Sphere
- 5.3.2. Ring
- 5.3.3. Honeycomb
- 5.3.4. Other Shapes
- 5.4. Market Analysis, Insights and Forecast - by End-user Industry
- 5.4.1. Oil and Gas
- 5.4.2. Chemical Manufacturing
- 5.4.3. Automotive
- 5.4.4. Pharmaceuticals
- 5.4.5. Other End-user Industries
- 5.5. Market Analysis, Insights and Forecast - by Region
- 5.5.1. Asia Pacific
- 5.5.2. North America
- 5.5.3. Europe
- 5.5.4. South America
- 5.5.5. Middle East and Africa
- 5.1. Market Analysis, Insights and Forecast - by Product Type
- 6. Global Catalyst Carrier Industry Analysis, Insights and Forecast, 2021-2033
- 6.1. Market Analysis, Insights and Forecast - by Product Type
- 6.1.1. Ceramics
- 6.1.2. Activated Carbon
- 6.1.3. Zeolites
- 6.1.4. Other Product Types
- 6.2. Market Analysis, Insights and Forecast - by Material Type
- 6.2.1. Alumina
- 6.2.2. Titania
- 6.2.3. Zirconia
- 6.2.4. Silica
- 6.2.5. Other Material Types
- 6.3. Market Analysis, Insights and Forecast - by Shape
- 6.3.1. Sphere
- 6.3.2. Ring
- 6.3.3. Honeycomb
- 6.3.4. Other Shapes
- 6.4. Market Analysis, Insights and Forecast - by End-user Industry
- 6.4.1. Oil and Gas
- 6.4.2. Chemical Manufacturing
- 6.4.3. Automotive
- 6.4.4. Pharmaceuticals
- 6.4.5. Other End-user Industries
- 6.1. Market Analysis, Insights and Forecast - by Product Type
- 7. Asia Pacific Catalyst Carrier Industry Analysis, Insights and Forecast, 2020-2032
- 7.1. Market Analysis, Insights and Forecast - by Product Type
- 7.1.1. Ceramics
- 7.1.2. Activated Carbon
- 7.1.3. Zeolites
- 7.1.4. Other Product Types
- 7.2. Market Analysis, Insights and Forecast - by Material Type
- 7.2.1. Alumina
- 7.2.2. Titania
- 7.2.3. Zirconia
- 7.2.4. Silica
- 7.2.5. Other Material Types
- 7.3. Market Analysis, Insights and Forecast - by Shape
- 7.3.1. Sphere
- 7.3.2. Ring
- 7.3.3. Honeycomb
- 7.3.4. Other Shapes
- 7.4. Market Analysis, Insights and Forecast - by End-user Industry
- 7.4.1. Oil and Gas
- 7.4.2. Chemical Manufacturing
- 7.4.3. Automotive
- 7.4.4. Pharmaceuticals
- 7.4.5. Other End-user Industries
- 7.1. Market Analysis, Insights and Forecast - by Product Type
- 8. North America Catalyst Carrier Industry Analysis, Insights and Forecast, 2020-2032
- 8.1. Market Analysis, Insights and Forecast - by Product Type
- 8.1.1. Ceramics
- 8.1.2. Activated Carbon
- 8.1.3. Zeolites
- 8.1.4. Other Product Types
- 8.2. Market Analysis, Insights and Forecast - by Material Type
- 8.2.1. Alumina
- 8.2.2. Titania
- 8.2.3. Zirconia
- 8.2.4. Silica
- 8.2.5. Other Material Types
- 8.3. Market Analysis, Insights and Forecast - by Shape
- 8.3.1. Sphere
- 8.3.2. Ring
- 8.3.3. Honeycomb
- 8.3.4. Other Shapes
- 8.4. Market Analysis, Insights and Forecast - by End-user Industry
- 8.4.1. Oil and Gas
- 8.4.2. Chemical Manufacturing
- 8.4.3. Automotive
- 8.4.4. Pharmaceuticals
- 8.4.5. Other End-user Industries
- 8.1. Market Analysis, Insights and Forecast - by Product Type
- 9. Europe Catalyst Carrier Industry Analysis, Insights and Forecast, 2020-2032
- 9.1. Market Analysis, Insights and Forecast - by Product Type
- 9.1.1. Ceramics
- 9.1.2. Activated Carbon
- 9.1.3. Zeolites
- 9.1.4. Other Product Types
- 9.2. Market Analysis, Insights and Forecast - by Material Type
- 9.2.1. Alumina
- 9.2.2. Titania
- 9.2.3. Zirconia
- 9.2.4. Silica
- 9.2.5. Other Material Types
- 9.3. Market Analysis, Insights and Forecast - by Shape
- 9.3.1. Sphere
- 9.3.2. Ring
- 9.3.3. Honeycomb
- 9.3.4. Other Shapes
- 9.4. Market Analysis, Insights and Forecast - by End-user Industry
- 9.4.1. Oil and Gas
- 9.4.2. Chemical Manufacturing
- 9.4.3. Automotive
- 9.4.4. Pharmaceuticals
- 9.4.5. Other End-user Industries
- 9.1. Market Analysis, Insights and Forecast - by Product Type
- 10. South America Catalyst Carrier Industry Analysis, Insights and Forecast, 2020-2032
- 10.1. Market Analysis, Insights and Forecast - by Product Type
- 10.1.1. Ceramics
- 10.1.2. Activated Carbon
- 10.1.3. Zeolites
- 10.1.4. Other Product Types
- 10.2. Market Analysis, Insights and Forecast - by Material Type
- 10.2.1. Alumina
- 10.2.2. Titania
- 10.2.3. Zirconia
- 10.2.4. Silica
- 10.2.5. Other Material Types
- 10.3. Market Analysis, Insights and Forecast - by Shape
- 10.3.1. Sphere
- 10.3.2. Ring
- 10.3.3. Honeycomb
- 10.3.4. Other Shapes
- 10.4. Market Analysis, Insights and Forecast - by End-user Industry
- 10.4.1. Oil and Gas
- 10.4.2. Chemical Manufacturing
- 10.4.3. Automotive
- 10.4.4. Pharmaceuticals
- 10.4.5. Other End-user Industries
- 10.1. Market Analysis, Insights and Forecast - by Product Type
- 11. Middle East and Africa Catalyst Carrier Industry Analysis, Insights and Forecast, 2020-2032
- 11.1. Market Analysis, Insights and Forecast - by Product Type
- 11.1.1. Ceramics
- 11.1.2. Activated Carbon
- 11.1.3. Zeolites
- 11.1.4. Other Product Types
- 11.2. Market Analysis, Insights and Forecast - by Material Type
- 11.2.1. Alumina
- 11.2.2. Titania
- 11.2.3. Zirconia
- 11.2.4. Silica
- 11.2.5. Other Material Types
- 11.3. Market Analysis, Insights and Forecast - by Shape
- 11.3.1. Sphere
- 11.3.2. Ring
- 11.3.3. Honeycomb
- 11.3.4. Other Shapes
- 11.4. Market Analysis, Insights and Forecast - by End-user Industry
- 11.4.1. Oil and Gas
- 11.4.2. Chemical Manufacturing
- 11.4.3. Automotive
- 11.4.4. Pharmaceuticals
- 11.4.5. Other End-user Industries
- 11.1. Market Analysis, Insights and Forecast - by Product Type
- 12. Competitive Analysis
- 12.1. Company Profiles
- 12.1.1 Cabot Corporation
- 12.1.1.1. Company Overview
- 12.1.1.2. Products
- 12.1.1.3. Company Financials
- 12.1.1.4. SWOT Analysis
- 12.1.2 CeramTec
- 12.1.2.1. Company Overview
- 12.1.2.2. Products
- 12.1.2.3. Company Financials
- 12.1.2.4. SWOT Analysis
- 12.1.3 CoorsTek
- 12.1.3.1. Company Overview
- 12.1.3.2. Products
- 12.1.3.3. Company Financials
- 12.1.3.4. SWOT Analysis
- 12.1.4 Evonik Industries
- 12.1.4.1. Company Overview
- 12.1.4.2. Products
- 12.1.4.3. Company Financials
- 12.1.4.4. SWOT Analysis
- 12.1.5 Magma Ceramics & Catalysts
- 12.1.5.1. Company Overview
- 12.1.5.2. Products
- 12.1.5.3. Company Financials
- 12.1.5.4. SWOT Analysis
- 12.1.6 Noritake Co Limited
- 12.1.6.1. Company Overview
- 12.1.6.2. Products
- 12.1.6.3. Company Financials
- 12.1.6.4. SWOT Analysis
- 12.1.7 Saint-Gobain
- 12.1.7.1. Company Overview
- 12.1.7.2. Products
- 12.1.7.3. Company Financials
- 12.1.7.4. SWOT Analysis
- 12.1.8 Sasol Performance Chemicals
- 12.1.8.1. Company Overview
- 12.1.8.2. Products
- 12.1.8.3. Company Financials
- 12.1.8.4. SWOT Analysis
- 12.1.9 ALMATIS AN OYAK GROUP COMPANY
- 12.1.9.1. Company Overview
- 12.1.9.2. Products
- 12.1.9.3. Company Financials
- 12.1.9.4. SWOT Analysis
- 12.1.10 W R Grace & Co -Conn *List Not Exhaustive
- 12.1.10.1. Company Overview
- 12.1.10.2. Products
- 12.1.10.3. Company Financials
- 12.1.10.4. SWOT Analysis
- 12.1.1 Cabot Corporation
- 12.2. Market Entropy
- 12.2.1 Company's Key Areas Served
- 12.2.2 Recent Developments
- 12.3. Company Market Share Analysis 2025
- 12.3.1 Top 5 Companies Market Share Analysis
- 12.3.2 Top 3 Companies Market Share Analysis
- 12.4. List of Potential Customers
- 13. Research Methodology
List of Figures
- Figure 1: Global Catalyst Carrier Industry Revenue Breakdown (million, %) by Region 2025 & 2033
- Figure 2: Asia Pacific Catalyst Carrier Industry Revenue (million), by Product Type 2025 & 2033
- Figure 3: Asia Pacific Catalyst Carrier Industry Revenue Share (%), by Product Type 2025 & 2033
- Figure 4: Asia Pacific Catalyst Carrier Industry Revenue (million), by Material Type 2025 & 2033
- Figure 5: Asia Pacific Catalyst Carrier Industry Revenue Share (%), by Material Type 2025 & 2033
- Figure 6: Asia Pacific Catalyst Carrier Industry Revenue (million), by Shape 2025 & 2033
- Figure 7: Asia Pacific Catalyst Carrier Industry Revenue Share (%), by Shape 2025 & 2033
- Figure 8: Asia Pacific Catalyst Carrier Industry Revenue (million), by End-user Industry 2025 & 2033
- Figure 9: Asia Pacific Catalyst Carrier Industry Revenue Share (%), by End-user Industry 2025 & 2033
- Figure 10: Asia Pacific Catalyst Carrier Industry Revenue (million), by Country 2025 & 2033
- Figure 11: Asia Pacific Catalyst Carrier Industry Revenue Share (%), by Country 2025 & 2033
- Figure 12: North America Catalyst Carrier Industry Revenue (million), by Product Type 2025 & 2033
- Figure 13: North America Catalyst Carrier Industry Revenue Share (%), by Product Type 2025 & 2033
- Figure 14: North America Catalyst Carrier Industry Revenue (million), by Material Type 2025 & 2033
- Figure 15: North America Catalyst Carrier Industry Revenue Share (%), by Material Type 2025 & 2033
- Figure 16: North America Catalyst Carrier Industry Revenue (million), by Shape 2025 & 2033
- Figure 17: North America Catalyst Carrier Industry Revenue Share (%), by Shape 2025 & 2033
- Figure 18: North America Catalyst Carrier Industry Revenue (million), by End-user Industry 2025 & 2033
- Figure 19: North America Catalyst Carrier Industry Revenue Share (%), by End-user Industry 2025 & 2033
- Figure 20: North America Catalyst Carrier Industry Revenue (million), by Country 2025 & 2033
- Figure 21: North America Catalyst Carrier Industry Revenue Share (%), by Country 2025 & 2033
- Figure 22: Europe Catalyst Carrier Industry Revenue (million), by Product Type 2025 & 2033
- Figure 23: Europe Catalyst Carrier Industry Revenue Share (%), by Product Type 2025 & 2033
- Figure 24: Europe Catalyst Carrier Industry Revenue (million), by Material Type 2025 & 2033
- Figure 25: Europe Catalyst Carrier Industry Revenue Share (%), by Material Type 2025 & 2033
- Figure 26: Europe Catalyst Carrier Industry Revenue (million), by Shape 2025 & 2033
- Figure 27: Europe Catalyst Carrier Industry Revenue Share (%), by Shape 2025 & 2033
- Figure 28: Europe Catalyst Carrier Industry Revenue (million), by End-user Industry 2025 & 2033
- Figure 29: Europe Catalyst Carrier Industry Revenue Share (%), by End-user Industry 2025 & 2033
- Figure 30: Europe Catalyst Carrier Industry Revenue (million), by Country 2025 & 2033
- Figure 31: Europe Catalyst Carrier Industry Revenue Share (%), by Country 2025 & 2033
- Figure 32: South America Catalyst Carrier Industry Revenue (million), by Product Type 2025 & 2033
- Figure 33: South America Catalyst Carrier Industry Revenue Share (%), by Product Type 2025 & 2033
- Figure 34: South America Catalyst Carrier Industry Revenue (million), by Material Type 2025 & 2033
- Figure 35: South America Catalyst Carrier Industry Revenue Share (%), by Material Type 2025 & 2033
- Figure 36: South America Catalyst Carrier Industry Revenue (million), by Shape 2025 & 2033
- Figure 37: South America Catalyst Carrier Industry Revenue Share (%), by Shape 2025 & 2033
- Figure 38: South America Catalyst Carrier Industry Revenue (million), by End-user Industry 2025 & 2033
- Figure 39: South America Catalyst Carrier Industry Revenue Share (%), by End-user Industry 2025 & 2033
- Figure 40: South America Catalyst Carrier Industry Revenue (million), by Country 2025 & 2033
- Figure 41: South America Catalyst Carrier Industry Revenue Share (%), by Country 2025 & 2033
- Figure 42: Middle East and Africa Catalyst Carrier Industry Revenue (million), by Product Type 2025 & 2033
- Figure 43: Middle East and Africa Catalyst Carrier Industry Revenue Share (%), by Product Type 2025 & 2033
- Figure 44: Middle East and Africa Catalyst Carrier Industry Revenue (million), by Material Type 2025 & 2033
- Figure 45: Middle East and Africa Catalyst Carrier Industry Revenue Share (%), by Material Type 2025 & 2033
- Figure 46: Middle East and Africa Catalyst Carrier Industry Revenue (million), by Shape 2025 & 2033
- Figure 47: Middle East and Africa Catalyst Carrier Industry Revenue Share (%), by Shape 2025 & 2033
- Figure 48: Middle East and Africa Catalyst Carrier Industry Revenue (million), by End-user Industry 2025 & 2033
- Figure 49: Middle East and Africa Catalyst Carrier Industry Revenue Share (%), by End-user Industry 2025 & 2033
- Figure 50: Middle East and Africa Catalyst Carrier Industry Revenue (million), by Country 2025 & 2033
- Figure 51: Middle East and Africa Catalyst Carrier Industry Revenue Share (%), by Country 2025 & 2033
List of Tables
- Table 1: Global Catalyst Carrier Industry Revenue million Forecast, by Product Type 2020 & 2033
- Table 2: Global Catalyst Carrier Industry Revenue million Forecast, by Material Type 2020 & 2033
- Table 3: Global Catalyst Carrier Industry Revenue million Forecast, by Shape 2020 & 2033
- Table 4: Global Catalyst Carrier Industry Revenue million Forecast, by End-user Industry 2020 & 2033
- Table 5: Global Catalyst Carrier Industry Revenue million Forecast, by Region 2020 & 2033
- Table 6: Global Catalyst Carrier Industry Revenue million Forecast, by Product Type 2020 & 2033
- Table 7: Global Catalyst Carrier Industry Revenue million Forecast, by Material Type 2020 & 2033
- Table 8: Global Catalyst Carrier Industry Revenue million Forecast, by Shape 2020 & 2033
- Table 9: Global Catalyst Carrier Industry Revenue million Forecast, by End-user Industry 2020 & 2033
- Table 10: Global Catalyst Carrier Industry Revenue million Forecast, by Country 2020 & 2033
- Table 11: China Catalyst Carrier Industry Revenue (million) Forecast, by Application 2020 & 2033
- Table 12: India Catalyst Carrier Industry Revenue (million) Forecast, by Application 2020 & 2033
- Table 13: Japan Catalyst Carrier Industry Revenue (million) Forecast, by Application 2020 & 2033
- Table 14: South Korea Catalyst Carrier Industry Revenue (million) Forecast, by Application 2020 & 2033
- Table 15: Rest of Asia Pacific Catalyst Carrier Industry Revenue (million) Forecast, by Application 2020 & 2033
- Table 16: Global Catalyst Carrier Industry Revenue million Forecast, by Product Type 2020 & 2033
- Table 17: Global Catalyst Carrier Industry Revenue million Forecast, by Material Type 2020 & 2033
- Table 18: Global Catalyst Carrier Industry Revenue million Forecast, by Shape 2020 & 2033
- Table 19: Global Catalyst Carrier Industry Revenue million Forecast, by End-user Industry 2020 & 2033
- Table 20: Global Catalyst Carrier Industry Revenue million Forecast, by Country 2020 & 2033
- Table 21: United States Catalyst Carrier Industry Revenue (million) Forecast, by Application 2020 & 2033
- Table 22: Canada Catalyst Carrier Industry Revenue (million) Forecast, by Application 2020 & 2033
- Table 23: Mexico Catalyst Carrier Industry Revenue (million) Forecast, by Application 2020 & 2033
- Table 24: Global Catalyst Carrier Industry Revenue million Forecast, by Product Type 2020 & 2033
- Table 25: Global Catalyst Carrier Industry Revenue million Forecast, by Material Type 2020 & 2033
- Table 26: Global Catalyst Carrier Industry Revenue million Forecast, by Shape 2020 & 2033
- Table 27: Global Catalyst Carrier Industry Revenue million Forecast, by End-user Industry 2020 & 2033
- Table 28: Global Catalyst Carrier Industry Revenue million Forecast, by Country 2020 & 2033
- Table 29: Germany Catalyst Carrier Industry Revenue (million) Forecast, by Application 2020 & 2033
- Table 30: United Kingdom Catalyst Carrier Industry Revenue (million) Forecast, by Application 2020 & 2033
- Table 31: France Catalyst Carrier Industry Revenue (million) Forecast, by Application 2020 & 2033
- Table 32: Italy Catalyst Carrier Industry Revenue (million) Forecast, by Application 2020 & 2033
- Table 33: Rest of Europe Catalyst Carrier Industry Revenue (million) Forecast, by Application 2020 & 2033
- Table 34: Global Catalyst Carrier Industry Revenue million Forecast, by Product Type 2020 & 2033
- Table 35: Global Catalyst Carrier Industry Revenue million Forecast, by Material Type 2020 & 2033
- Table 36: Global Catalyst Carrier Industry Revenue million Forecast, by Shape 2020 & 2033
- Table 37: Global Catalyst Carrier Industry Revenue million Forecast, by End-user Industry 2020 & 2033
- Table 38: Global Catalyst Carrier Industry Revenue million Forecast, by Country 2020 & 2033
- Table 39: Brazil Catalyst Carrier Industry Revenue (million) Forecast, by Application 2020 & 2033
- Table 40: Argentina Catalyst Carrier Industry Revenue (million) Forecast, by Application 2020 & 2033
- Table 41: Rest of South America Catalyst Carrier Industry Revenue (million) Forecast, by Application 2020 & 2033
- Table 42: Global Catalyst Carrier Industry Revenue million Forecast, by Product Type 2020 & 2033
- Table 43: Global Catalyst Carrier Industry Revenue million Forecast, by Material Type 2020 & 2033
- Table 44: Global Catalyst Carrier Industry Revenue million Forecast, by Shape 2020 & 2033
- Table 45: Global Catalyst Carrier Industry Revenue million Forecast, by End-user Industry 2020 & 2033
- Table 46: Global Catalyst Carrier Industry Revenue million Forecast, by Country 2020 & 2033
- Table 47: Saudi Arabia Catalyst Carrier Industry Revenue (million) Forecast, by Application 2020 & 2033
- Table 48: South Africa Catalyst Carrier Industry Revenue (million) Forecast, by Application 2020 & 2033
- Table 49: Rest of Middle East and Africa Catalyst Carrier Industry Revenue (million) Forecast, by Application 2020 & 2033
Frequently Asked Questions
1. What is the projected Compound Annual Growth Rate (CAGR) of the Catalyst Carrier Industry?
The projected CAGR is approximately 4.8%.
2. Which companies are prominent players in the Catalyst Carrier Industry?
Key companies in the market include Cabot Corporation, CeramTec, CoorsTek, Evonik Industries, Magma Ceramics & Catalysts, Noritake Co Limited, Saint-Gobain, Sasol Performance Chemicals, ALMATIS AN OYAK GROUP COMPANY, W R Grace & Co -Conn *List Not Exhaustive.
3. What are the main segments of the Catalyst Carrier Industry?
The market segments include Product Type, Material Type, Shape, End-user Industry.
4. Can you provide details about the market size?
The market size is estimated to be USD 51.5 million as of 2022.
5. What are some drivers contributing to market growth?
; Increasing Demand from Ceramic Catalyst; Growing Consumption of Petroleum Derivatives.
6. What are the notable trends driving market growth?
Oil and Gas Industry to Dominate the Market.
7. Are there any restraints impacting market growth?
; Increasing Demand from Ceramic Catalyst; Growing Consumption of Petroleum Derivatives.
8. Can you provide examples of recent developments in the market?
N/A
9. What pricing options are available for accessing the report?
Pricing options include single-user, multi-user, and enterprise licenses priced at USD 4750, USD 5250, and USD 8750 respectively.
10. Is the market size provided in terms of value or volume?
The market size is provided in terms of value, measured in million.
11. Are there any specific market keywords associated with the report?
Yes, the market keyword associated with the report is "Catalyst Carrier Industry," which aids in identifying and referencing the specific market segment covered.
12. How do I determine which pricing option suits my needs best?
The pricing options vary based on user requirements and access needs. Individual users may opt for single-user licenses, while businesses requiring broader access may choose multi-user or enterprise licenses for cost-effective access to the report.
13. Are there any additional resources or data provided in the Catalyst Carrier Industry report?
While the report offers comprehensive insights, it's advisable to review the specific contents or supplementary materials provided to ascertain if additional resources or data are available.
14. How can I stay updated on further developments or reports in the Catalyst Carrier Industry?
To stay informed about further developments, trends, and reports in the Catalyst Carrier Industry, consider subscribing to industry newsletters, following relevant companies and organizations, or regularly checking reputable industry news sources and publications.
Methodology
Step 1 - Identification of Relevant Samples Size from Population Database


Step 2 - Approaches for Defining Global Market Size (Value, Volume* & Price*)

Note*: In applicable scenarios
Step 3 - Data Sources
Primary Research
- Web Analytics
- Survey Reports
- Research Institute
- Latest Research Reports
- Opinion Leaders
Secondary Research
- Annual Reports
- White Paper
- Latest Press Release
- Industry Association
- Paid Database
- Investor Presentations

Step 4 - Data Triangulation
Involves using different sources of information in order to increase the validity of a study
These sources are likely to be stakeholders in a program - participants, other researchers, program staff, other community members, and so on.
Then we put all data in single framework & apply various statistical tools to find out the dynamic on the market.
During the analysis stage, feedback from the stakeholder groups would be compared to determine areas of agreement as well as areas of divergence