

Key Insights
The chelating agents market, valued at approximately $XX million in 2025, exhibits robust growth potential, projected to expand at a CAGR exceeding 4.00% from 2025 to 2033. This growth is driven by increasing demand across diverse sectors, including water treatment, agrochemicals, and personal care. The rising awareness of environmental concerns is fueling the adoption of biodegradable chelating agents, presenting a significant opportunity for market expansion. Furthermore, the stringent regulations on heavy metal contamination in various industries are bolstering the demand for effective chelating agents for wastewater treatment and industrial cleaning applications. The market's segmentation reflects its broad application, with cleaners and pulp & paper representing substantial segments, followed by water treatment, agrochemicals, and others including food & beverage, pharmaceuticals and personal care. Key players like ADM, BASF, and Merck KGaA are actively involved in developing and supplying innovative chelating agent solutions, fostering competition and driving innovation within the sector. Regional growth will be influenced by factors such as industrial development, environmental regulations and economic conditions, with Asia-Pacific likely to remain a key growth region due to its burgeoning industrial sector.
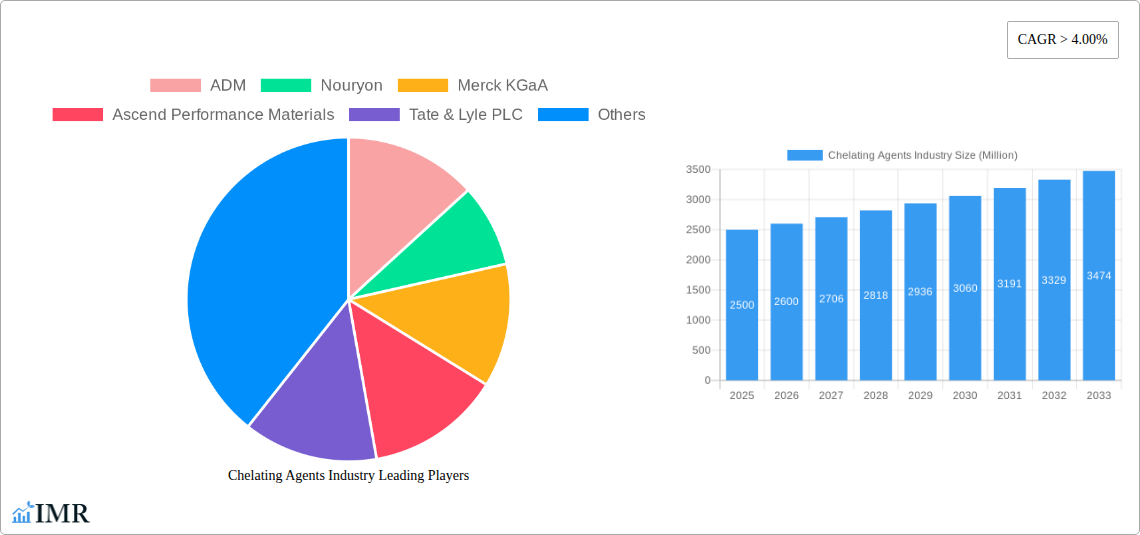
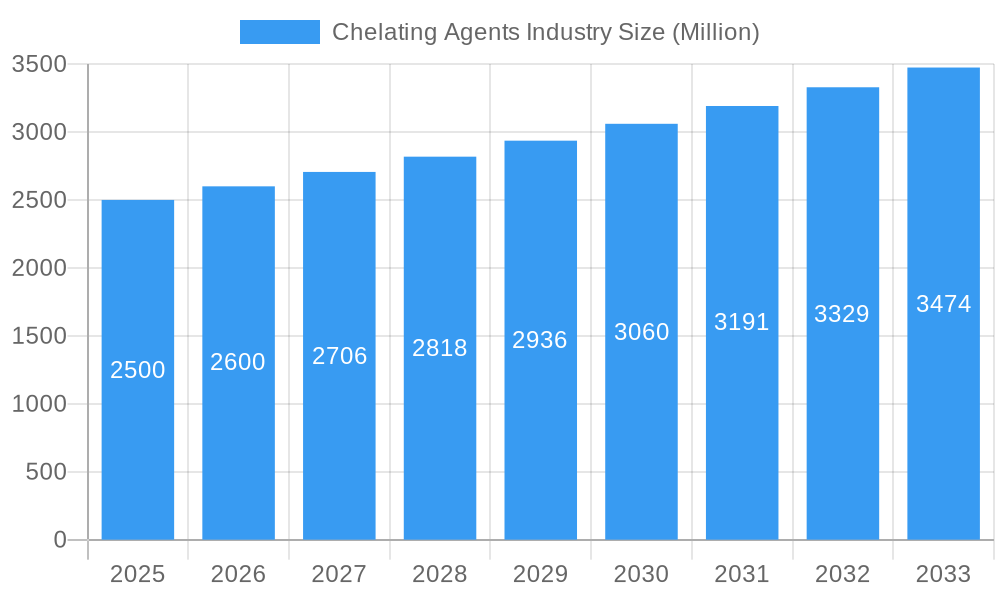
Chelating Agents Industry Market Size (In Billion)
The competitive landscape is marked by the presence of both established multinational corporations and specialized chemical manufacturers. Industry consolidation through mergers and acquisitions is anticipated, driving further growth. While rising raw material costs and potential supply chain disruptions present challenges, the overall market outlook remains positive, driven by consistent demand from various end-use industries and ongoing research and development efforts focused on sustainability and performance enhancement. Future growth will be shaped by technological advancements in developing more efficient and environmentally friendly chelating agents, catering to specific needs within each application area, and expanding into newer, niche applications. The market is expected to witness significant innovations in biodegradable and sustainable chelating agents, aligning with the growing global emphasis on environmental protection.
Chelating Agents Industry Company Market Share
This comprehensive report provides a detailed analysis of the global chelating agents market, encompassing market size, growth trends, key players, and future opportunities. With a study period spanning 2019-2033, a base year of 2025, and a forecast period of 2025-2033, this report is an indispensable resource for industry professionals, investors, and strategic decision-makers. The report leverages extensive primary and secondary research to deliver actionable insights across various segments, including biodegradable and non-biodegradable chelating agents, and diverse applications.
Chelating Agents Industry Market Dynamics & Structure
The chelating agents market is characterized by a moderately concentrated structure with several major players holding significant market share. The market is driven by technological advancements in chelate synthesis, leading to the development of more efficient and environmentally friendly products. Stringent environmental regulations, particularly concerning water treatment and industrial waste management, are key drivers. The market also faces competition from alternative technologies and substances with similar functionalities. Mergers and acquisitions (M&A) are relatively common, reflecting industry consolidation and expansion efforts. For example, the acquisition of ADOB by Nouryon in 2023 signifies the ongoing trend of larger companies consolidating their position.
- Market Concentration: Moderately concentrated, with top 5 players holding approximately xx% market share in 2024.
- Technological Innovation: Focus on biodegradable chelates and enhanced performance characteristics.
- Regulatory Framework: Stringent regulations on industrial waste and water treatment are key drivers.
- Competitive Substitutes: Alternative complexing agents and methods pose some competitive pressure.
- End-User Demographics: Diverse end-user base spanning cleaners, water treatment, agriculture, and pharmaceuticals.
- M&A Trends: Increasing M&A activity, particularly involving the acquisition of specialized companies with niche technologies. Estimated xx M&A deals in the period 2019-2024.
Chelating Agents Industry Growth Trends & Insights
The global chelating agents market witnessed robust growth during the historical period (2019-2024), driven by increasing demand across various applications. The market size expanded from xx Million in 2019 to xx Million in 2024, registering a CAGR of xx%. This growth is projected to continue during the forecast period (2025-2033), with a projected CAGR of xx%, driven by factors including the rising adoption of biodegradable chelates, expanding applications in the water treatment sector, and increased demand from the agrochemical industry. Technological advancements, such as the development of highly specific chelating agents for targeted applications, are further boosting market growth. Consumer preference for environmentally sustainable products is driving increased adoption of biodegradable chelates. The market penetration of biodegradable chelates is expected to increase from xx% in 2024 to xx% by 2033.
Dominant Regions, Countries, or Segments in Chelating Agents Industry
The North American and European regions currently dominate the global chelating agents market, accounting for approximately xx% of the total market share in 2024. However, the Asia-Pacific region is expected to witness the fastest growth during the forecast period, driven by rapid industrialization and increasing demand from emerging economies like China and India. Within the application segments, Water Treatment and Agrochemicals show the highest growth potential, driven by stringent regulations and increasing agricultural production, respectively. The biodegradable segment is also experiencing significant growth due to the rising awareness of environmental sustainability.
- Key Drivers (Asia-Pacific): Rapid industrialization, growing agricultural sector, increasing government investments in infrastructure.
- Dominance Factors (North America & Europe): Established industrial base, strong regulatory frameworks driving demand for advanced chelating agents, high consumer awareness.
- Growth Potential: Biodegradable segment and the Asia-Pacific region are expected to exhibit the highest growth rates.
Segment Breakdown (2024):
- Non-biodegradable: xx Million
- Biodegradable: xx Million
- Water Treatment: xx Million
- Agrochemicals: xx Million
- Cleaners: xx Million
Chelating Agents Industry Product Landscape
The chelating agents market encompasses a wide range of products with varying properties and applications. Recent innovations focus on developing biodegradable chelates with improved performance characteristics and reduced environmental impact. These advancements are driven by growing environmental concerns and stricter regulations. Companies are developing tailored solutions to meet the specific requirements of different applications, such as enhanced stability, controlled release, and targeted delivery. The key selling points include enhanced efficacy, improved biodegradability, and customized solutions for specific end-use applications.
Key Drivers, Barriers & Challenges in Chelating Agents Industry
Key Drivers:
- Increasing demand from the water treatment industry driven by stringent regulations.
- Growth of the agricultural sector and increasing use of chelates in fertilizers.
- Technological advancements leading to the development of biodegradable and high-performance chelates.
Challenges & Restraints:
- Fluctuations in raw material prices impacting production costs.
- Stringent environmental regulations increasing compliance costs.
- Intense competition from existing players and the emergence of new entrants. This is estimated to impact market growth by approximately xx% by 2033.
Emerging Opportunities in Chelating Agents Industry
- Growing demand for biodegradable and sustainable chelating agents.
- Expansion into new application areas, such as personal care and pharmaceuticals.
- Development of customized chelating agents tailored to specific industrial needs.
- Penetration into emerging markets with high growth potential.
Growth Accelerators in the Chelating Agents Industry
Technological breakthroughs in the synthesis of highly efficient and eco-friendly chelating agents are accelerating market growth. Strategic partnerships between chelating agent manufacturers and end-use industries are also driving innovation and expanding market penetration. Expansion into emerging markets with significant growth potential is another significant growth catalyst.
Key Players Shaping the Chelating Agents Industry Market
- ADM
- Nouryon
- Merck KGaA
- Ascend Performance Materials
- Tate & Lyle PLC
- BASF SE
- Macrocyclics
- Ava Chemicals Pvt Ltd
- Tosoh Corporation
- Kemira
- Dow
- Hexion
- Nippon Shokubai Co Ltd
- Mitsubishi Chemical Holdings Corporation
- Shandong IRO Chelating Chemical Co Ltd
- Chemtex Specialty Limited
- Nagase & Co Ltd
- Lanxess
- Zhonglan Industry Co Ltd
- Bozzetto Group
Notable Milestones in Chelating Agents Industry Sector
- January 2023: Nouryon acquired ADOB, expanding its presence in the agricultural chelates market.
- February 2022: Nouryon commissioned a biodegradable chelates production facility, signifying a shift towards sustainable products.
In-Depth Chelating Agents Industry Market Outlook
The chelating agents market is poised for robust growth in the coming years, driven by increasing demand from various sectors and technological advancements. Strategic investments in research and development, coupled with expansion into emerging markets, will further propel market expansion. The growing focus on sustainable solutions and environmentally friendly products will create lucrative opportunities for manufacturers of biodegradable chelates. The market's future success hinges on meeting evolving regulatory requirements and adapting to changing consumer preferences.
Chelating Agents Industry Segmentation
-
1. Type
- 1.1. Non-biodegradable
- 1.2. Biodegradable
-
2. Application
- 2.1. Cleaners
- 2.2. Pulp and Paper
- 2.3. Water Treament
- 2.4. Agrochemicals
- 2.5. Chemical
- 2.6. Food and Beverages
- 2.7. Pharmaceuticals
- 2.8. Personal Care
- 2.9. Other Ap
Chelating Agents Industry Segmentation By Geography
-
1. Asia Pacific
- 1.1. China
- 1.2. India
- 1.3. Japan
- 1.4. South Korea
- 1.5. Rest of Asia Pacific
-
2. North America
- 2.1. United States
- 2.2. Canada
- 2.3. Mexico
-
3. Europe
- 3.1. Germany
- 3.2. United Kingdom
- 3.3. Italy
- 3.4. France
- 3.5. Rest of Europe
-
4. South America
- 4.1. Brazil
- 4.2. Argentina
- 4.3. Rest of South America
-
5. Middle East and Africa
- 5.1. Saudi Arabia
- 5.2. South Africa
- 5.3. Rest of Middle East and Africa
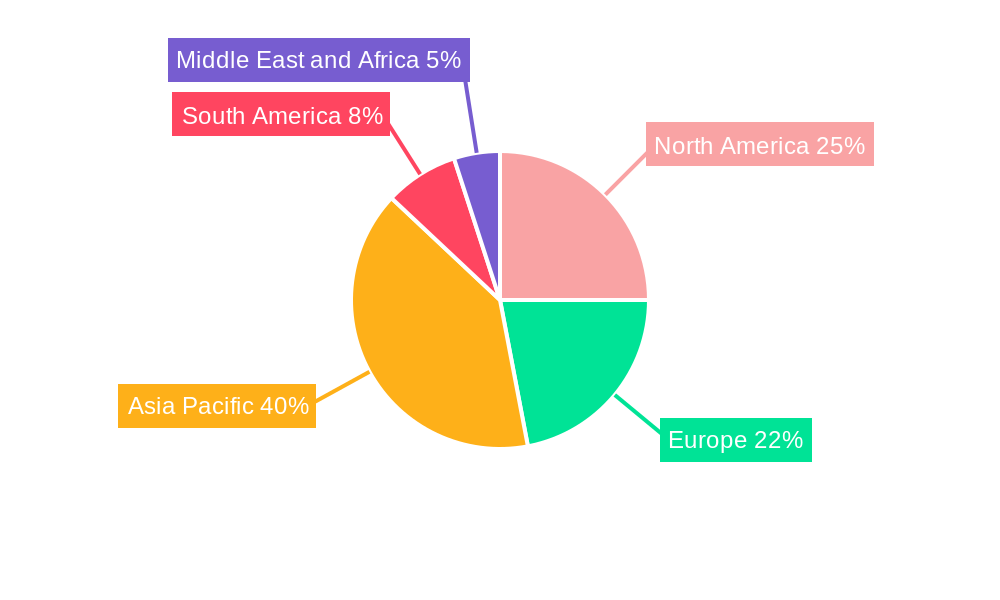
Chelating Agents Industry Regional Market Share
Geographic Coverage of Chelating Agents Industry
Chelating Agents Industry REPORT HIGHLIGHTS
| Aspects | Details |
|---|---|
| Study Period | 2020-2034 |
| Base Year | 2025 |
| Estimated Year | 2026 |
| Forecast Period | 2026-2034 |
| Historical Period | 2020-2025 |
| Growth Rate | CAGR of 12.73% from 2020-2034 |
| Segmentation |
|
Table of Contents
- 1. Introduction
- 1.1. Research Scope
- 1.2. Market Segmentation
- 1.3. Research Methodology
- 1.4. Definitions and Assumptions
- 2. Executive Summary
- 2.1. Introduction
- 3. Market Dynamics
- 3.1. Introduction
- 3.2. Market Drivers
- 3.2.1. Increasing Use of Cleaners in Households; Escalating Chelating Agents Consumption in the Pulp and Paper Industry; Growing Demand in Water Treatment Applications
- 3.3. Market Restrains
- 3.3.1. Environmental Risks Associated With Non-Biodegradable Chelating Agents; Other Restraints
- 3.4. Market Trends
- 3.4.1. Increasing Consumption of Chelating Agents in Cleaning Applications
- 4. Market Factor Analysis
- 4.1. Porters Five Forces
- 4.2. Supply/Value Chain
- 4.3. PESTEL analysis
- 4.4. Market Entropy
- 4.5. Patent/Trademark Analysis
- 5. Global Chelating Agents Industry Analysis, Insights and Forecast, 2020-2032
- 5.1. Market Analysis, Insights and Forecast - by Type
- 5.1.1. Non-biodegradable
- 5.1.2. Biodegradable
- 5.2. Market Analysis, Insights and Forecast - by Application
- 5.2.1. Cleaners
- 5.2.2. Pulp and Paper
- 5.2.3. Water Treament
- 5.2.4. Agrochemicals
- 5.2.5. Chemical
- 5.2.6. Food and Beverages
- 5.2.7. Pharmaceuticals
- 5.2.8. Personal Care
- 5.2.9. Other Ap
- 5.3. Market Analysis, Insights and Forecast - by Region
- 5.3.1. Asia Pacific
- 5.3.2. North America
- 5.3.3. Europe
- 5.3.4. South America
- 5.3.5. Middle East and Africa
- 5.1. Market Analysis, Insights and Forecast - by Type
- 6. Asia Pacific Chelating Agents Industry Analysis, Insights and Forecast, 2020-2032
- 6.1. Market Analysis, Insights and Forecast - by Type
- 6.1.1. Non-biodegradable
- 6.1.2. Biodegradable
- 6.2. Market Analysis, Insights and Forecast - by Application
- 6.2.1. Cleaners
- 6.2.2. Pulp and Paper
- 6.2.3. Water Treament
- 6.2.4. Agrochemicals
- 6.2.5. Chemical
- 6.2.6. Food and Beverages
- 6.2.7. Pharmaceuticals
- 6.2.8. Personal Care
- 6.2.9. Other Ap
- 6.1. Market Analysis, Insights and Forecast - by Type
- 7. North America Chelating Agents Industry Analysis, Insights and Forecast, 2020-2032
- 7.1. Market Analysis, Insights and Forecast - by Type
- 7.1.1. Non-biodegradable
- 7.1.2. Biodegradable
- 7.2. Market Analysis, Insights and Forecast - by Application
- 7.2.1. Cleaners
- 7.2.2. Pulp and Paper
- 7.2.3. Water Treament
- 7.2.4. Agrochemicals
- 7.2.5. Chemical
- 7.2.6. Food and Beverages
- 7.2.7. Pharmaceuticals
- 7.2.8. Personal Care
- 7.2.9. Other Ap
- 7.1. Market Analysis, Insights and Forecast - by Type
- 8. Europe Chelating Agents Industry Analysis, Insights and Forecast, 2020-2032
- 8.1. Market Analysis, Insights and Forecast - by Type
- 8.1.1. Non-biodegradable
- 8.1.2. Biodegradable
- 8.2. Market Analysis, Insights and Forecast - by Application
- 8.2.1. Cleaners
- 8.2.2. Pulp and Paper
- 8.2.3. Water Treament
- 8.2.4. Agrochemicals
- 8.2.5. Chemical
- 8.2.6. Food and Beverages
- 8.2.7. Pharmaceuticals
- 8.2.8. Personal Care
- 8.2.9. Other Ap
- 8.1. Market Analysis, Insights and Forecast - by Type
- 9. South America Chelating Agents Industry Analysis, Insights and Forecast, 2020-2032
- 9.1. Market Analysis, Insights and Forecast - by Type
- 9.1.1. Non-biodegradable
- 9.1.2. Biodegradable
- 9.2. Market Analysis, Insights and Forecast - by Application
- 9.2.1. Cleaners
- 9.2.2. Pulp and Paper
- 9.2.3. Water Treament
- 9.2.4. Agrochemicals
- 9.2.5. Chemical
- 9.2.6. Food and Beverages
- 9.2.7. Pharmaceuticals
- 9.2.8. Personal Care
- 9.2.9. Other Ap
- 9.1. Market Analysis, Insights and Forecast - by Type
- 10. Middle East and Africa Chelating Agents Industry Analysis, Insights and Forecast, 2020-2032
- 10.1. Market Analysis, Insights and Forecast - by Type
- 10.1.1. Non-biodegradable
- 10.1.2. Biodegradable
- 10.2. Market Analysis, Insights and Forecast - by Application
- 10.2.1. Cleaners
- 10.2.2. Pulp and Paper
- 10.2.3. Water Treament
- 10.2.4. Agrochemicals
- 10.2.5. Chemical
- 10.2.6. Food and Beverages
- 10.2.7. Pharmaceuticals
- 10.2.8. Personal Care
- 10.2.9. Other Ap
- 10.1. Market Analysis, Insights and Forecast - by Type
- 11. Competitive Analysis
- 11.1. Global Market Share Analysis 2025
- 11.2. Company Profiles
- 11.2.1 ADM
- 11.2.1.1. Overview
- 11.2.1.2. Products
- 11.2.1.3. SWOT Analysis
- 11.2.1.4. Recent Developments
- 11.2.1.5. Financials (Based on Availability)
- 11.2.2 Nouryon
- 11.2.2.1. Overview
- 11.2.2.2. Products
- 11.2.2.3. SWOT Analysis
- 11.2.2.4. Recent Developments
- 11.2.2.5. Financials (Based on Availability)
- 11.2.3 Merck KGaA
- 11.2.3.1. Overview
- 11.2.3.2. Products
- 11.2.3.3. SWOT Analysis
- 11.2.3.4. Recent Developments
- 11.2.3.5. Financials (Based on Availability)
- 11.2.4 Ascend Performance Materials
- 11.2.4.1. Overview
- 11.2.4.2. Products
- 11.2.4.3. SWOT Analysis
- 11.2.4.4. Recent Developments
- 11.2.4.5. Financials (Based on Availability)
- 11.2.5 Tate & Lyle PLC
- 11.2.5.1. Overview
- 11.2.5.2. Products
- 11.2.5.3. SWOT Analysis
- 11.2.5.4. Recent Developments
- 11.2.5.5. Financials (Based on Availability)
- 11.2.6 BASF SE
- 11.2.6.1. Overview
- 11.2.6.2. Products
- 11.2.6.3. SWOT Analysis
- 11.2.6.4. Recent Developments
- 11.2.6.5. Financials (Based on Availability)
- 11.2.7 Macrocyclics
- 11.2.7.1. Overview
- 11.2.7.2. Products
- 11.2.7.3. SWOT Analysis
- 11.2.7.4. Recent Developments
- 11.2.7.5. Financials (Based on Availability)
- 11.2.8 Ava Chemicals Pvt Ltd
- 11.2.8.1. Overview
- 11.2.8.2. Products
- 11.2.8.3. SWOT Analysis
- 11.2.8.4. Recent Developments
- 11.2.8.5. Financials (Based on Availability)
- 11.2.9 Tosoh Corporation
- 11.2.9.1. Overview
- 11.2.9.2. Products
- 11.2.9.3. SWOT Analysis
- 11.2.9.4. Recent Developments
- 11.2.9.5. Financials (Based on Availability)
- 11.2.10 Kemira
- 11.2.10.1. Overview
- 11.2.10.2. Products
- 11.2.10.3. SWOT Analysis
- 11.2.10.4. Recent Developments
- 11.2.10.5. Financials (Based on Availability)
- 11.2.11 Dow
- 11.2.11.1. Overview
- 11.2.11.2. Products
- 11.2.11.3. SWOT Analysis
- 11.2.11.4. Recent Developments
- 11.2.11.5. Financials (Based on Availability)
- 11.2.12 Hexion
- 11.2.12.1. Overview
- 11.2.12.2. Products
- 11.2.12.3. SWOT Analysis
- 11.2.12.4. Recent Developments
- 11.2.12.5. Financials (Based on Availability)
- 11.2.13 Nippon Shokubai Co Ltd
- 11.2.13.1. Overview
- 11.2.13.2. Products
- 11.2.13.3. SWOT Analysis
- 11.2.13.4. Recent Developments
- 11.2.13.5. Financials (Based on Availability)
- 11.2.14 Mitsubishi Chemical Holdings Corporation
- 11.2.14.1. Overview
- 11.2.14.2. Products
- 11.2.14.3. SWOT Analysis
- 11.2.14.4. Recent Developments
- 11.2.14.5. Financials (Based on Availability)
- 11.2.15 Shandong IRO Chelating Chemical Co Ltd
- 11.2.15.1. Overview
- 11.2.15.2. Products
- 11.2.15.3. SWOT Analysis
- 11.2.15.4. Recent Developments
- 11.2.15.5. Financials (Based on Availability)
- 11.2.16 Chemtex Specialty Limited
- 11.2.16.1. Overview
- 11.2.16.2. Products
- 11.2.16.3. SWOT Analysis
- 11.2.16.4. Recent Developments
- 11.2.16.5. Financials (Based on Availability)
- 11.2.17 Nagase & Co Ltd
- 11.2.17.1. Overview
- 11.2.17.2. Products
- 11.2.17.3. SWOT Analysis
- 11.2.17.4. Recent Developments
- 11.2.17.5. Financials (Based on Availability)
- 11.2.18 Lanxess
- 11.2.18.1. Overview
- 11.2.18.2. Products
- 11.2.18.3. SWOT Analysis
- 11.2.18.4. Recent Developments
- 11.2.18.5. Financials (Based on Availability)
- 11.2.19 Zhonglan Industry Co Ltd *List Not Exhaustive
- 11.2.19.1. Overview
- 11.2.19.2. Products
- 11.2.19.3. SWOT Analysis
- 11.2.19.4. Recent Developments
- 11.2.19.5. Financials (Based on Availability)
- 11.2.20 Bozzetto Group
- 11.2.20.1. Overview
- 11.2.20.2. Products
- 11.2.20.3. SWOT Analysis
- 11.2.20.4. Recent Developments
- 11.2.20.5. Financials (Based on Availability)
- 11.2.1 ADM
List of Figures
- Figure 1: Global Chelating Agents Industry Revenue Breakdown (undefined, %) by Region 2025 & 2033
- Figure 2: Global Chelating Agents Industry Volume Breakdown (Thousand, %) by Region 2025 & 2033
- Figure 3: Asia Pacific Chelating Agents Industry Revenue (undefined), by Type 2025 & 2033
- Figure 4: Asia Pacific Chelating Agents Industry Volume (Thousand), by Type 2025 & 2033
- Figure 5: Asia Pacific Chelating Agents Industry Revenue Share (%), by Type 2025 & 2033
- Figure 6: Asia Pacific Chelating Agents Industry Volume Share (%), by Type 2025 & 2033
- Figure 7: Asia Pacific Chelating Agents Industry Revenue (undefined), by Application 2025 & 2033
- Figure 8: Asia Pacific Chelating Agents Industry Volume (Thousand), by Application 2025 & 2033
- Figure 9: Asia Pacific Chelating Agents Industry Revenue Share (%), by Application 2025 & 2033
- Figure 10: Asia Pacific Chelating Agents Industry Volume Share (%), by Application 2025 & 2033
- Figure 11: Asia Pacific Chelating Agents Industry Revenue (undefined), by Country 2025 & 2033
- Figure 12: Asia Pacific Chelating Agents Industry Volume (Thousand), by Country 2025 & 2033
- Figure 13: Asia Pacific Chelating Agents Industry Revenue Share (%), by Country 2025 & 2033
- Figure 14: Asia Pacific Chelating Agents Industry Volume Share (%), by Country 2025 & 2033
- Figure 15: North America Chelating Agents Industry Revenue (undefined), by Type 2025 & 2033
- Figure 16: North America Chelating Agents Industry Volume (Thousand), by Type 2025 & 2033
- Figure 17: North America Chelating Agents Industry Revenue Share (%), by Type 2025 & 2033
- Figure 18: North America Chelating Agents Industry Volume Share (%), by Type 2025 & 2033
- Figure 19: North America Chelating Agents Industry Revenue (undefined), by Application 2025 & 2033
- Figure 20: North America Chelating Agents Industry Volume (Thousand), by Application 2025 & 2033
- Figure 21: North America Chelating Agents Industry Revenue Share (%), by Application 2025 & 2033
- Figure 22: North America Chelating Agents Industry Volume Share (%), by Application 2025 & 2033
- Figure 23: North America Chelating Agents Industry Revenue (undefined), by Country 2025 & 2033
- Figure 24: North America Chelating Agents Industry Volume (Thousand), by Country 2025 & 2033
- Figure 25: North America Chelating Agents Industry Revenue Share (%), by Country 2025 & 2033
- Figure 26: North America Chelating Agents Industry Volume Share (%), by Country 2025 & 2033
- Figure 27: Europe Chelating Agents Industry Revenue (undefined), by Type 2025 & 2033
- Figure 28: Europe Chelating Agents Industry Volume (Thousand), by Type 2025 & 2033
- Figure 29: Europe Chelating Agents Industry Revenue Share (%), by Type 2025 & 2033
- Figure 30: Europe Chelating Agents Industry Volume Share (%), by Type 2025 & 2033
- Figure 31: Europe Chelating Agents Industry Revenue (undefined), by Application 2025 & 2033
- Figure 32: Europe Chelating Agents Industry Volume (Thousand), by Application 2025 & 2033
- Figure 33: Europe Chelating Agents Industry Revenue Share (%), by Application 2025 & 2033
- Figure 34: Europe Chelating Agents Industry Volume Share (%), by Application 2025 & 2033
- Figure 35: Europe Chelating Agents Industry Revenue (undefined), by Country 2025 & 2033
- Figure 36: Europe Chelating Agents Industry Volume (Thousand), by Country 2025 & 2033
- Figure 37: Europe Chelating Agents Industry Revenue Share (%), by Country 2025 & 2033
- Figure 38: Europe Chelating Agents Industry Volume Share (%), by Country 2025 & 2033
- Figure 39: South America Chelating Agents Industry Revenue (undefined), by Type 2025 & 2033
- Figure 40: South America Chelating Agents Industry Volume (Thousand), by Type 2025 & 2033
- Figure 41: South America Chelating Agents Industry Revenue Share (%), by Type 2025 & 2033
- Figure 42: South America Chelating Agents Industry Volume Share (%), by Type 2025 & 2033
- Figure 43: South America Chelating Agents Industry Revenue (undefined), by Application 2025 & 2033
- Figure 44: South America Chelating Agents Industry Volume (Thousand), by Application 2025 & 2033
- Figure 45: South America Chelating Agents Industry Revenue Share (%), by Application 2025 & 2033
- Figure 46: South America Chelating Agents Industry Volume Share (%), by Application 2025 & 2033
- Figure 47: South America Chelating Agents Industry Revenue (undefined), by Country 2025 & 2033
- Figure 48: South America Chelating Agents Industry Volume (Thousand), by Country 2025 & 2033
- Figure 49: South America Chelating Agents Industry Revenue Share (%), by Country 2025 & 2033
- Figure 50: South America Chelating Agents Industry Volume Share (%), by Country 2025 & 2033
- Figure 51: Middle East and Africa Chelating Agents Industry Revenue (undefined), by Type 2025 & 2033
- Figure 52: Middle East and Africa Chelating Agents Industry Volume (Thousand), by Type 2025 & 2033
- Figure 53: Middle East and Africa Chelating Agents Industry Revenue Share (%), by Type 2025 & 2033
- Figure 54: Middle East and Africa Chelating Agents Industry Volume Share (%), by Type 2025 & 2033
- Figure 55: Middle East and Africa Chelating Agents Industry Revenue (undefined), by Application 2025 & 2033
- Figure 56: Middle East and Africa Chelating Agents Industry Volume (Thousand), by Application 2025 & 2033
- Figure 57: Middle East and Africa Chelating Agents Industry Revenue Share (%), by Application 2025 & 2033
- Figure 58: Middle East and Africa Chelating Agents Industry Volume Share (%), by Application 2025 & 2033
- Figure 59: Middle East and Africa Chelating Agents Industry Revenue (undefined), by Country 2025 & 2033
- Figure 60: Middle East and Africa Chelating Agents Industry Volume (Thousand), by Country 2025 & 2033
- Figure 61: Middle East and Africa Chelating Agents Industry Revenue Share (%), by Country 2025 & 2033
- Figure 62: Middle East and Africa Chelating Agents Industry Volume Share (%), by Country 2025 & 2033
List of Tables
- Table 1: Global Chelating Agents Industry Revenue undefined Forecast, by Type 2020 & 2033
- Table 2: Global Chelating Agents Industry Volume Thousand Forecast, by Type 2020 & 2033
- Table 3: Global Chelating Agents Industry Revenue undefined Forecast, by Application 2020 & 2033
- Table 4: Global Chelating Agents Industry Volume Thousand Forecast, by Application 2020 & 2033
- Table 5: Global Chelating Agents Industry Revenue undefined Forecast, by Region 2020 & 2033
- Table 6: Global Chelating Agents Industry Volume Thousand Forecast, by Region 2020 & 2033
- Table 7: Global Chelating Agents Industry Revenue undefined Forecast, by Type 2020 & 2033
- Table 8: Global Chelating Agents Industry Volume Thousand Forecast, by Type 2020 & 2033
- Table 9: Global Chelating Agents Industry Revenue undefined Forecast, by Application 2020 & 2033
- Table 10: Global Chelating Agents Industry Volume Thousand Forecast, by Application 2020 & 2033
- Table 11: Global Chelating Agents Industry Revenue undefined Forecast, by Country 2020 & 2033
- Table 12: Global Chelating Agents Industry Volume Thousand Forecast, by Country 2020 & 2033
- Table 13: China Chelating Agents Industry Revenue (undefined) Forecast, by Application 2020 & 2033
- Table 14: China Chelating Agents Industry Volume (Thousand) Forecast, by Application 2020 & 2033
- Table 15: India Chelating Agents Industry Revenue (undefined) Forecast, by Application 2020 & 2033
- Table 16: India Chelating Agents Industry Volume (Thousand) Forecast, by Application 2020 & 2033
- Table 17: Japan Chelating Agents Industry Revenue (undefined) Forecast, by Application 2020 & 2033
- Table 18: Japan Chelating Agents Industry Volume (Thousand) Forecast, by Application 2020 & 2033
- Table 19: South Korea Chelating Agents Industry Revenue (undefined) Forecast, by Application 2020 & 2033
- Table 20: South Korea Chelating Agents Industry Volume (Thousand) Forecast, by Application 2020 & 2033
- Table 21: Rest of Asia Pacific Chelating Agents Industry Revenue (undefined) Forecast, by Application 2020 & 2033
- Table 22: Rest of Asia Pacific Chelating Agents Industry Volume (Thousand) Forecast, by Application 2020 & 2033
- Table 23: Global Chelating Agents Industry Revenue undefined Forecast, by Type 2020 & 2033
- Table 24: Global Chelating Agents Industry Volume Thousand Forecast, by Type 2020 & 2033
- Table 25: Global Chelating Agents Industry Revenue undefined Forecast, by Application 2020 & 2033
- Table 26: Global Chelating Agents Industry Volume Thousand Forecast, by Application 2020 & 2033
- Table 27: Global Chelating Agents Industry Revenue undefined Forecast, by Country 2020 & 2033
- Table 28: Global Chelating Agents Industry Volume Thousand Forecast, by Country 2020 & 2033
- Table 29: United States Chelating Agents Industry Revenue (undefined) Forecast, by Application 2020 & 2033
- Table 30: United States Chelating Agents Industry Volume (Thousand) Forecast, by Application 2020 & 2033
- Table 31: Canada Chelating Agents Industry Revenue (undefined) Forecast, by Application 2020 & 2033
- Table 32: Canada Chelating Agents Industry Volume (Thousand) Forecast, by Application 2020 & 2033
- Table 33: Mexico Chelating Agents Industry Revenue (undefined) Forecast, by Application 2020 & 2033
- Table 34: Mexico Chelating Agents Industry Volume (Thousand) Forecast, by Application 2020 & 2033
- Table 35: Global Chelating Agents Industry Revenue undefined Forecast, by Type 2020 & 2033
- Table 36: Global Chelating Agents Industry Volume Thousand Forecast, by Type 2020 & 2033
- Table 37: Global Chelating Agents Industry Revenue undefined Forecast, by Application 2020 & 2033
- Table 38: Global Chelating Agents Industry Volume Thousand Forecast, by Application 2020 & 2033
- Table 39: Global Chelating Agents Industry Revenue undefined Forecast, by Country 2020 & 2033
- Table 40: Global Chelating Agents Industry Volume Thousand Forecast, by Country 2020 & 2033
- Table 41: Germany Chelating Agents Industry Revenue (undefined) Forecast, by Application 2020 & 2033
- Table 42: Germany Chelating Agents Industry Volume (Thousand) Forecast, by Application 2020 & 2033
- Table 43: United Kingdom Chelating Agents Industry Revenue (undefined) Forecast, by Application 2020 & 2033
- Table 44: United Kingdom Chelating Agents Industry Volume (Thousand) Forecast, by Application 2020 & 2033
- Table 45: Italy Chelating Agents Industry Revenue (undefined) Forecast, by Application 2020 & 2033
- Table 46: Italy Chelating Agents Industry Volume (Thousand) Forecast, by Application 2020 & 2033
- Table 47: France Chelating Agents Industry Revenue (undefined) Forecast, by Application 2020 & 2033
- Table 48: France Chelating Agents Industry Volume (Thousand) Forecast, by Application 2020 & 2033
- Table 49: Rest of Europe Chelating Agents Industry Revenue (undefined) Forecast, by Application 2020 & 2033
- Table 50: Rest of Europe Chelating Agents Industry Volume (Thousand) Forecast, by Application 2020 & 2033
- Table 51: Global Chelating Agents Industry Revenue undefined Forecast, by Type 2020 & 2033
- Table 52: Global Chelating Agents Industry Volume Thousand Forecast, by Type 2020 & 2033
- Table 53: Global Chelating Agents Industry Revenue undefined Forecast, by Application 2020 & 2033
- Table 54: Global Chelating Agents Industry Volume Thousand Forecast, by Application 2020 & 2033
- Table 55: Global Chelating Agents Industry Revenue undefined Forecast, by Country 2020 & 2033
- Table 56: Global Chelating Agents Industry Volume Thousand Forecast, by Country 2020 & 2033
- Table 57: Brazil Chelating Agents Industry Revenue (undefined) Forecast, by Application 2020 & 2033
- Table 58: Brazil Chelating Agents Industry Volume (Thousand) Forecast, by Application 2020 & 2033
- Table 59: Argentina Chelating Agents Industry Revenue (undefined) Forecast, by Application 2020 & 2033
- Table 60: Argentina Chelating Agents Industry Volume (Thousand) Forecast, by Application 2020 & 2033
- Table 61: Rest of South America Chelating Agents Industry Revenue (undefined) Forecast, by Application 2020 & 2033
- Table 62: Rest of South America Chelating Agents Industry Volume (Thousand) Forecast, by Application 2020 & 2033
- Table 63: Global Chelating Agents Industry Revenue undefined Forecast, by Type 2020 & 2033
- Table 64: Global Chelating Agents Industry Volume Thousand Forecast, by Type 2020 & 2033
- Table 65: Global Chelating Agents Industry Revenue undefined Forecast, by Application 2020 & 2033
- Table 66: Global Chelating Agents Industry Volume Thousand Forecast, by Application 2020 & 2033
- Table 67: Global Chelating Agents Industry Revenue undefined Forecast, by Country 2020 & 2033
- Table 68: Global Chelating Agents Industry Volume Thousand Forecast, by Country 2020 & 2033
- Table 69: Saudi Arabia Chelating Agents Industry Revenue (undefined) Forecast, by Application 2020 & 2033
- Table 70: Saudi Arabia Chelating Agents Industry Volume (Thousand) Forecast, by Application 2020 & 2033
- Table 71: South Africa Chelating Agents Industry Revenue (undefined) Forecast, by Application 2020 & 2033
- Table 72: South Africa Chelating Agents Industry Volume (Thousand) Forecast, by Application 2020 & 2033
- Table 73: Rest of Middle East and Africa Chelating Agents Industry Revenue (undefined) Forecast, by Application 2020 & 2033
- Table 74: Rest of Middle East and Africa Chelating Agents Industry Volume (Thousand) Forecast, by Application 2020 & 2033
Frequently Asked Questions
1. What is the projected Compound Annual Growth Rate (CAGR) of the Chelating Agents Industry?
The projected CAGR is approximately 12.73%.
2. Which companies are prominent players in the Chelating Agents Industry?
Key companies in the market include ADM, Nouryon, Merck KGaA, Ascend Performance Materials, Tate & Lyle PLC, BASF SE, Macrocyclics, Ava Chemicals Pvt Ltd, Tosoh Corporation, Kemira, Dow, Hexion, Nippon Shokubai Co Ltd, Mitsubishi Chemical Holdings Corporation, Shandong IRO Chelating Chemical Co Ltd, Chemtex Specialty Limited, Nagase & Co Ltd, Lanxess, Zhonglan Industry Co Ltd *List Not Exhaustive, Bozzetto Group.
3. What are the main segments of the Chelating Agents Industry?
The market segments include Type, Application.
4. Can you provide details about the market size?
The market size is estimated to be USD XXX N/A as of 2022.
5. What are some drivers contributing to market growth?
Increasing Use of Cleaners in Households; Escalating Chelating Agents Consumption in the Pulp and Paper Industry; Growing Demand in Water Treatment Applications.
6. What are the notable trends driving market growth?
Increasing Consumption of Chelating Agents in Cleaning Applications.
7. Are there any restraints impacting market growth?
Environmental Risks Associated With Non-Biodegradable Chelating Agents; Other Restraints.
8. Can you provide examples of recent developments in the market?
January 2023: Nouryon acquired ADOB, a supplier of chelated micronutrients, foliars, and other specialty agricultural solutions headquartered in Poland.
9. What pricing options are available for accessing the report?
Pricing options include single-user, multi-user, and enterprise licenses priced at USD 4750, USD 5250, and USD 8750 respectively.
10. Is the market size provided in terms of value or volume?
The market size is provided in terms of value, measured in N/A and volume, measured in Thousand.
11. Are there any specific market keywords associated with the report?
Yes, the market keyword associated with the report is "Chelating Agents Industry," which aids in identifying and referencing the specific market segment covered.
12. How do I determine which pricing option suits my needs best?
The pricing options vary based on user requirements and access needs. Individual users may opt for single-user licenses, while businesses requiring broader access may choose multi-user or enterprise licenses for cost-effective access to the report.
13. Are there any additional resources or data provided in the Chelating Agents Industry report?
While the report offers comprehensive insights, it's advisable to review the specific contents or supplementary materials provided to ascertain if additional resources or data are available.
14. How can I stay updated on further developments or reports in the Chelating Agents Industry?
To stay informed about further developments, trends, and reports in the Chelating Agents Industry, consider subscribing to industry newsletters, following relevant companies and organizations, or regularly checking reputable industry news sources and publications.
Methodology
Step 1 - Identification of Relevant Samples Size from Population Database


Step 2 - Approaches for Defining Global Market Size (Value, Volume* & Price*)

Note*: In applicable scenarios
Step 3 - Data Sources
Primary Research
- Web Analytics
- Survey Reports
- Research Institute
- Latest Research Reports
- Opinion Leaders
Secondary Research
- Annual Reports
- White Paper
- Latest Press Release
- Industry Association
- Paid Database
- Investor Presentations

Step 4 - Data Triangulation
Involves using different sources of information in order to increase the validity of a study
These sources are likely to be stakeholders in a program - participants, other researchers, program staff, other community members, and so on.
Then we put all data in single framework & apply various statistical tools to find out the dynamic on the market.
During the analysis stage, feedback from the stakeholder groups would be compared to determine areas of agreement as well as areas of divergence