

Key Insights
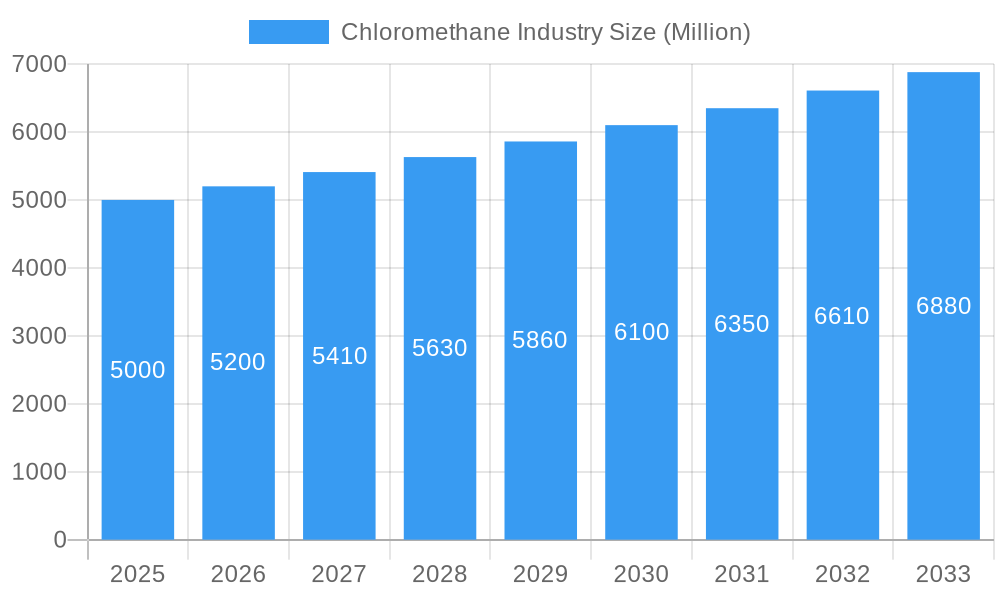
The global chloromethane market, encompassing key products such as methylene chloride, methyl chloride, and chloroform, is poised for significant expansion. Driven by robust demand across diverse industrial sectors, the market is projected to achieve a CAGR of 5.2%. The market size is estimated at $6.1 billion in the base year 2025, with substantial growth anticipated throughout the forecast period. Primary growth drivers include escalating demand in silicone manufacturing, agricultural chemical production, and pharmaceutical intermediates. The increasing integration of chloromethane derivatives in personal care products and other emerging applications further fuels market expansion. Geographically, the Asia-Pacific region, led by China and India, is expected to spearhead market growth due to rapid industrialization and rising consumer consumption. However, stringent environmental regulations pertaining to the use and disposal of chloromethane derivatives present a notable challenge, particularly in developed economies such as North America and Europe. Key industry players, including Occidental Petroleum, Tokyo Chemical Industry, and Merck KGaA, are actively pursuing strategic expansions and technological innovations to fortify their market positions. The forecast period (2025-2033) indicates sustained market development, where sustainable practices and innovative technologies will be paramount in addressing environmental concerns and ensuring responsible industry evolution.
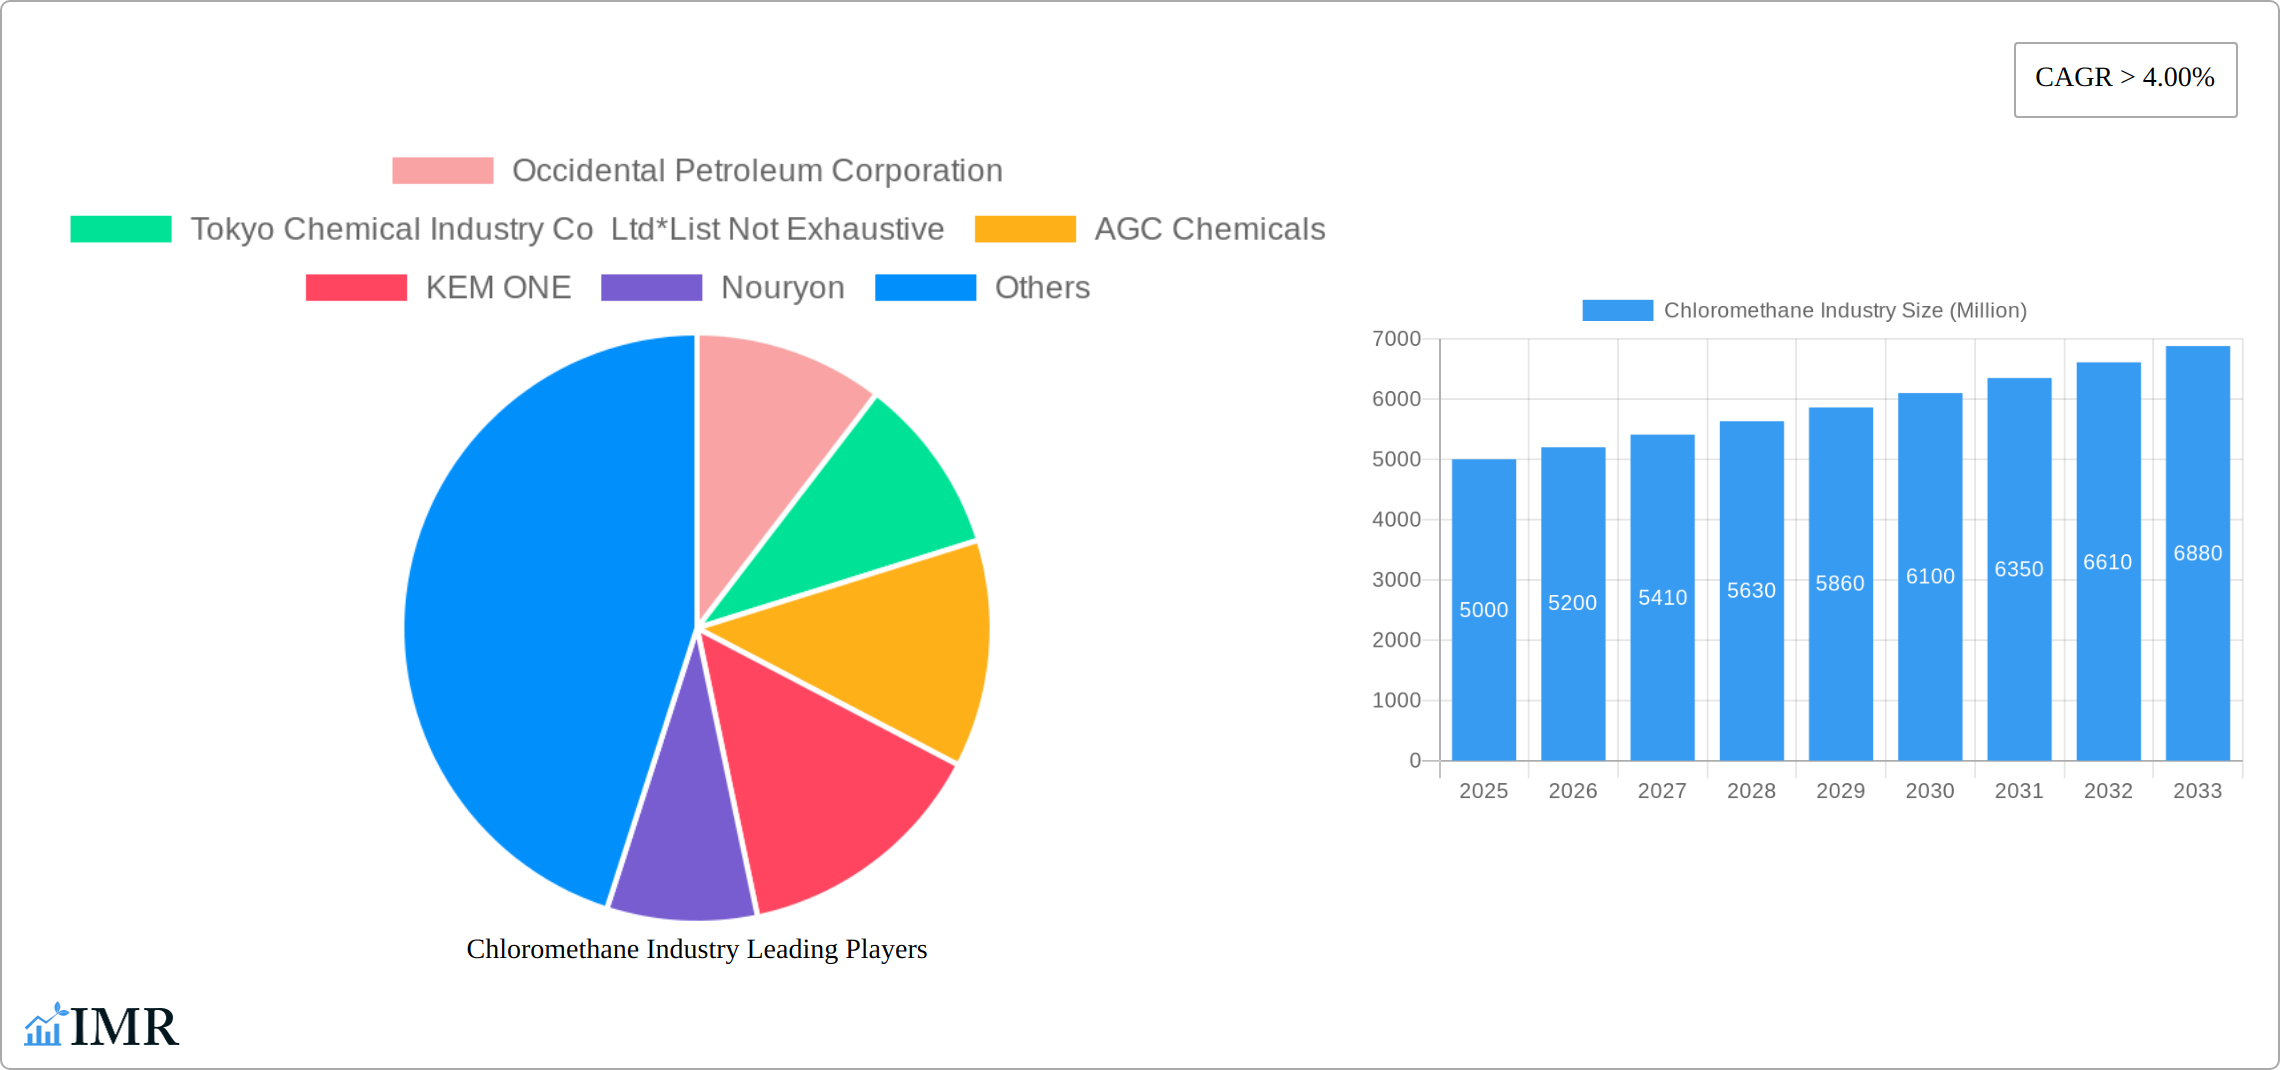
Chloromethane Industry Market Size (In Billion)
The competitive environment is defined by the presence of both established multinational corporations and agile, specialized chemical manufacturers. Leading companies are strategically investing in technological advancements to enhance production efficiency and minimize environmental impact, prioritizing sustainable manufacturing processes. Market segmentation by product type and application offers crucial insights into specific growth trajectories. Methylene chloride's extensive utility as a solvent, methyl chloride's critical role in silicone production, and chloroform's significant contributions to the pharmaceutical industry are key segment highlights. Future market expansion will be contingent upon advancements in production methodologies, the adoption of environmentally benign alternatives, and the increasing application scope within emerging economies. Enhanced penetration in high-growth sectors such as pharmaceuticals and personal care products is anticipated to significantly bolster market growth during the forecast period.
Chloromethane Industry Company Market Share
Chloromethane Industry Market Report: 2019-2033
This comprehensive report provides an in-depth analysis of the Chloromethane industry, encompassing market dynamics, growth trends, regional dominance, product landscape, key players, and future outlook. The study period covers 2019-2033, with a base year of 2025 and a forecast period of 2025-2033. This report is essential for industry professionals, investors, and strategists seeking a clear understanding of this dynamic market. Parent markets include the broader chemical industry, while child markets comprise specific applications like silicones and agricultural chemicals. The report quantifies market values in million units.
Chloromethane Industry Market Dynamics & Structure
The Chloromethane market is characterized by moderate concentration, with key players holding significant market share. Technological innovation, particularly in production efficiency and sustainable processes, is a key driver. Stringent environmental regulations concerning volatile organic compounds (VOCs) significantly impact the industry, shaping production methods and potentially limiting market expansion in certain regions. Competitive product substitutes, such as alternative solvents and refrigerants, exert pressure, impacting market growth. End-user demographics, particularly within the agricultural and pharmaceutical sectors, are crucial in shaping demand. Mergers and acquisitions (M&A) activity has been moderate in recent years, with companies focusing on strategic expansion and technological integration.
- Market Concentration: Moderately concentrated, with the top 5 players holding approximately xx% of the market share in 2024.
- Technological Innovation: Focus on improving production efficiency, reducing emissions, and developing sustainable alternatives.
- Regulatory Framework: Stringent environmental regulations pose challenges but also drive innovation towards greener processes.
- Competitive Substitutes: Presence of alternative solvents and refrigerants creates competitive pressure.
- M&A Activity: Moderate M&A activity, driven by strategic expansion and technology acquisition. xx deals were recorded between 2019-2024.
Chloromethane Industry Growth Trends & Insights
The Chloromethane market experienced a CAGR of xx% during the historical period (2019-2024), driven by increasing demand from key application segments. The market size reached xx million units in 2024 and is projected to reach xx million units by 2033, exhibiting a CAGR of xx% during the forecast period (2025-2033). Technological disruptions, such as the development of more efficient production processes and the adoption of greener technologies, are contributing factors. Shifting consumer behavior towards sustainable and environmentally friendly products is also influencing market growth. Adoption rates vary across different applications; for instance, the pharmaceutical sector is showing higher growth compared to other segments.
Dominant Regions, Countries, or Segments in Chloromethane Industry
The Asia-Pacific region, particularly China and India, dominates the Chloromethane market due to robust economic growth, increasing industrialization, and expanding application sectors such as agriculture and pharmaceuticals. Within product types, Methyl Chloride holds the largest market share due to its widespread applications. The Silicones application segment is experiencing significant growth, primarily driven by expanding demand in the electronics and construction sectors.
- Key Drivers (Asia-Pacific): Rapid industrialization, growing population, increasing demand from downstream industries.
- Key Drivers (Methyl Chloride): Versatility in applications, cost-effectiveness, readily available production.
- Key Drivers (Silicones Application): Strong demand from electronics, construction, and automotive sectors.
Chloromethane Industry Product Landscape
The Chloromethane product landscape is characterized by a range of products, including Methylene Chloride, Methyl Chloride, Carbon Tetrachloride, and Chloroform, each with unique applications and performance characteristics. Recent innovations focus on improving purity, reducing impurities, and enhancing safety. Companies are increasingly emphasizing sustainable manufacturing processes, reducing environmental impact and improving overall product quality. Unique selling propositions include high purity levels, customized formulations, and environmentally friendly production methods.
Key Drivers, Barriers & Challenges in Chloromethane Industry
Key Drivers: Increasing demand from various end-use industries, particularly the agriculture and pharmaceutical sectors; technological advancements leading to cost-effective and efficient production; and government support for the chemical industry.
Key Challenges: Stringent environmental regulations; fluctuating raw material prices; competitive pressures from substitute products; and potential supply chain disruptions. The impact of these challenges can be quantified by a projected xx% reduction in market growth if regulatory hurdles are not addressed effectively.
Emerging Opportunities in Chloromethane Industry
Emerging opportunities lie in untapped markets in developing economies, the development of innovative applications in emerging technologies, and the growing demand for sustainable and environmentally friendly chloromethane products. Focus on applications in renewable energy and advanced materials presents significant potential.
Growth Accelerators in the Chloromethane Industry
Technological breakthroughs in production efficiency and sustainability are accelerating market growth. Strategic partnerships between chemical manufacturers and end-users are fostering innovation and market expansion. Expanding into new geographical markets, particularly in developing economies, further fuels market expansion.
Key Players Shaping the Chloromethane Industry Market
- Occidental Petroleum Corporation
- Tokyo Chemical Industry Co Ltd
- AGC Chemicals
- KEM ONE
- Nouryon
- Merck KGaA
- Tokuyama Corporation
- The Sanmar Group
- Gujarat Alkalies and Chemical Limited
- Shin-Etsu Chemical Co Ltd
- Gujarat Fluorochemicals Limited
Notable Milestones in Chloromethane Industry Sector
- January 2023: Nouryon acquires a Polish supplier of agricultural solutions, expanding its market reach.
- May 2022: AGC Inc. invests USD 0.76 billion to increase chlor-alkali production capacity in Indochina.
In-Depth Chloromethane Industry Market Outlook
The Chloromethane market is poised for continued growth, driven by increasing demand from various sectors and technological advancements. Strategic investments in sustainable production methods and expansion into new markets will shape the future landscape. The potential for market disruption through innovative applications and partnerships presents significant strategic opportunities for industry players.
Chloromethane Industry Segmentation
-
1. Product Type
- 1.1. Methylene Chloride
- 1.2. Methyl Chloride
- 1.3. Carbon Tetrachloride
- 1.4. Chloroform
-
2. Application
- 2.1. Silicones
- 2.2. Agriculture Chemicals
- 2.3. Pharmaceutical
- 2.4. Chemical Intermediate
- 2.5. Personal Care
- 2.6. Other Applications
Chloromethane Industry Segmentation By Geography
-
1. Asia Pacific
- 1.1. China
- 1.2. India
- 1.3. Japan
- 1.4. South Korea
- 1.5. Rest of Asia Pacific
-
2. North America
- 2.1. United States
- 2.2. Canada
- 2.3. Mexico
-
3. Europe
- 3.1. Germany
- 3.2. United Kingdom
- 3.3. Italy
- 3.4. France
- 3.5. Rest of Europe
-
4. South America
- 4.1. Brazil
- 4.2. Argentina
- 4.3. Rest of South America
-
5. Middle East and Africa
- 5.1. Saudi Arabia
- 5.2. South Africa
- 5.3. Rest of Middle East and Africa
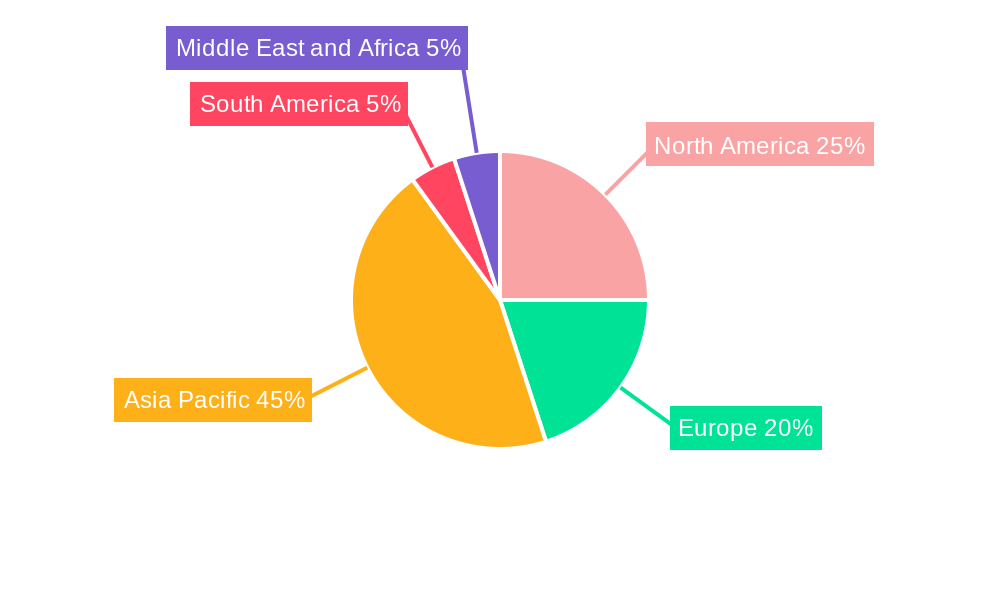
Chloromethane Industry Regional Market Share
Geographic Coverage of Chloromethane Industry
Chloromethane Industry REPORT HIGHLIGHTS
| Aspects | Details |
|---|---|
| Study Period | 2020-2034 |
| Base Year | 2025 |
| Estimated Year | 2026 |
| Forecast Period | 2026-2034 |
| Historical Period | 2020-2025 |
| Growth Rate | CAGR of 5.2% from 2020-2034 |
| Segmentation |
|
Table of Contents
- 1. Introduction
- 1.1. Research Scope
- 1.2. Market Segmentation
- 1.3. Research Objective
- 1.4. Definitions and Assumptions
- 2. Executive Summary
- 2.1. Market Snapshot
- 3. Market Dynamics
- 3.1. Market Drivers
- 3.2. Market Restrains
- 3.3. Market Trends
- 3.4. Market Opportunities
- 4. Market Factor Analysis
- 4.1. Porters Five Forces
- 4.1.1. Bargaining Power of Suppliers
- 4.1.2. Bargaining Power of Buyers
- 4.1.3. Threat of New Entrants
- 4.1.4. Threat of Substitutes
- 4.1.5. Competitive Rivalry
- 4.2. PESTEL analysis
- 4.3. BCG Analysis
- 4.3.1. Stars (High Growth, High Market Share)
- 4.3.2. Cash Cows (Low Growth, High Market Share)
- 4.3.3. Question Mark (High Growth, Low Market Share)
- 4.3.4. Dogs (Low Growth, Low Market Share)
- 4.4. Ansoff Matrix Analysis
- 4.5. Supply Chain Analysis
- 4.6. Regulatory Landscape
- 4.7. Current Market Potential and Opportunity Assessment (TAM–SAM–SOM Framework)
- 4.8. IMR Analyst Note
- 4.1. Porters Five Forces
- 5. Market Analysis, Insights and Forecast 2021-2033
- 5.1. Market Analysis, Insights and Forecast - by Product Type
- 5.1.1. Methylene Chloride
- 5.1.2. Methyl Chloride
- 5.1.3. Carbon Tetrachloride
- 5.1.4. Chloroform
- 5.2. Market Analysis, Insights and Forecast - by Application
- 5.2.1. Silicones
- 5.2.2. Agriculture Chemicals
- 5.2.3. Pharmaceutical
- 5.2.4. Chemical Intermediate
- 5.2.5. Personal Care
- 5.2.6. Other Applications
- 5.3. Market Analysis, Insights and Forecast - by Region
- 5.3.1. Asia Pacific
- 5.3.2. North America
- 5.3.3. Europe
- 5.3.4. South America
- 5.3.5. Middle East and Africa
- 5.1. Market Analysis, Insights and Forecast - by Product Type
- 6. Global Chloromethane Industry Analysis, Insights and Forecast, 2021-2033
- 6.1. Market Analysis, Insights and Forecast - by Product Type
- 6.1.1. Methylene Chloride
- 6.1.2. Methyl Chloride
- 6.1.3. Carbon Tetrachloride
- 6.1.4. Chloroform
- 6.2. Market Analysis, Insights and Forecast - by Application
- 6.2.1. Silicones
- 6.2.2. Agriculture Chemicals
- 6.2.3. Pharmaceutical
- 6.2.4. Chemical Intermediate
- 6.2.5. Personal Care
- 6.2.6. Other Applications
- 6.1. Market Analysis, Insights and Forecast - by Product Type
- 7. Asia Pacific Chloromethane Industry Analysis, Insights and Forecast, 2020-2032
- 7.1. Market Analysis, Insights and Forecast - by Product Type
- 7.1.1. Methylene Chloride
- 7.1.2. Methyl Chloride
- 7.1.3. Carbon Tetrachloride
- 7.1.4. Chloroform
- 7.2. Market Analysis, Insights and Forecast - by Application
- 7.2.1. Silicones
- 7.2.2. Agriculture Chemicals
- 7.2.3. Pharmaceutical
- 7.2.4. Chemical Intermediate
- 7.2.5. Personal Care
- 7.2.6. Other Applications
- 7.1. Market Analysis, Insights and Forecast - by Product Type
- 8. North America Chloromethane Industry Analysis, Insights and Forecast, 2020-2032
- 8.1. Market Analysis, Insights and Forecast - by Product Type
- 8.1.1. Methylene Chloride
- 8.1.2. Methyl Chloride
- 8.1.3. Carbon Tetrachloride
- 8.1.4. Chloroform
- 8.2. Market Analysis, Insights and Forecast - by Application
- 8.2.1. Silicones
- 8.2.2. Agriculture Chemicals
- 8.2.3. Pharmaceutical
- 8.2.4. Chemical Intermediate
- 8.2.5. Personal Care
- 8.2.6. Other Applications
- 8.1. Market Analysis, Insights and Forecast - by Product Type
- 9. Europe Chloromethane Industry Analysis, Insights and Forecast, 2020-2032
- 9.1. Market Analysis, Insights and Forecast - by Product Type
- 9.1.1. Methylene Chloride
- 9.1.2. Methyl Chloride
- 9.1.3. Carbon Tetrachloride
- 9.1.4. Chloroform
- 9.2. Market Analysis, Insights and Forecast - by Application
- 9.2.1. Silicones
- 9.2.2. Agriculture Chemicals
- 9.2.3. Pharmaceutical
- 9.2.4. Chemical Intermediate
- 9.2.5. Personal Care
- 9.2.6. Other Applications
- 9.1. Market Analysis, Insights and Forecast - by Product Type
- 10. South America Chloromethane Industry Analysis, Insights and Forecast, 2020-2032
- 10.1. Market Analysis, Insights and Forecast - by Product Type
- 10.1.1. Methylene Chloride
- 10.1.2. Methyl Chloride
- 10.1.3. Carbon Tetrachloride
- 10.1.4. Chloroform
- 10.2. Market Analysis, Insights and Forecast - by Application
- 10.2.1. Silicones
- 10.2.2. Agriculture Chemicals
- 10.2.3. Pharmaceutical
- 10.2.4. Chemical Intermediate
- 10.2.5. Personal Care
- 10.2.6. Other Applications
- 10.1. Market Analysis, Insights and Forecast - by Product Type
- 11. Middle East and Africa Chloromethane Industry Analysis, Insights and Forecast, 2020-2032
- 11.1. Market Analysis, Insights and Forecast - by Product Type
- 11.1.1. Methylene Chloride
- 11.1.2. Methyl Chloride
- 11.1.3. Carbon Tetrachloride
- 11.1.4. Chloroform
- 11.2. Market Analysis, Insights and Forecast - by Application
- 11.2.1. Silicones
- 11.2.2. Agriculture Chemicals
- 11.2.3. Pharmaceutical
- 11.2.4. Chemical Intermediate
- 11.2.5. Personal Care
- 11.2.6. Other Applications
- 11.1. Market Analysis, Insights and Forecast - by Product Type
- 12. Competitive Analysis
- 12.1. Company Profiles
- 12.1.1 Occidental Petroleum Corporation
- 12.1.1.1. Company Overview
- 12.1.1.2. Products
- 12.1.1.3. Company Financials
- 12.1.1.4. SWOT Analysis
- 12.1.2 Tokyo Chemical Industry Co Ltd*List Not Exhaustive
- 12.1.2.1. Company Overview
- 12.1.2.2. Products
- 12.1.2.3. Company Financials
- 12.1.2.4. SWOT Analysis
- 12.1.3 AGC Chemicals
- 12.1.3.1. Company Overview
- 12.1.3.2. Products
- 12.1.3.3. Company Financials
- 12.1.3.4. SWOT Analysis
- 12.1.4 KEM ONE
- 12.1.4.1. Company Overview
- 12.1.4.2. Products
- 12.1.4.3. Company Financials
- 12.1.4.4. SWOT Analysis
- 12.1.5 Nouryon
- 12.1.5.1. Company Overview
- 12.1.5.2. Products
- 12.1.5.3. Company Financials
- 12.1.5.4. SWOT Analysis
- 12.1.6 Merck KGaA
- 12.1.6.1. Company Overview
- 12.1.6.2. Products
- 12.1.6.3. Company Financials
- 12.1.6.4. SWOT Analysis
- 12.1.7 Tokuyama Corporation
- 12.1.7.1. Company Overview
- 12.1.7.2. Products
- 12.1.7.3. Company Financials
- 12.1.7.4. SWOT Analysis
- 12.1.8 The Sanmar Group
- 12.1.8.1. Company Overview
- 12.1.8.2. Products
- 12.1.8.3. Company Financials
- 12.1.8.4. SWOT Analysis
- 12.1.9 Gujarat Alkalies and Chemical Limited
- 12.1.9.1. Company Overview
- 12.1.9.2. Products
- 12.1.9.3. Company Financials
- 12.1.9.4. SWOT Analysis
- 12.1.10 Shin-Etsu Chemical Co Ltd
- 12.1.10.1. Company Overview
- 12.1.10.2. Products
- 12.1.10.3. Company Financials
- 12.1.10.4. SWOT Analysis
- 12.1.11 Gujarat Fluorochemicals Limited
- 12.1.11.1. Company Overview
- 12.1.11.2. Products
- 12.1.11.3. Company Financials
- 12.1.11.4. SWOT Analysis
- 12.1.1 Occidental Petroleum Corporation
- 12.2. Market Entropy
- 12.2.1 Company's Key Areas Served
- 12.2.2 Recent Developments
- 12.3. Company Market Share Analysis 2025
- 12.3.1 Top 5 Companies Market Share Analysis
- 12.3.2 Top 3 Companies Market Share Analysis
- 12.4. List of Potential Customers
- 13. Research Methodology
List of Figures
- Figure 1: Global Chloromethane Industry Revenue Breakdown (billion, %) by Region 2025 & 2033
- Figure 2: Asia Pacific Chloromethane Industry Revenue (billion), by Product Type 2025 & 2033
- Figure 3: Asia Pacific Chloromethane Industry Revenue Share (%), by Product Type 2025 & 2033
- Figure 4: Asia Pacific Chloromethane Industry Revenue (billion), by Application 2025 & 2033
- Figure 5: Asia Pacific Chloromethane Industry Revenue Share (%), by Application 2025 & 2033
- Figure 6: Asia Pacific Chloromethane Industry Revenue (billion), by Country 2025 & 2033
- Figure 7: Asia Pacific Chloromethane Industry Revenue Share (%), by Country 2025 & 2033
- Figure 8: North America Chloromethane Industry Revenue (billion), by Product Type 2025 & 2033
- Figure 9: North America Chloromethane Industry Revenue Share (%), by Product Type 2025 & 2033
- Figure 10: North America Chloromethane Industry Revenue (billion), by Application 2025 & 2033
- Figure 11: North America Chloromethane Industry Revenue Share (%), by Application 2025 & 2033
- Figure 12: North America Chloromethane Industry Revenue (billion), by Country 2025 & 2033
- Figure 13: North America Chloromethane Industry Revenue Share (%), by Country 2025 & 2033
- Figure 14: Europe Chloromethane Industry Revenue (billion), by Product Type 2025 & 2033
- Figure 15: Europe Chloromethane Industry Revenue Share (%), by Product Type 2025 & 2033
- Figure 16: Europe Chloromethane Industry Revenue (billion), by Application 2025 & 2033
- Figure 17: Europe Chloromethane Industry Revenue Share (%), by Application 2025 & 2033
- Figure 18: Europe Chloromethane Industry Revenue (billion), by Country 2025 & 2033
- Figure 19: Europe Chloromethane Industry Revenue Share (%), by Country 2025 & 2033
- Figure 20: South America Chloromethane Industry Revenue (billion), by Product Type 2025 & 2033
- Figure 21: South America Chloromethane Industry Revenue Share (%), by Product Type 2025 & 2033
- Figure 22: South America Chloromethane Industry Revenue (billion), by Application 2025 & 2033
- Figure 23: South America Chloromethane Industry Revenue Share (%), by Application 2025 & 2033
- Figure 24: South America Chloromethane Industry Revenue (billion), by Country 2025 & 2033
- Figure 25: South America Chloromethane Industry Revenue Share (%), by Country 2025 & 2033
- Figure 26: Middle East and Africa Chloromethane Industry Revenue (billion), by Product Type 2025 & 2033
- Figure 27: Middle East and Africa Chloromethane Industry Revenue Share (%), by Product Type 2025 & 2033
- Figure 28: Middle East and Africa Chloromethane Industry Revenue (billion), by Application 2025 & 2033
- Figure 29: Middle East and Africa Chloromethane Industry Revenue Share (%), by Application 2025 & 2033
- Figure 30: Middle East and Africa Chloromethane Industry Revenue (billion), by Country 2025 & 2033
- Figure 31: Middle East and Africa Chloromethane Industry Revenue Share (%), by Country 2025 & 2033
List of Tables
- Table 1: Global Chloromethane Industry Revenue billion Forecast, by Product Type 2020 & 2033
- Table 2: Global Chloromethane Industry Revenue billion Forecast, by Application 2020 & 2033
- Table 3: Global Chloromethane Industry Revenue billion Forecast, by Region 2020 & 2033
- Table 4: Global Chloromethane Industry Revenue billion Forecast, by Product Type 2020 & 2033
- Table 5: Global Chloromethane Industry Revenue billion Forecast, by Application 2020 & 2033
- Table 6: Global Chloromethane Industry Revenue billion Forecast, by Country 2020 & 2033
- Table 7: China Chloromethane Industry Revenue (billion) Forecast, by Application 2020 & 2033
- Table 8: India Chloromethane Industry Revenue (billion) Forecast, by Application 2020 & 2033
- Table 9: Japan Chloromethane Industry Revenue (billion) Forecast, by Application 2020 & 2033
- Table 10: South Korea Chloromethane Industry Revenue (billion) Forecast, by Application 2020 & 2033
- Table 11: Rest of Asia Pacific Chloromethane Industry Revenue (billion) Forecast, by Application 2020 & 2033
- Table 12: Global Chloromethane Industry Revenue billion Forecast, by Product Type 2020 & 2033
- Table 13: Global Chloromethane Industry Revenue billion Forecast, by Application 2020 & 2033
- Table 14: Global Chloromethane Industry Revenue billion Forecast, by Country 2020 & 2033
- Table 15: United States Chloromethane Industry Revenue (billion) Forecast, by Application 2020 & 2033
- Table 16: Canada Chloromethane Industry Revenue (billion) Forecast, by Application 2020 & 2033
- Table 17: Mexico Chloromethane Industry Revenue (billion) Forecast, by Application 2020 & 2033
- Table 18: Global Chloromethane Industry Revenue billion Forecast, by Product Type 2020 & 2033
- Table 19: Global Chloromethane Industry Revenue billion Forecast, by Application 2020 & 2033
- Table 20: Global Chloromethane Industry Revenue billion Forecast, by Country 2020 & 2033
- Table 21: Germany Chloromethane Industry Revenue (billion) Forecast, by Application 2020 & 2033
- Table 22: United Kingdom Chloromethane Industry Revenue (billion) Forecast, by Application 2020 & 2033
- Table 23: Italy Chloromethane Industry Revenue (billion) Forecast, by Application 2020 & 2033
- Table 24: France Chloromethane Industry Revenue (billion) Forecast, by Application 2020 & 2033
- Table 25: Rest of Europe Chloromethane Industry Revenue (billion) Forecast, by Application 2020 & 2033
- Table 26: Global Chloromethane Industry Revenue billion Forecast, by Product Type 2020 & 2033
- Table 27: Global Chloromethane Industry Revenue billion Forecast, by Application 2020 & 2033
- Table 28: Global Chloromethane Industry Revenue billion Forecast, by Country 2020 & 2033
- Table 29: Brazil Chloromethane Industry Revenue (billion) Forecast, by Application 2020 & 2033
- Table 30: Argentina Chloromethane Industry Revenue (billion) Forecast, by Application 2020 & 2033
- Table 31: Rest of South America Chloromethane Industry Revenue (billion) Forecast, by Application 2020 & 2033
- Table 32: Global Chloromethane Industry Revenue billion Forecast, by Product Type 2020 & 2033
- Table 33: Global Chloromethane Industry Revenue billion Forecast, by Application 2020 & 2033
- Table 34: Global Chloromethane Industry Revenue billion Forecast, by Country 2020 & 2033
- Table 35: Saudi Arabia Chloromethane Industry Revenue (billion) Forecast, by Application 2020 & 2033
- Table 36: South Africa Chloromethane Industry Revenue (billion) Forecast, by Application 2020 & 2033
- Table 37: Rest of Middle East and Africa Chloromethane Industry Revenue (billion) Forecast, by Application 2020 & 2033
Frequently Asked Questions
1. What is the projected Compound Annual Growth Rate (CAGR) of the Chloromethane Industry?
The projected CAGR is approximately 5.2%.
2. Which companies are prominent players in the Chloromethane Industry?
Key companies in the market include Occidental Petroleum Corporation, Tokyo Chemical Industry Co Ltd*List Not Exhaustive, AGC Chemicals, KEM ONE, Nouryon, Merck KGaA, Tokuyama Corporation, The Sanmar Group, Gujarat Alkalies and Chemical Limited, Shin-Etsu Chemical Co Ltd, Gujarat Fluorochemicals Limited.
3. What are the main segments of the Chloromethane Industry?
The market segments include Product Type, Application.
4. Can you provide details about the market size?
The market size is estimated to be USD 6.1 billion as of 2022.
5. What are some drivers contributing to market growth?
Increasing Usage of Silicone in Various End-user Industries; Growing Demand from the Pharmaceutical and Personal Care Industries.
6. What are the notable trends driving market growth?
Increasing Usage of Silicone in Various End-user Industries.
7. Are there any restraints impacting market growth?
Stringent Regulations on Chloromethane; Negative Impact of the COVID-19 Pandemic.
8. Can you provide examples of recent developments in the market?
January 2023: Nouryon, a global leader in specialty chemicals, announced the acquisition of a Poland-based supplier of chelated micronutrients, foliar, and other specialty agricultural solutions. With this acquisition, the company would be able to expand its services and product offerings for customers in the industry,
9. What pricing options are available for accessing the report?
Pricing options include single-user, multi-user, and enterprise licenses priced at USD 4750, USD 5250, and USD 8750 respectively.
10. Is the market size provided in terms of value or volume?
The market size is provided in terms of value, measured in billion.
11. Are there any specific market keywords associated with the report?
Yes, the market keyword associated with the report is "Chloromethane Industry," which aids in identifying and referencing the specific market segment covered.
12. How do I determine which pricing option suits my needs best?
The pricing options vary based on user requirements and access needs. Individual users may opt for single-user licenses, while businesses requiring broader access may choose multi-user or enterprise licenses for cost-effective access to the report.
13. Are there any additional resources or data provided in the Chloromethane Industry report?
While the report offers comprehensive insights, it's advisable to review the specific contents or supplementary materials provided to ascertain if additional resources or data are available.
14. How can I stay updated on further developments or reports in the Chloromethane Industry?
To stay informed about further developments, trends, and reports in the Chloromethane Industry, consider subscribing to industry newsletters, following relevant companies and organizations, or regularly checking reputable industry news sources and publications.
Methodology
Step 1 - Identification of Relevant Samples Size from Population Database


Step 2 - Approaches for Defining Global Market Size (Value, Volume* & Price*)

Note*: In applicable scenarios
Step 3 - Data Sources
Primary Research
- Web Analytics
- Survey Reports
- Research Institute
- Latest Research Reports
- Opinion Leaders
Secondary Research
- Annual Reports
- White Paper
- Latest Press Release
- Industry Association
- Paid Database
- Investor Presentations

Step 4 - Data Triangulation
Involves using different sources of information in order to increase the validity of a study
These sources are likely to be stakeholders in a program - participants, other researchers, program staff, other community members, and so on.
Then we put all data in single framework & apply various statistical tools to find out the dynamic on the market.
During the analysis stage, feedback from the stakeholder groups would be compared to determine areas of agreement as well as areas of divergence