

Key Insights
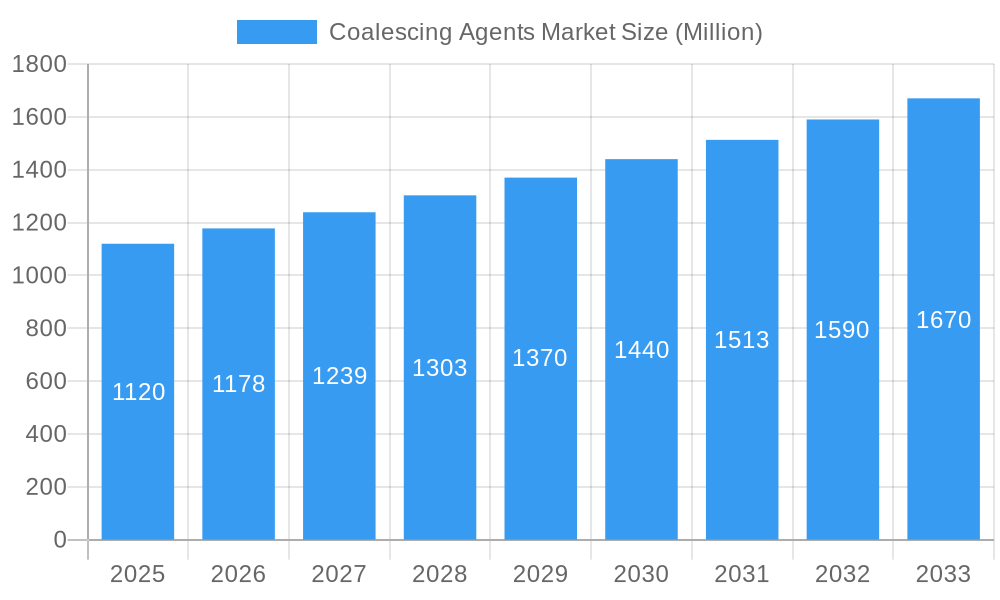
The global Coalescing Agents Market is poised for robust growth, projected to reach approximately USD 1.12 billion, driven by a Compound Annual Growth Rate (CAGR) of 4.96% from 2025 to 2033. This sustained expansion is primarily fueled by the burgeoning demand from key end-use industries such as Adhesives & Sealants, Paints & Coatings, and Personal Care. The increasing adoption of low-VOC (Volatile Organic Compound) and waterborne formulations across these sectors is a significant catalyst, as coalescing agents play a crucial role in film formation and enhancing the performance properties of these eco-friendly alternatives. Furthermore, technological advancements leading to the development of more efficient and sustainable coalescing agents are contributing to market dynamism. The growth in construction activities, automotive production, and the increasing consumer focus on personal grooming products further bolsters the demand for coalescing agents.
Coalescing Agents Market Market Size (In Billion)
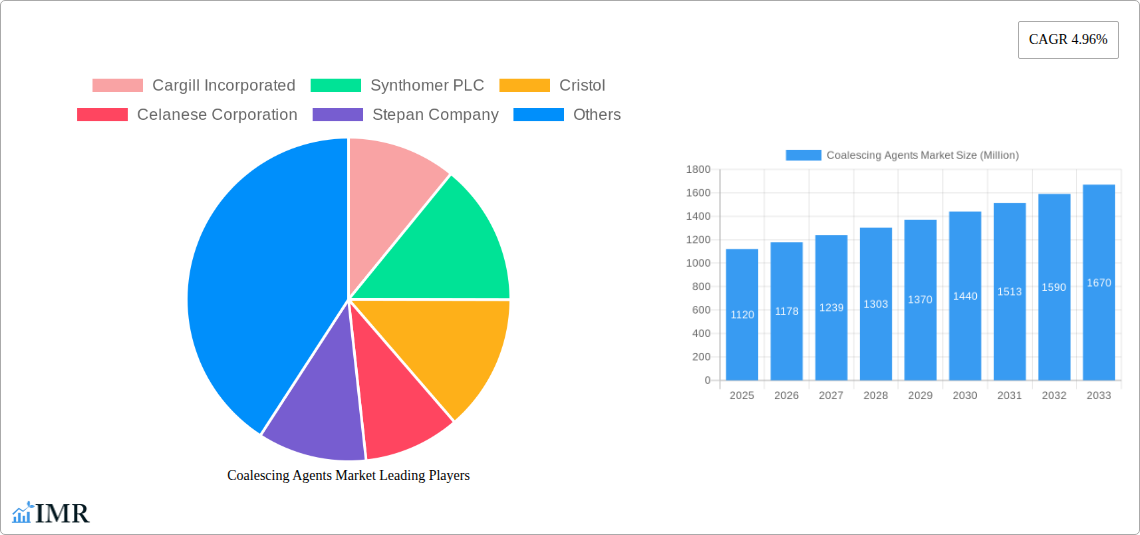
Despite the positive outlook, the market faces certain restraints, including the fluctuating raw material prices and increasing regulatory scrutiny regarding environmental impact. However, the industry is actively innovating to address these challenges through the development of bio-based and high-performance coalescing agents. The market is segmented into Hydrophilic and Hydrophobic types, with Hydrophobic coalescing agents holding a larger market share due to their wider applicability in various formulations. Geographically, the Asia Pacific region, led by China and India, is expected to exhibit the fastest growth, owing to rapid industrialization, urbanization, and a growing middle class. North America and Europe remain significant markets, driven by stringent environmental regulations and a mature paints and coatings industry. Key players like Cargill Incorporated, Synthomer PLC, BASF SE, and Dow are actively investing in research and development to capture market share and introduce innovative solutions.
Coalescing Agents Market Company Market Share
This in-depth report provides a detailed examination of the global coalescing agents market, offering critical insights into its dynamics, growth trends, regional dominance, product landscape, and future opportunities. Covering a study period from 2019 to 2033, with a base and estimated year of 2025, this report is an indispensable resource for industry stakeholders seeking to navigate this evolving sector.
Coalescing Agents Market Dynamics & Structure
The coalescing agents market exhibits a moderately concentrated structure, with key players like BASF SE, Dow, and Celanese Corporation holding significant market share. Technological innovation remains a primary driver, with ongoing research focused on developing low-VOC (Volatile Organic Compound) and eco-friendly coalescing agents to meet stringent environmental regulations. Regulatory frameworks, particularly those concerning emissions and sustainability in the paints & coatings and adhesives industries, are shaping product development and market entry strategies. Competitive product substitutes, such as other film-forming aids, present a challenge, but the unique performance benefits of coalescing agents in applications like paints & coatings and adhesives & sealants continue to ensure their demand. End-user demographics are shifting towards sustainability-conscious consumers and industries, influencing the demand for greener alternatives. Mergers & Acquisitions (M&A) activity in the sector aims to consolidate market positions, expand product portfolios, and enhance geographical reach. For instance, recent M&A deals in the specialty chemicals sector indicate a trend towards vertical integration and acquiring innovative technologies.
- Market Concentration: Moderately concentrated with a few dominant global players.
- Technological Innovation Drivers: Development of low-VOC, biodegradable, and high-performance coalescing agents.
- Regulatory Frameworks: Stringent environmental regulations (e.g., REACH, TSCA) driving demand for sustainable solutions.
- Competitive Product Substitutes: Other film-forming aids and alternative technologies, although coalescing agents offer specific performance advantages.
- End-User Demographics: Growing demand from environmentally conscious industries and consumers.
- M&A Trends: Strategic acquisitions focused on technology, market access, and portfolio expansion.
Coalescing Agents Market Growth Trends & Insights
The global coalescing agents market is poised for robust growth, driven by the insatiable demand from its primary applications and the increasing emphasis on sustainable and high-performance formulations. The market size evolution is marked by a consistent upward trajectory, projected to reach significant valuations by 2033. Adoption rates of advanced coalescing agents are accelerating, fueled by the need for improved film formation, durability, and aesthetic qualities in paints & coatings, adhesives & sealants, and inks. Technological disruptions, such as the development of novel coalescing agents with enhanced properties and reduced environmental impact, are redefining market standards. Consumer behavior shifts, particularly the growing preference for water-borne coatings and eco-friendly products, are acting as significant catalysts. For example, the demand for low-VOC paints in architectural and automotive applications is directly translating into increased consumption of appropriate coalescing agents. The market penetration of high-performance coalescing agents is also on the rise, as manufacturers strive to meet increasingly demanding performance specifications across various industries. The projected Compound Annual Growth Rate (CAGR) for the forecast period is robust, reflecting the sector's inherent strength and the ongoing innovation within it. The shift towards sustainable construction and the automotive industry's focus on lightweighting and durable finishes further contribute to this positive outlook.
Dominant Regions, Countries, or Segments in Coalescing Agents Market
The Paints & Coatings segment, particularly in the Asia Pacific region, stands out as the dominant force in the global coalescing agents market. This dominance is attributed to a confluence of factors including rapid industrialization, burgeoning construction activities, and a growing automotive manufacturing base. Countries like China and India are at the forefront of this growth, propelled by favorable economic policies, substantial infrastructure development projects, and a large, expanding consumer base. The increasing urbanization and disposable incomes in these nations directly translate into higher demand for decorative and protective coatings, consequently boosting the consumption of coalescing agents. Furthermore, the stringent environmental regulations being implemented across the globe are indirectly benefiting the Asia Pacific region, as manufacturers are compelled to adopt advanced, low-VOC coalescing agents for their export markets.
Dominant Segment: Paints & Coatings
- Key Drivers: Rapid urbanization, infrastructure development, automotive production, stringent environmental regulations.
- Market Share: Holds the largest share due to widespread application in architectural, industrial, and automotive coatings.
- Growth Potential: Continued expansion driven by demand for high-performance and eco-friendly formulations.
Dominant Region: Asia Pacific
- Key Drivers: Economic growth, significant construction and automotive industries in China and India, increasing environmental awareness.
- Market Share: Leading market due to high production volumes and consumption of coatings and adhesives.
- Growth Potential: Sustained growth fueled by ongoing development and increasing adoption of advanced technologies.
Within the Type segment, hydrophobic coalescing agents are gaining significant traction due to their superior film-forming capabilities and ability to enhance properties like water resistance and durability, particularly in demanding applications. In the Application segment, beyond Paints & Coatings, Adhesives & Sealants represent a substantial and growing market for coalescing agents, driven by the construction, automotive, and packaging industries. The versatility of coalescing agents in improving the performance and application characteristics of these products is a key enabler of their market penetration.
Coalescing Agents Market Product Landscape
The product landscape of coalescing agents is characterized by continuous innovation aimed at enhancing performance and sustainability. Key product advancements include the development of coalescing agents with improved efficiency, meaning lower usage levels achieve optimal film formation. This translates to cost savings and reduced environmental impact. Furthermore, there is a significant focus on coalescing agents that are compatible with water-borne formulations, catering to the industry's shift away from solvent-based systems. Unique selling propositions often revolve around low-VOC content, excellent film integrity, improved scrub resistance, and enhanced adhesion properties. Technological advancements are also leading to coalescing agents that offer specialized benefits, such as improved low-temperature performance or faster drying times, expanding their applicability across diverse end-use industries.
Key Drivers, Barriers & Challenges in Coalescing Agents Market
Key Drivers:
The coalescing agents market is propelled by several key drivers. The escalating demand for high-performance paints and coatings with enhanced durability, aesthetic appeal, and protective properties is a primary motivator. Stringent environmental regulations worldwide, pushing for lower VOC emissions, are driving the adoption of more sustainable coalescing agent technologies, particularly in water-borne systems. The robust growth of end-user industries such as construction, automotive, and packaging further fuels market expansion. Technological advancements in formulation chemistry are leading to the development of more efficient and versatile coalescing agents.
Barriers & Challenges:
Despite the positive outlook, the market faces certain barriers and challenges. Volatility in raw material prices, particularly for petrochemical derivatives, can impact production costs and profit margins. The presence of competing film-forming aids and alternative technologies poses a competitive threat. Navigating complex and evolving regulatory landscapes across different regions requires significant investment in compliance and product development. Supply chain disruptions, as witnessed in recent global events, can affect the availability and cost of raw materials, impacting production schedules. Overcoming the perception of higher initial costs for certain high-performance or eco-friendly coalescing agents compared to traditional options can also be a challenge.
Emerging Opportunities in Coalescing Agents Market
Emerging opportunities in the coalescing agents market are largely centered around sustainability and specialized applications. The growing demand for bio-based and biodegradable coalescing agents presents a significant untapped market. Innovations in coalescing agents designed for niche applications, such as advanced composites, specialized inks for digital printing, and high-performance sealants for renewable energy infrastructure, offer considerable growth potential. Evolving consumer preferences for healthy indoor environments are also creating opportunities for low-odor and non-toxic coalescing agents in architectural coatings. The development of coalescing agents that enable energy-efficient manufacturing processes for end products is another area ripe for exploration.
Growth Accelerators in the Coalescing Agents Market Industry
The long-term growth of the coalescing agents market is being significantly accelerated by ongoing technological breakthroughs. The development of novel polymer chemistries and additive technologies is leading to the creation of coalescing agents with superior performance characteristics, such as enhanced film flexibility, improved weathering resistance, and greater chemical inertness. Strategic partnerships between raw material suppliers, coalescing agent manufacturers, and end-product formulators are crucial for co-developing innovative solutions tailored to specific market needs. Market expansion strategies, particularly focusing on emerging economies with rapidly developing industrial sectors, are also acting as significant growth accelerators. The increasing adoption of advanced manufacturing techniques and the integration of digital technologies in the production of coalescing agents are further contributing to efficiency and scalability.
Key Players Shaping the Coalescing Agents Market Market
- Cargill Incorporated
- Synthomer PLC
- Cristol
- Celanese Corporation
- Stepan Company
- Runtai Chemical Co Ltd
- BASF SE
- Arkema Group
- Rudolf GmbH
- Dow
- Eastman Chemical Company
Notable Milestones in Coalescing Agents Market Sector
- 2019: Launch of a new line of low-VOC coalescing agents by BASF SE, responding to evolving environmental regulations.
- 2020: Synthomer PLC acquires a specialty chemical company, expanding its portfolio of coalescing agents for the coatings sector.
- 2021: Dow introduces a bio-based coalescing agent, marking a significant step towards sustainable solutions.
- 2022: Stepan Company announces increased production capacity for its high-performance coalescing agents to meet growing demand.
- 2023: Arkema Group launches an innovative coalescing agent offering enhanced durability for automotive coatings.
- 2024: Celanese Corporation invests in research and development for novel coalescing agents with improved low-temperature performance.
In-Depth Coalescing Agents Market Market Outlook
The future outlook for the coalescing agents market remains exceptionally strong, underpinned by sustained demand from its core applications and a clear shift towards sustainable and high-performance formulations. Growth accelerators, including continuous technological innovation, strategic collaborations, and targeted market expansion, will continue to shape the industry. The increasing adoption of water-borne systems across paints & coatings, adhesives, and inks presents a significant and growing opportunity for advanced coalescing agents. Furthermore, the development of specialized coalescing agents for emerging industries and niche applications will unlock new revenue streams. The market is poised for dynamic evolution, driven by an unwavering commitment to performance, environmental responsibility, and customer-centric solutions, ensuring its continued relevance and growth in the global chemical landscape.
Coalescing Agents Market Segmentation
-
1. Type
- 1.1. Hydrophilic
- 1.2. Hydrophobic
-
2. Application
- 2.1. Adhesives & Sealants
- 2.2. Paints & Coatings
- 2.3. Inks
- 2.4. Personal Care
- 2.5. Other Applications (Decoloring, Polymer, etc.)
Coalescing Agents Market Segmentation By Geography
-
1. Asia Pacific
- 1.1. China
- 1.2. India
- 1.3. Japan
- 1.4. South Korea
- 1.5. Malaysia
- 1.6. Thailand
- 1.7. Indonesia
- 1.8. Vietnam
- 1.9. Rest of Asia Pacific
-
2. North America
- 2.1. United States
- 2.2. Canada
- 2.3. Mexico
-
3. Europe
- 3.1. Germany
- 3.2. United Kingdom
- 3.3. Italy
- 3.4. France
- 3.5. Spain
- 3.6. NORDIC Countries
- 3.7. Turkey
- 3.8. Russia
- 3.9. Rest of Europe
-
4. South America
- 4.1. Brazil
- 4.2. Argentina
- 4.3. Colombia
- 4.4. Rest of South America
-
5. Middle East and Africa
- 5.1. Saudi Arabia
- 5.2. South Africa
- 5.3. Nigeria
- 5.4. Qatar
- 5.5. Egypt
- 5.6. United Arab Emirates
- 5.7. Rest of Middle East and Africa
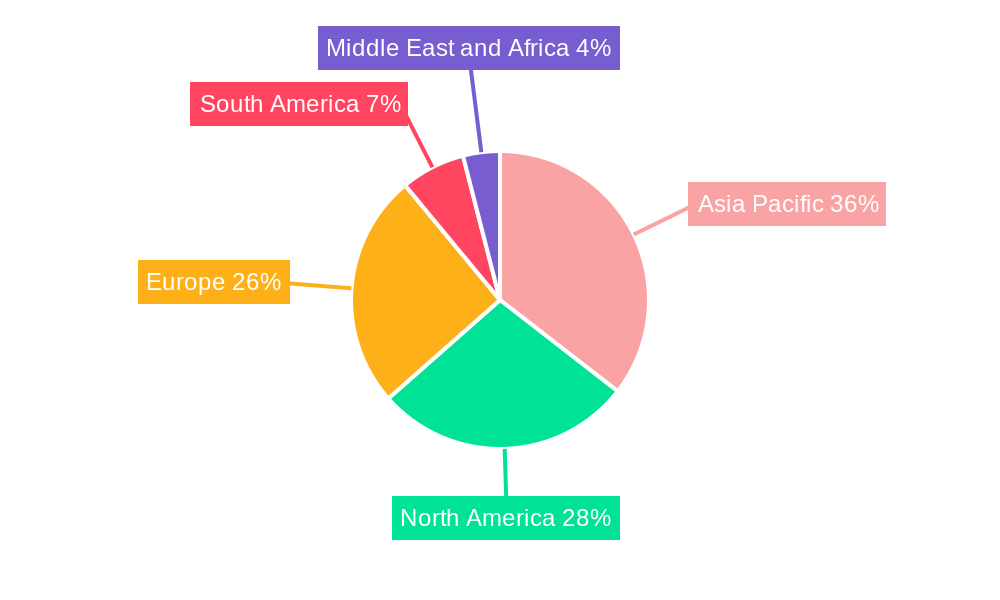
Coalescing Agents Market Regional Market Share
Geographic Coverage of Coalescing Agents Market
Coalescing Agents Market REPORT HIGHLIGHTS
| Aspects | Details |
|---|---|
| Study Period | 2020-2034 |
| Base Year | 2025 |
| Estimated Year | 2026 |
| Forecast Period | 2026-2034 |
| Historical Period | 2020-2025 |
| Growth Rate | CAGR of 4.96% from 2020-2034 |
| Segmentation |
|
Table of Contents
- 1. Introduction
- 1.1. Research Scope
- 1.2. Market Segmentation
- 1.3. Research Objective
- 1.4. Definitions and Assumptions
- 2. Executive Summary
- 2.1. Market Snapshot
- 3. Market Dynamics
- 3.1. Market Drivers
- 3.2. Market Restrains
- 3.3. Market Trends
- 3.4. Market Opportunities
- 4. Market Factor Analysis
- 4.1. Porters Five Forces
- 4.1.1. Bargaining Power of Suppliers
- 4.1.2. Bargaining Power of Buyers
- 4.1.3. Threat of New Entrants
- 4.1.4. Threat of Substitutes
- 4.1.5. Competitive Rivalry
- 4.2. PESTEL analysis
- 4.3. BCG Analysis
- 4.3.1. Stars (High Growth, High Market Share)
- 4.3.2. Cash Cows (Low Growth, High Market Share)
- 4.3.3. Question Mark (High Growth, Low Market Share)
- 4.3.4. Dogs (Low Growth, Low Market Share)
- 4.4. Ansoff Matrix Analysis
- 4.5. Supply Chain Analysis
- 4.6. Regulatory Landscape
- 4.7. Current Market Potential and Opportunity Assessment (TAM–SAM–SOM Framework)
- 4.8. IMR Analyst Note
- 4.1. Porters Five Forces
- 5. Market Analysis, Insights and Forecast 2021-2033
- 5.1. Market Analysis, Insights and Forecast - by Type
- 5.1.1. Hydrophilic
- 5.1.2. Hydrophobic
- 5.2. Market Analysis, Insights and Forecast - by Application
- 5.2.1. Adhesives & Sealants
- 5.2.2. Paints & Coatings
- 5.2.3. Inks
- 5.2.4. Personal Care
- 5.2.5. Other Applications (Decoloring, Polymer, etc.)
- 5.3. Market Analysis, Insights and Forecast - by Region
- 5.3.1. Asia Pacific
- 5.3.2. North America
- 5.3.3. Europe
- 5.3.4. South America
- 5.3.5. Middle East and Africa
- 5.1. Market Analysis, Insights and Forecast - by Type
- 6. Global Coalescing Agents Market Analysis, Insights and Forecast, 2021-2033
- 6.1. Market Analysis, Insights and Forecast - by Type
- 6.1.1. Hydrophilic
- 6.1.2. Hydrophobic
- 6.2. Market Analysis, Insights and Forecast - by Application
- 6.2.1. Adhesives & Sealants
- 6.2.2. Paints & Coatings
- 6.2.3. Inks
- 6.2.4. Personal Care
- 6.2.5. Other Applications (Decoloring, Polymer, etc.)
- 6.1. Market Analysis, Insights and Forecast - by Type
- 7. Asia Pacific Coalescing Agents Market Analysis, Insights and Forecast, 2020-2032
- 7.1. Market Analysis, Insights and Forecast - by Type
- 7.1.1. Hydrophilic
- 7.1.2. Hydrophobic
- 7.2. Market Analysis, Insights and Forecast - by Application
- 7.2.1. Adhesives & Sealants
- 7.2.2. Paints & Coatings
- 7.2.3. Inks
- 7.2.4. Personal Care
- 7.2.5. Other Applications (Decoloring, Polymer, etc.)
- 7.1. Market Analysis, Insights and Forecast - by Type
- 8. North America Coalescing Agents Market Analysis, Insights and Forecast, 2020-2032
- 8.1. Market Analysis, Insights and Forecast - by Type
- 8.1.1. Hydrophilic
- 8.1.2. Hydrophobic
- 8.2. Market Analysis, Insights and Forecast - by Application
- 8.2.1. Adhesives & Sealants
- 8.2.2. Paints & Coatings
- 8.2.3. Inks
- 8.2.4. Personal Care
- 8.2.5. Other Applications (Decoloring, Polymer, etc.)
- 8.1. Market Analysis, Insights and Forecast - by Type
- 9. Europe Coalescing Agents Market Analysis, Insights and Forecast, 2020-2032
- 9.1. Market Analysis, Insights and Forecast - by Type
- 9.1.1. Hydrophilic
- 9.1.2. Hydrophobic
- 9.2. Market Analysis, Insights and Forecast - by Application
- 9.2.1. Adhesives & Sealants
- 9.2.2. Paints & Coatings
- 9.2.3. Inks
- 9.2.4. Personal Care
- 9.2.5. Other Applications (Decoloring, Polymer, etc.)
- 9.1. Market Analysis, Insights and Forecast - by Type
- 10. South America Coalescing Agents Market Analysis, Insights and Forecast, 2020-2032
- 10.1. Market Analysis, Insights and Forecast - by Type
- 10.1.1. Hydrophilic
- 10.1.2. Hydrophobic
- 10.2. Market Analysis, Insights and Forecast - by Application
- 10.2.1. Adhesives & Sealants
- 10.2.2. Paints & Coatings
- 10.2.3. Inks
- 10.2.4. Personal Care
- 10.2.5. Other Applications (Decoloring, Polymer, etc.)
- 10.1. Market Analysis, Insights and Forecast - by Type
- 11. Middle East and Africa Coalescing Agents Market Analysis, Insights and Forecast, 2020-2032
- 11.1. Market Analysis, Insights and Forecast - by Type
- 11.1.1. Hydrophilic
- 11.1.2. Hydrophobic
- 11.2. Market Analysis, Insights and Forecast - by Application
- 11.2.1. Adhesives & Sealants
- 11.2.2. Paints & Coatings
- 11.2.3. Inks
- 11.2.4. Personal Care
- 11.2.5. Other Applications (Decoloring, Polymer, etc.)
- 11.1. Market Analysis, Insights and Forecast - by Type
- 12. Competitive Analysis
- 12.1. Company Profiles
- 12.1.1 Cargill Incorporated
- 12.1.1.1. Company Overview
- 12.1.1.2. Products
- 12.1.1.3. Company Financials
- 12.1.1.4. SWOT Analysis
- 12.1.2 Synthomer PLC
- 12.1.2.1. Company Overview
- 12.1.2.2. Products
- 12.1.2.3. Company Financials
- 12.1.2.4. SWOT Analysis
- 12.1.3 Cristol
- 12.1.3.1. Company Overview
- 12.1.3.2. Products
- 12.1.3.3. Company Financials
- 12.1.3.4. SWOT Analysis
- 12.1.4 Celanese Corporation
- 12.1.4.1. Company Overview
- 12.1.4.2. Products
- 12.1.4.3. Company Financials
- 12.1.4.4. SWOT Analysis
- 12.1.5 Stepan Company
- 12.1.5.1. Company Overview
- 12.1.5.2. Products
- 12.1.5.3. Company Financials
- 12.1.5.4. SWOT Analysis
- 12.1.6 Runtai Chemical Co Ltd
- 12.1.6.1. Company Overview
- 12.1.6.2. Products
- 12.1.6.3. Company Financials
- 12.1.6.4. SWOT Analysis
- 12.1.7 BASF SE
- 12.1.7.1. Company Overview
- 12.1.7.2. Products
- 12.1.7.3. Company Financials
- 12.1.7.4. SWOT Analysis
- 12.1.8 Arkema Group
- 12.1.8.1. Company Overview
- 12.1.8.2. Products
- 12.1.8.3. Company Financials
- 12.1.8.4. SWOT Analysis
- 12.1.9 Rudolf GmbH
- 12.1.9.1. Company Overview
- 12.1.9.2. Products
- 12.1.9.3. Company Financials
- 12.1.9.4. SWOT Analysis
- 12.1.10 Dow
- 12.1.10.1. Company Overview
- 12.1.10.2. Products
- 12.1.10.3. Company Financials
- 12.1.10.4. SWOT Analysis
- 12.1.11 Eastman Chemical Company
- 12.1.11.1. Company Overview
- 12.1.11.2. Products
- 12.1.11.3. Company Financials
- 12.1.11.4. SWOT Analysis
- 12.1.1 Cargill Incorporated
- 12.2. Market Entropy
- 12.2.1 Company's Key Areas Served
- 12.2.2 Recent Developments
- 12.3. Company Market Share Analysis 2025
- 12.3.1 Top 5 Companies Market Share Analysis
- 12.3.2 Top 3 Companies Market Share Analysis
- 12.4. List of Potential Customers
- 13. Research Methodology
List of Figures
- Figure 1: Global Coalescing Agents Market Revenue Breakdown (Million, %) by Region 2025 & 2033
- Figure 2: Global Coalescing Agents Market Volume Breakdown (K Tons, %) by Region 2025 & 2033
- Figure 3: Asia Pacific Coalescing Agents Market Revenue (Million), by Type 2025 & 2033
- Figure 4: Asia Pacific Coalescing Agents Market Volume (K Tons), by Type 2025 & 2033
- Figure 5: Asia Pacific Coalescing Agents Market Revenue Share (%), by Type 2025 & 2033
- Figure 6: Asia Pacific Coalescing Agents Market Volume Share (%), by Type 2025 & 2033
- Figure 7: Asia Pacific Coalescing Agents Market Revenue (Million), by Application 2025 & 2033
- Figure 8: Asia Pacific Coalescing Agents Market Volume (K Tons), by Application 2025 & 2033
- Figure 9: Asia Pacific Coalescing Agents Market Revenue Share (%), by Application 2025 & 2033
- Figure 10: Asia Pacific Coalescing Agents Market Volume Share (%), by Application 2025 & 2033
- Figure 11: Asia Pacific Coalescing Agents Market Revenue (Million), by Country 2025 & 2033
- Figure 12: Asia Pacific Coalescing Agents Market Volume (K Tons), by Country 2025 & 2033
- Figure 13: Asia Pacific Coalescing Agents Market Revenue Share (%), by Country 2025 & 2033
- Figure 14: Asia Pacific Coalescing Agents Market Volume Share (%), by Country 2025 & 2033
- Figure 15: North America Coalescing Agents Market Revenue (Million), by Type 2025 & 2033
- Figure 16: North America Coalescing Agents Market Volume (K Tons), by Type 2025 & 2033
- Figure 17: North America Coalescing Agents Market Revenue Share (%), by Type 2025 & 2033
- Figure 18: North America Coalescing Agents Market Volume Share (%), by Type 2025 & 2033
- Figure 19: North America Coalescing Agents Market Revenue (Million), by Application 2025 & 2033
- Figure 20: North America Coalescing Agents Market Volume (K Tons), by Application 2025 & 2033
- Figure 21: North America Coalescing Agents Market Revenue Share (%), by Application 2025 & 2033
- Figure 22: North America Coalescing Agents Market Volume Share (%), by Application 2025 & 2033
- Figure 23: North America Coalescing Agents Market Revenue (Million), by Country 2025 & 2033
- Figure 24: North America Coalescing Agents Market Volume (K Tons), by Country 2025 & 2033
- Figure 25: North America Coalescing Agents Market Revenue Share (%), by Country 2025 & 2033
- Figure 26: North America Coalescing Agents Market Volume Share (%), by Country 2025 & 2033
- Figure 27: Europe Coalescing Agents Market Revenue (Million), by Type 2025 & 2033
- Figure 28: Europe Coalescing Agents Market Volume (K Tons), by Type 2025 & 2033
- Figure 29: Europe Coalescing Agents Market Revenue Share (%), by Type 2025 & 2033
- Figure 30: Europe Coalescing Agents Market Volume Share (%), by Type 2025 & 2033
- Figure 31: Europe Coalescing Agents Market Revenue (Million), by Application 2025 & 2033
- Figure 32: Europe Coalescing Agents Market Volume (K Tons), by Application 2025 & 2033
- Figure 33: Europe Coalescing Agents Market Revenue Share (%), by Application 2025 & 2033
- Figure 34: Europe Coalescing Agents Market Volume Share (%), by Application 2025 & 2033
- Figure 35: Europe Coalescing Agents Market Revenue (Million), by Country 2025 & 2033
- Figure 36: Europe Coalescing Agents Market Volume (K Tons), by Country 2025 & 2033
- Figure 37: Europe Coalescing Agents Market Revenue Share (%), by Country 2025 & 2033
- Figure 38: Europe Coalescing Agents Market Volume Share (%), by Country 2025 & 2033
- Figure 39: South America Coalescing Agents Market Revenue (Million), by Type 2025 & 2033
- Figure 40: South America Coalescing Agents Market Volume (K Tons), by Type 2025 & 2033
- Figure 41: South America Coalescing Agents Market Revenue Share (%), by Type 2025 & 2033
- Figure 42: South America Coalescing Agents Market Volume Share (%), by Type 2025 & 2033
- Figure 43: South America Coalescing Agents Market Revenue (Million), by Application 2025 & 2033
- Figure 44: South America Coalescing Agents Market Volume (K Tons), by Application 2025 & 2033
- Figure 45: South America Coalescing Agents Market Revenue Share (%), by Application 2025 & 2033
- Figure 46: South America Coalescing Agents Market Volume Share (%), by Application 2025 & 2033
- Figure 47: South America Coalescing Agents Market Revenue (Million), by Country 2025 & 2033
- Figure 48: South America Coalescing Agents Market Volume (K Tons), by Country 2025 & 2033
- Figure 49: South America Coalescing Agents Market Revenue Share (%), by Country 2025 & 2033
- Figure 50: South America Coalescing Agents Market Volume Share (%), by Country 2025 & 2033
- Figure 51: Middle East and Africa Coalescing Agents Market Revenue (Million), by Type 2025 & 2033
- Figure 52: Middle East and Africa Coalescing Agents Market Volume (K Tons), by Type 2025 & 2033
- Figure 53: Middle East and Africa Coalescing Agents Market Revenue Share (%), by Type 2025 & 2033
- Figure 54: Middle East and Africa Coalescing Agents Market Volume Share (%), by Type 2025 & 2033
- Figure 55: Middle East and Africa Coalescing Agents Market Revenue (Million), by Application 2025 & 2033
- Figure 56: Middle East and Africa Coalescing Agents Market Volume (K Tons), by Application 2025 & 2033
- Figure 57: Middle East and Africa Coalescing Agents Market Revenue Share (%), by Application 2025 & 2033
- Figure 58: Middle East and Africa Coalescing Agents Market Volume Share (%), by Application 2025 & 2033
- Figure 59: Middle East and Africa Coalescing Agents Market Revenue (Million), by Country 2025 & 2033
- Figure 60: Middle East and Africa Coalescing Agents Market Volume (K Tons), by Country 2025 & 2033
- Figure 61: Middle East and Africa Coalescing Agents Market Revenue Share (%), by Country 2025 & 2033
- Figure 62: Middle East and Africa Coalescing Agents Market Volume Share (%), by Country 2025 & 2033
List of Tables
- Table 1: Global Coalescing Agents Market Revenue Million Forecast, by Type 2020 & 2033
- Table 2: Global Coalescing Agents Market Volume K Tons Forecast, by Type 2020 & 2033
- Table 3: Global Coalescing Agents Market Revenue Million Forecast, by Application 2020 & 2033
- Table 4: Global Coalescing Agents Market Volume K Tons Forecast, by Application 2020 & 2033
- Table 5: Global Coalescing Agents Market Revenue Million Forecast, by Region 2020 & 2033
- Table 6: Global Coalescing Agents Market Volume K Tons Forecast, by Region 2020 & 2033
- Table 7: Global Coalescing Agents Market Revenue Million Forecast, by Type 2020 & 2033
- Table 8: Global Coalescing Agents Market Volume K Tons Forecast, by Type 2020 & 2033
- Table 9: Global Coalescing Agents Market Revenue Million Forecast, by Application 2020 & 2033
- Table 10: Global Coalescing Agents Market Volume K Tons Forecast, by Application 2020 & 2033
- Table 11: Global Coalescing Agents Market Revenue Million Forecast, by Country 2020 & 2033
- Table 12: Global Coalescing Agents Market Volume K Tons Forecast, by Country 2020 & 2033
- Table 13: China Coalescing Agents Market Revenue (Million) Forecast, by Application 2020 & 2033
- Table 14: China Coalescing Agents Market Volume (K Tons) Forecast, by Application 2020 & 2033
- Table 15: India Coalescing Agents Market Revenue (Million) Forecast, by Application 2020 & 2033
- Table 16: India Coalescing Agents Market Volume (K Tons) Forecast, by Application 2020 & 2033
- Table 17: Japan Coalescing Agents Market Revenue (Million) Forecast, by Application 2020 & 2033
- Table 18: Japan Coalescing Agents Market Volume (K Tons) Forecast, by Application 2020 & 2033
- Table 19: South Korea Coalescing Agents Market Revenue (Million) Forecast, by Application 2020 & 2033
- Table 20: South Korea Coalescing Agents Market Volume (K Tons) Forecast, by Application 2020 & 2033
- Table 21: Malaysia Coalescing Agents Market Revenue (Million) Forecast, by Application 2020 & 2033
- Table 22: Malaysia Coalescing Agents Market Volume (K Tons) Forecast, by Application 2020 & 2033
- Table 23: Thailand Coalescing Agents Market Revenue (Million) Forecast, by Application 2020 & 2033
- Table 24: Thailand Coalescing Agents Market Volume (K Tons) Forecast, by Application 2020 & 2033
- Table 25: Indonesia Coalescing Agents Market Revenue (Million) Forecast, by Application 2020 & 2033
- Table 26: Indonesia Coalescing Agents Market Volume (K Tons) Forecast, by Application 2020 & 2033
- Table 27: Vietnam Coalescing Agents Market Revenue (Million) Forecast, by Application 2020 & 2033
- Table 28: Vietnam Coalescing Agents Market Volume (K Tons) Forecast, by Application 2020 & 2033
- Table 29: Rest of Asia Pacific Coalescing Agents Market Revenue (Million) Forecast, by Application 2020 & 2033
- Table 30: Rest of Asia Pacific Coalescing Agents Market Volume (K Tons) Forecast, by Application 2020 & 2033
- Table 31: Global Coalescing Agents Market Revenue Million Forecast, by Type 2020 & 2033
- Table 32: Global Coalescing Agents Market Volume K Tons Forecast, by Type 2020 & 2033
- Table 33: Global Coalescing Agents Market Revenue Million Forecast, by Application 2020 & 2033
- Table 34: Global Coalescing Agents Market Volume K Tons Forecast, by Application 2020 & 2033
- Table 35: Global Coalescing Agents Market Revenue Million Forecast, by Country 2020 & 2033
- Table 36: Global Coalescing Agents Market Volume K Tons Forecast, by Country 2020 & 2033
- Table 37: United States Coalescing Agents Market Revenue (Million) Forecast, by Application 2020 & 2033
- Table 38: United States Coalescing Agents Market Volume (K Tons) Forecast, by Application 2020 & 2033
- Table 39: Canada Coalescing Agents Market Revenue (Million) Forecast, by Application 2020 & 2033
- Table 40: Canada Coalescing Agents Market Volume (K Tons) Forecast, by Application 2020 & 2033
- Table 41: Mexico Coalescing Agents Market Revenue (Million) Forecast, by Application 2020 & 2033
- Table 42: Mexico Coalescing Agents Market Volume (K Tons) Forecast, by Application 2020 & 2033
- Table 43: Global Coalescing Agents Market Revenue Million Forecast, by Type 2020 & 2033
- Table 44: Global Coalescing Agents Market Volume K Tons Forecast, by Type 2020 & 2033
- Table 45: Global Coalescing Agents Market Revenue Million Forecast, by Application 2020 & 2033
- Table 46: Global Coalescing Agents Market Volume K Tons Forecast, by Application 2020 & 2033
- Table 47: Global Coalescing Agents Market Revenue Million Forecast, by Country 2020 & 2033
- Table 48: Global Coalescing Agents Market Volume K Tons Forecast, by Country 2020 & 2033
- Table 49: Germany Coalescing Agents Market Revenue (Million) Forecast, by Application 2020 & 2033
- Table 50: Germany Coalescing Agents Market Volume (K Tons) Forecast, by Application 2020 & 2033
- Table 51: United Kingdom Coalescing Agents Market Revenue (Million) Forecast, by Application 2020 & 2033
- Table 52: United Kingdom Coalescing Agents Market Volume (K Tons) Forecast, by Application 2020 & 2033
- Table 53: Italy Coalescing Agents Market Revenue (Million) Forecast, by Application 2020 & 2033
- Table 54: Italy Coalescing Agents Market Volume (K Tons) Forecast, by Application 2020 & 2033
- Table 55: France Coalescing Agents Market Revenue (Million) Forecast, by Application 2020 & 2033
- Table 56: France Coalescing Agents Market Volume (K Tons) Forecast, by Application 2020 & 2033
- Table 57: Spain Coalescing Agents Market Revenue (Million) Forecast, by Application 2020 & 2033
- Table 58: Spain Coalescing Agents Market Volume (K Tons) Forecast, by Application 2020 & 2033
- Table 59: NORDIC Countries Coalescing Agents Market Revenue (Million) Forecast, by Application 2020 & 2033
- Table 60: NORDIC Countries Coalescing Agents Market Volume (K Tons) Forecast, by Application 2020 & 2033
- Table 61: Turkey Coalescing Agents Market Revenue (Million) Forecast, by Application 2020 & 2033
- Table 62: Turkey Coalescing Agents Market Volume (K Tons) Forecast, by Application 2020 & 2033
- Table 63: Russia Coalescing Agents Market Revenue (Million) Forecast, by Application 2020 & 2033
- Table 64: Russia Coalescing Agents Market Volume (K Tons) Forecast, by Application 2020 & 2033
- Table 65: Rest of Europe Coalescing Agents Market Revenue (Million) Forecast, by Application 2020 & 2033
- Table 66: Rest of Europe Coalescing Agents Market Volume (K Tons) Forecast, by Application 2020 & 2033
- Table 67: Global Coalescing Agents Market Revenue Million Forecast, by Type 2020 & 2033
- Table 68: Global Coalescing Agents Market Volume K Tons Forecast, by Type 2020 & 2033
- Table 69: Global Coalescing Agents Market Revenue Million Forecast, by Application 2020 & 2033
- Table 70: Global Coalescing Agents Market Volume K Tons Forecast, by Application 2020 & 2033
- Table 71: Global Coalescing Agents Market Revenue Million Forecast, by Country 2020 & 2033
- Table 72: Global Coalescing Agents Market Volume K Tons Forecast, by Country 2020 & 2033
- Table 73: Brazil Coalescing Agents Market Revenue (Million) Forecast, by Application 2020 & 2033
- Table 74: Brazil Coalescing Agents Market Volume (K Tons) Forecast, by Application 2020 & 2033
- Table 75: Argentina Coalescing Agents Market Revenue (Million) Forecast, by Application 2020 & 2033
- Table 76: Argentina Coalescing Agents Market Volume (K Tons) Forecast, by Application 2020 & 2033
- Table 77: Colombia Coalescing Agents Market Revenue (Million) Forecast, by Application 2020 & 2033
- Table 78: Colombia Coalescing Agents Market Volume (K Tons) Forecast, by Application 2020 & 2033
- Table 79: Rest of South America Coalescing Agents Market Revenue (Million) Forecast, by Application 2020 & 2033
- Table 80: Rest of South America Coalescing Agents Market Volume (K Tons) Forecast, by Application 2020 & 2033
- Table 81: Global Coalescing Agents Market Revenue Million Forecast, by Type 2020 & 2033
- Table 82: Global Coalescing Agents Market Volume K Tons Forecast, by Type 2020 & 2033
- Table 83: Global Coalescing Agents Market Revenue Million Forecast, by Application 2020 & 2033
- Table 84: Global Coalescing Agents Market Volume K Tons Forecast, by Application 2020 & 2033
- Table 85: Global Coalescing Agents Market Revenue Million Forecast, by Country 2020 & 2033
- Table 86: Global Coalescing Agents Market Volume K Tons Forecast, by Country 2020 & 2033
- Table 87: Saudi Arabia Coalescing Agents Market Revenue (Million) Forecast, by Application 2020 & 2033
- Table 88: Saudi Arabia Coalescing Agents Market Volume (K Tons) Forecast, by Application 2020 & 2033
- Table 89: South Africa Coalescing Agents Market Revenue (Million) Forecast, by Application 2020 & 2033
- Table 90: South Africa Coalescing Agents Market Volume (K Tons) Forecast, by Application 2020 & 2033
- Table 91: Nigeria Coalescing Agents Market Revenue (Million) Forecast, by Application 2020 & 2033
- Table 92: Nigeria Coalescing Agents Market Volume (K Tons) Forecast, by Application 2020 & 2033
- Table 93: Qatar Coalescing Agents Market Revenue (Million) Forecast, by Application 2020 & 2033
- Table 94: Qatar Coalescing Agents Market Volume (K Tons) Forecast, by Application 2020 & 2033
- Table 95: Egypt Coalescing Agents Market Revenue (Million) Forecast, by Application 2020 & 2033
- Table 96: Egypt Coalescing Agents Market Volume (K Tons) Forecast, by Application 2020 & 2033
- Table 97: United Arab Emirates Coalescing Agents Market Revenue (Million) Forecast, by Application 2020 & 2033
- Table 98: United Arab Emirates Coalescing Agents Market Volume (K Tons) Forecast, by Application 2020 & 2033
- Table 99: Rest of Middle East and Africa Coalescing Agents Market Revenue (Million) Forecast, by Application 2020 & 2033
- Table 100: Rest of Middle East and Africa Coalescing Agents Market Volume (K Tons) Forecast, by Application 2020 & 2033
Frequently Asked Questions
1. What is the projected Compound Annual Growth Rate (CAGR) of the Coalescing Agents Market?
The projected CAGR is approximately 4.96%.
2. Which companies are prominent players in the Coalescing Agents Market?
Key companies in the market include Cargill Incorporated, Synthomer PLC, Cristol, Celanese Corporation, Stepan Company, Runtai Chemical Co Ltd, BASF SE, Arkema Group, Rudolf GmbH, Dow, Eastman Chemical Company.
3. What are the main segments of the Coalescing Agents Market?
The market segments include Type, Application.
4. Can you provide details about the market size?
The market size is estimated to be USD 1.12 Million as of 2022.
5. What are some drivers contributing to market growth?
Increasing Usage in Personal Care Items; Rising Demand for Architectural and Industrial Coatings in Asia; Other Drivers.
6. What are the notable trends driving market growth?
Increasing Demand from Paints and Coatings Segment.
7. Are there any restraints impacting market growth?
Stringent Environmemtal Regulations; Other Restraints.
8. Can you provide examples of recent developments in the market?
N/A
9. What pricing options are available for accessing the report?
Pricing options include single-user, multi-user, and enterprise licenses priced at USD 4750, USD 5250, and USD 8750 respectively.
10. Is the market size provided in terms of value or volume?
The market size is provided in terms of value, measured in Million and volume, measured in K Tons.
11. Are there any specific market keywords associated with the report?
Yes, the market keyword associated with the report is "Coalescing Agents Market," which aids in identifying and referencing the specific market segment covered.
12. How do I determine which pricing option suits my needs best?
The pricing options vary based on user requirements and access needs. Individual users may opt for single-user licenses, while businesses requiring broader access may choose multi-user or enterprise licenses for cost-effective access to the report.
13. Are there any additional resources or data provided in the Coalescing Agents Market report?
While the report offers comprehensive insights, it's advisable to review the specific contents or supplementary materials provided to ascertain if additional resources or data are available.
14. How can I stay updated on further developments or reports in the Coalescing Agents Market?
To stay informed about further developments, trends, and reports in the Coalescing Agents Market, consider subscribing to industry newsletters, following relevant companies and organizations, or regularly checking reputable industry news sources and publications.
Methodology
Step 1 - Identification of Relevant Samples Size from Population Database


Step 2 - Approaches for Defining Global Market Size (Value, Volume* & Price*)

Note*: In applicable scenarios
Step 3 - Data Sources
Primary Research
- Web Analytics
- Survey Reports
- Research Institute
- Latest Research Reports
- Opinion Leaders
Secondary Research
- Annual Reports
- White Paper
- Latest Press Release
- Industry Association
- Paid Database
- Investor Presentations

Step 4 - Data Triangulation
Involves using different sources of information in order to increase the validity of a study
These sources are likely to be stakeholders in a program - participants, other researchers, program staff, other community members, and so on.
Then we put all data in single framework & apply various statistical tools to find out the dynamic on the market.
During the analysis stage, feedback from the stakeholder groups would be compared to determine areas of agreement as well as areas of divergence