

Key Insights
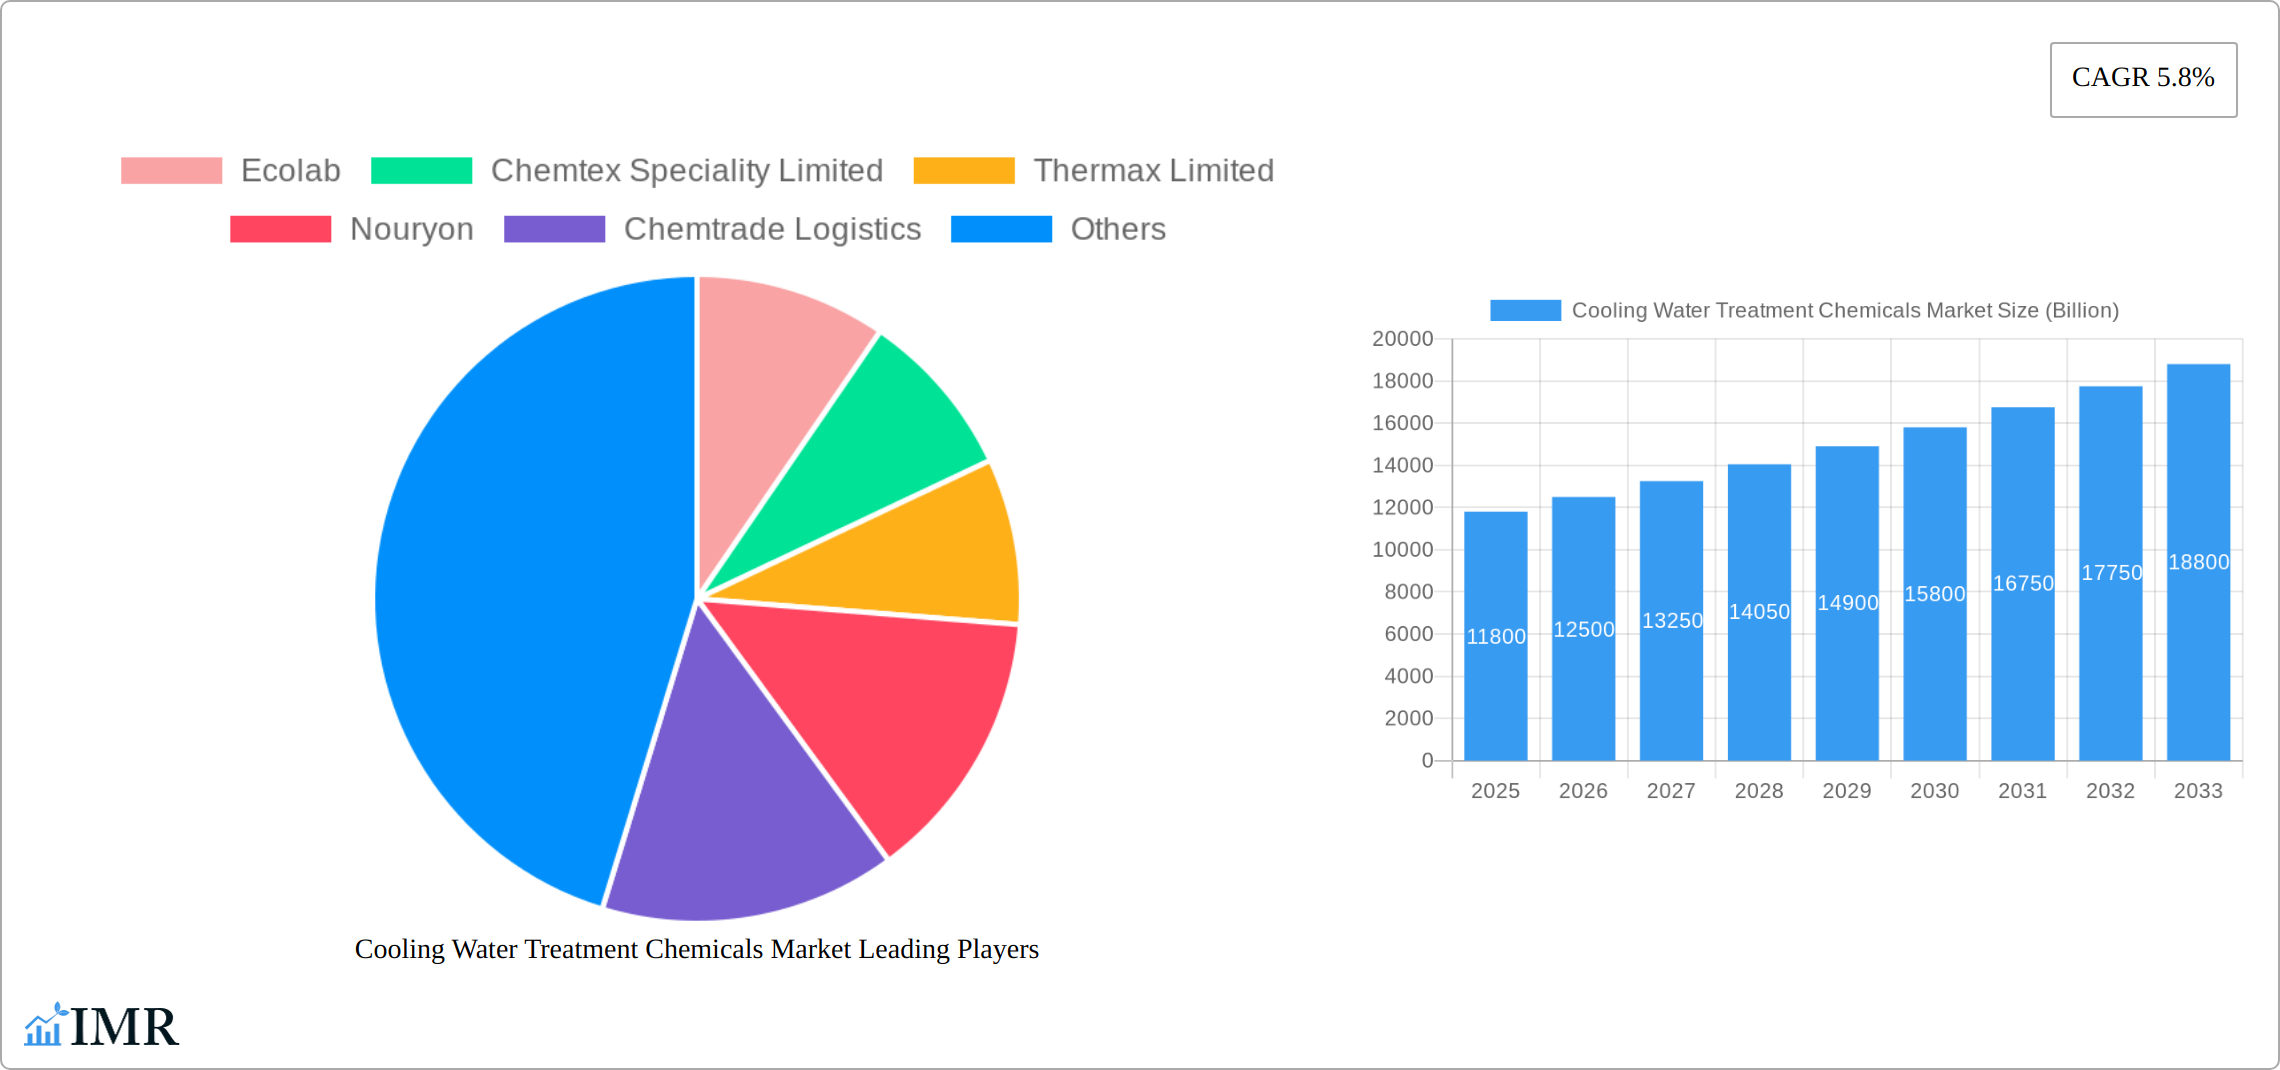
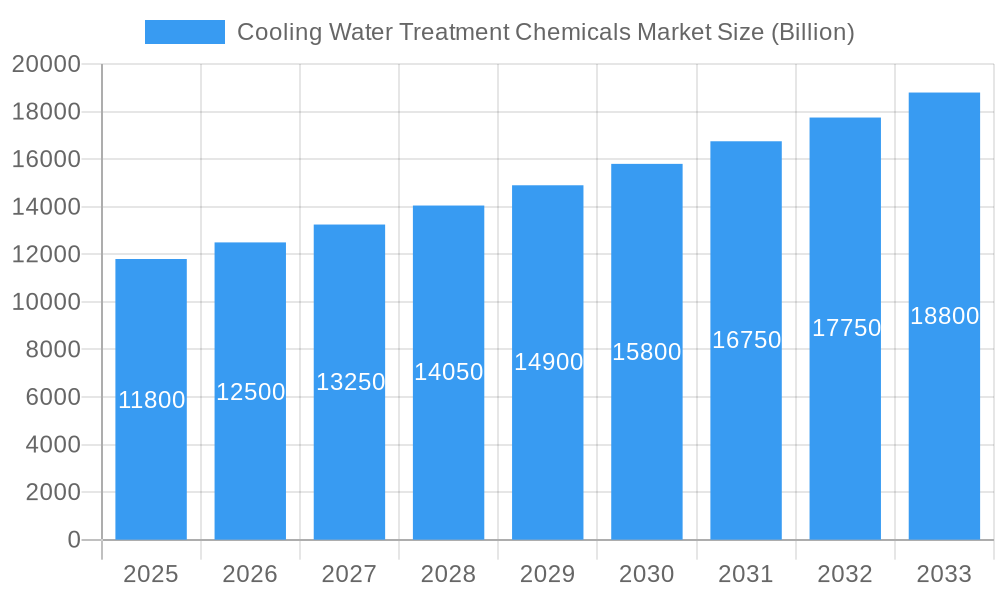
The global Cooling Water Treatment Chemicals market is experiencing robust growth, projected to reach \$11.8 billion in 2025 and maintain a Compound Annual Growth Rate (CAGR) of 5.8% from 2025 to 2033. This expansion is driven by several key factors. The increasing demand for efficient and reliable power generation across various industries, coupled with stringent environmental regulations promoting water conservation and reduced discharge of pollutants, significantly fuels market growth. Furthermore, the rising adoption of advanced cooling technologies in industries like petrochemicals, oil and gas, and steel necessitates the use of sophisticated water treatment chemicals to prevent corrosion, scaling, and microbial fouling. The rising awareness of the economic and operational benefits associated with effective cooling water management, such as minimized downtime and increased equipment lifespan, further contributes to market expansion. Growth is also observed across diverse geographical regions, with North America and Asia-Pacific emerging as leading markets due to robust industrial activities and investments in infrastructure development.
Cooling Water Treatment Chemicals Market Market Size (In Billion)
Segment-wise, corrosion inhibitors currently dominate the market, reflecting the critical need to protect expensive cooling systems from damage. However, the biocide segment is anticipated to witness strong growth due to escalating concerns regarding microbial contamination and its implications for cooling system efficiency and public health. Among end-user industries, the power industry represents a major consumer of these chemicals, followed by the petrochemicals and oil & gas sector. The market's competitive landscape features both established global players and regional specialists, each vying for market share through innovation, strategic partnerships, and geographic expansion. Future growth prospects are optimistic, particularly with ongoing advancements in chemical formulations that enhance efficiency, sustainability, and cost-effectiveness. Technological innovations such as nanotechnology-based inhibitors and eco-friendly biocides will play a crucial role in shaping the market's future trajectory.
Cooling Water Treatment Chemicals Market Company Market Share
Cooling Water Treatment Chemicals Market: A Comprehensive Report (2019-2033)
This comprehensive report provides a detailed analysis of the global Cooling Water Treatment Chemicals market, encompassing market size, growth trends, competitive landscape, and future outlook. The study period covers 2019-2033, with 2025 as the base year and a forecast period of 2025-2033. The report segments the market by type (Corrosion Inhibitor, Scale Inhibitor, Biocide, Other Types) and end-user industry (Power Industry, Steel, Mining & Metallurgy, Petrochemicals and Oil and Gas, Food and Beverage, Textile and Dyes, Other End-user Industries). The market is projected to reach xx Billion by 2033.
Cooling Water Treatment Chemicals Market Dynamics & Structure
The Cooling Water Treatment Chemicals market is characterized by moderate concentration, with key players such as Ecolab, Chemtex Speciality Limited, and Kemira holding significant market share. Technological innovation, particularly in the development of environmentally friendly and digitally enhanced solutions, is a major growth driver. Stringent environmental regulations concerning water discharge are shaping market dynamics, pushing manufacturers towards sustainable product development. The market also faces competition from alternative water treatment methods. Mergers and acquisitions (M&A) activity is relatively low but continues to consolidate the market.
- Market Concentration: Moderately concentrated, with top 5 players holding approximately xx% market share in 2025.
- Technological Innovation: Focus on developing eco-friendly biocides and digital solutions for performance monitoring.
- Regulatory Landscape: Stringent environmental regulations driving demand for sustainable solutions.
- Competitive Substitutes: Alternative water treatment technologies, including membrane filtration, pose a competitive threat.
- M&A Activity: Low to moderate, leading to gradual market consolidation. xx M&A deals were recorded in the historical period (2019-2024).
Cooling Water Treatment Chemicals Market Growth Trends & Insights
The Cooling Water Treatment Chemicals market is experiencing robust growth, fueled by the expansion of industrial activities, escalating energy demands, and increasingly stringent environmental regulations. The market, valued at [Insert Updated Market Value in Billions] in 2025, is projected to exhibit a Compound Annual Growth Rate (CAGR) of [Insert Updated CAGR]% during the forecast period (2025-2033). This significant growth trajectory is driven by several key factors: the widespread adoption of advanced water treatment technologies across diverse industries, a heightened awareness of water conservation practices, and the urgent need for efficient and sustainable cooling systems. Further propelling market expansion are advancements in biocide formulations, corrosion inhibitors, and the emergence of innovative, environmentally friendly solutions. The market penetration of advanced cooling water treatment chemicals is steadily rising, particularly within developing economies, indicating substantial future growth potential.
Dominant Regions, Countries, or Segments in Cooling Water Treatment Chemicals Market
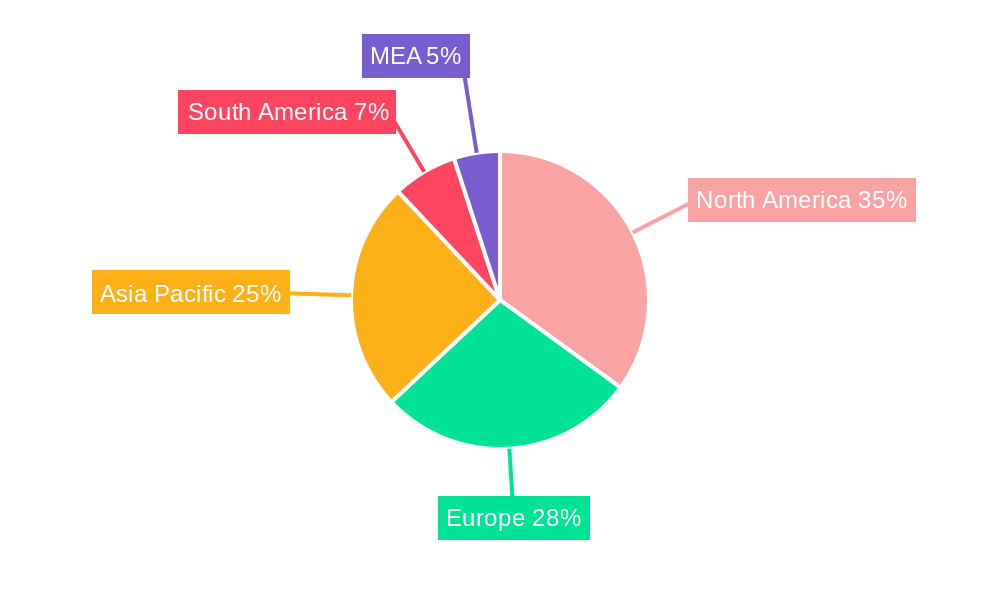
The Power generation industry commands the largest market share, followed closely by the Petrochemicals and Oil & Gas sectors. From a geographical perspective, the Asia-Pacific region is poised to dominate the market, driven by rapid industrialization and surging energy consumption. North America and Europe also represent substantial markets, underpinned by strict environmental regulations and sophisticated industrial infrastructure. The increasing demand for water treatment solutions in emerging economies like India and China is also a key contributor to the overall growth.
- Dominant Segment: Power Industry, fueled by the ever-growing demand for electricity and the expansion of large-scale power generation facilities.
- Leading Region: Asia-Pacific, experiencing substantial economic growth and extensive infrastructure development.
- Key Growth Drivers: Stringent environmental regulations promoting sustainable water management, accelerating industrialization, and the continuous rise in global energy demands.
- Market Share: Asia-Pacific holds an estimated [Insert Updated Market Share]% market share in 2025.
Cooling Water Treatment Chemicals Market Product Landscape
The market encompasses a diverse range of products tailored to specific industrial needs, including corrosion inhibitors, scale inhibitors, and biocides. A noteworthy trend is the development of eco-friendly formulations that deliver superior performance while minimizing environmental impact. Smart-tagged polymers represent a significant technological leap, enabling enhanced performance monitoring and optimization. This real-time monitoring capability leads to cost savings, improved system efficiency, and more sustainable water management practices. The market is also seeing increasing adoption of digital technologies for predictive maintenance and optimized chemical dosing.
Key Drivers, Barriers & Challenges in Cooling Water Treatment Chemicals Market
Key Drivers:
- Increasing industrialization and energy demand drive the need for efficient cooling systems.
- Stringent environmental regulations promote the adoption of eco-friendly solutions.
- Technological advancements lead to enhanced product performance and cost efficiency.
Challenges & Restraints:
- Fluctuating raw material prices impact production costs and profitability.
- Supply chain disruptions can lead to shortages and price volatility.
- Competition from substitute technologies like membrane filtration presents a significant challenge. This accounts for approximately xx% of the lost market share in the historical period.
Emerging Opportunities in Cooling Water Treatment Chemicals Market
Untapped markets in developing economies and the growing adoption of advanced water treatment technologies in diverse industries, including food and beverage processing, offer significant growth opportunities. Moreover, innovations in smart water treatment solutions and the development of customized products for niche applications present further potential. The demand for sustainable and environmentally friendly chemicals is continuously growing, creating opportunities for manufacturers of bio-based and biodegradable products.
Growth Accelerators in the Cooling Water Treatment Chemicals Market Industry
Technological breakthroughs, particularly in the area of digitalization and smart water treatment solutions, are key growth accelerators. Strategic partnerships and collaborations among chemical manufacturers, technology providers, and end-users are fostering innovation and market expansion. Aggressive expansion strategies into new and emerging markets, especially in developing economies, are driving market growth.
Notable Milestones in Cooling Water Treatment Chemicals Market Sector
- October 2022: Italmatch Chemicals launched its new Smart-Tagged Polymers brand line for industrial water treatment, significantly enhancing digital performance monitoring capabilities and predictive maintenance strategies.
- February 2022: SUEZ secured a contract for the construction of a seawater desalination plant, highlighting the growing integration of advanced water treatment technologies in large-scale projects and the increasing demand for sustainable water solutions.
- [Add other relevant milestones with dates and brief descriptions]
In-Depth Cooling Water Treatment Chemicals Market Market Outlook
The Cooling Water Treatment Chemicals market is poised for continued growth, driven by sustained industrial expansion, stringent environmental regulations, and ongoing technological advancements. Strategic investments in research and development, coupled with the adoption of innovative business models, will be crucial for companies to capitalize on emerging opportunities and maintain a competitive edge in this dynamic market. The market shows substantial potential for expansion into various industrial sectors and geographical regions.
Cooling Water Treatment Chemicals Market Segmentation
-
1. Type
- 1.1. Corrosion Inhibitor
- 1.2. Scale Inhibitor
- 1.3. Biocide
- 1.4. Other Types
-
2. End-user Industry
- 2.1. Power Industry
- 2.2. Steel, Mining & Metallurgy
- 2.3. Petrochemicals and Oil and Gas
- 2.4. Food and Beverage
- 2.5. Textile and Dyes
- 2.6. Other End-user Industries
Cooling Water Treatment Chemicals Market Segmentation By Geography
-
1. Asia Pacific
- 1.1. China
- 1.2. India
- 1.3. Japan
- 1.4. South Korea
- 1.5. Rest of Asia Pacific
-
2. North America
- 2.1. United States
- 2.2. Canada
- 2.3. Mexico
-
3. Europe
- 3.1. Germany
- 3.2. United Kingdom
- 3.3. France
- 3.4. Italy
- 3.5. Rest of Europe
-
4. South America
- 4.1. Brazil
- 4.2. Argentina
- 4.3. Rest of South America
- 5. Middle East
-
6. Saudi Arabia
- 6.1. South Africa
- 6.2. Rest of Middle East
Cooling Water Treatment Chemicals Market Regional Market Share
Geographic Coverage of Cooling Water Treatment Chemicals Market
Cooling Water Treatment Chemicals Market REPORT HIGHLIGHTS
| Aspects | Details |
|---|---|
| Study Period | 2020-2034 |
| Base Year | 2025 |
| Estimated Year | 2026 |
| Forecast Period | 2026-2034 |
| Historical Period | 2020-2025 |
| Growth Rate | CAGR of 5.8% from 2020-2034 |
| Segmentation |
|
Table of Contents
- 1. Introduction
- 1.1. Research Scope
- 1.2. Market Segmentation
- 1.3. Research Methodology
- 1.4. Definitions and Assumptions
- 2. Executive Summary
- 2.1. Introduction
- 3. Market Dynamics
- 3.1. Introduction
- 3.2. Market Drivers
- 3.2.1. Accelerating Growth of the Power Industry; Growing Popularity of Zero-liquid Blowdown
- 3.3. Market Restrains
- 3.3.1. Lack of Awareness about Cooling Water Treatment; Increasing Popularity of Chlorine Alternatives
- 3.4. Market Trends
- 3.4.1. Power Industry to Dominate the Market
- 4. Market Factor Analysis
- 4.1. Porters Five Forces
- 4.2. Supply/Value Chain
- 4.3. PESTEL analysis
- 4.4. Market Entropy
- 4.5. Patent/Trademark Analysis
- 5. Global Cooling Water Treatment Chemicals Market Analysis, Insights and Forecast, 2020-2032
- 5.1. Market Analysis, Insights and Forecast - by Type
- 5.1.1. Corrosion Inhibitor
- 5.1.2. Scale Inhibitor
- 5.1.3. Biocide
- 5.1.4. Other Types
- 5.2. Market Analysis, Insights and Forecast - by End-user Industry
- 5.2.1. Power Industry
- 5.2.2. Steel, Mining & Metallurgy
- 5.2.3. Petrochemicals and Oil and Gas
- 5.2.4. Food and Beverage
- 5.2.5. Textile and Dyes
- 5.2.6. Other End-user Industries
- 5.3. Market Analysis, Insights and Forecast - by Region
- 5.3.1. Asia Pacific
- 5.3.2. North America
- 5.3.3. Europe
- 5.3.4. South America
- 5.3.5. Middle East
- 5.3.6. Saudi Arabia
- 5.1. Market Analysis, Insights and Forecast - by Type
- 6. Asia Pacific Cooling Water Treatment Chemicals Market Analysis, Insights and Forecast, 2020-2032
- 6.1. Market Analysis, Insights and Forecast - by Type
- 6.1.1. Corrosion Inhibitor
- 6.1.2. Scale Inhibitor
- 6.1.3. Biocide
- 6.1.4. Other Types
- 6.2. Market Analysis, Insights and Forecast - by End-user Industry
- 6.2.1. Power Industry
- 6.2.2. Steel, Mining & Metallurgy
- 6.2.3. Petrochemicals and Oil and Gas
- 6.2.4. Food and Beverage
- 6.2.5. Textile and Dyes
- 6.2.6. Other End-user Industries
- 6.1. Market Analysis, Insights and Forecast - by Type
- 7. North America Cooling Water Treatment Chemicals Market Analysis, Insights and Forecast, 2020-2032
- 7.1. Market Analysis, Insights and Forecast - by Type
- 7.1.1. Corrosion Inhibitor
- 7.1.2. Scale Inhibitor
- 7.1.3. Biocide
- 7.1.4. Other Types
- 7.2. Market Analysis, Insights and Forecast - by End-user Industry
- 7.2.1. Power Industry
- 7.2.2. Steel, Mining & Metallurgy
- 7.2.3. Petrochemicals and Oil and Gas
- 7.2.4. Food and Beverage
- 7.2.5. Textile and Dyes
- 7.2.6. Other End-user Industries
- 7.1. Market Analysis, Insights and Forecast - by Type
- 8. Europe Cooling Water Treatment Chemicals Market Analysis, Insights and Forecast, 2020-2032
- 8.1. Market Analysis, Insights and Forecast - by Type
- 8.1.1. Corrosion Inhibitor
- 8.1.2. Scale Inhibitor
- 8.1.3. Biocide
- 8.1.4. Other Types
- 8.2. Market Analysis, Insights and Forecast - by End-user Industry
- 8.2.1. Power Industry
- 8.2.2. Steel, Mining & Metallurgy
- 8.2.3. Petrochemicals and Oil and Gas
- 8.2.4. Food and Beverage
- 8.2.5. Textile and Dyes
- 8.2.6. Other End-user Industries
- 8.1. Market Analysis, Insights and Forecast - by Type
- 9. South America Cooling Water Treatment Chemicals Market Analysis, Insights and Forecast, 2020-2032
- 9.1. Market Analysis, Insights and Forecast - by Type
- 9.1.1. Corrosion Inhibitor
- 9.1.2. Scale Inhibitor
- 9.1.3. Biocide
- 9.1.4. Other Types
- 9.2. Market Analysis, Insights and Forecast - by End-user Industry
- 9.2.1. Power Industry
- 9.2.2. Steel, Mining & Metallurgy
- 9.2.3. Petrochemicals and Oil and Gas
- 9.2.4. Food and Beverage
- 9.2.5. Textile and Dyes
- 9.2.6. Other End-user Industries
- 9.1. Market Analysis, Insights and Forecast - by Type
- 10. Middle East Cooling Water Treatment Chemicals Market Analysis, Insights and Forecast, 2020-2032
- 10.1. Market Analysis, Insights and Forecast - by Type
- 10.1.1. Corrosion Inhibitor
- 10.1.2. Scale Inhibitor
- 10.1.3. Biocide
- 10.1.4. Other Types
- 10.2. Market Analysis, Insights and Forecast - by End-user Industry
- 10.2.1. Power Industry
- 10.2.2. Steel, Mining & Metallurgy
- 10.2.3. Petrochemicals and Oil and Gas
- 10.2.4. Food and Beverage
- 10.2.5. Textile and Dyes
- 10.2.6. Other End-user Industries
- 10.1. Market Analysis, Insights and Forecast - by Type
- 11. Saudi Arabia Cooling Water Treatment Chemicals Market Analysis, Insights and Forecast, 2020-2032
- 11.1. Market Analysis, Insights and Forecast - by Type
- 11.1.1. Corrosion Inhibitor
- 11.1.2. Scale Inhibitor
- 11.1.3. Biocide
- 11.1.4. Other Types
- 11.2. Market Analysis, Insights and Forecast - by End-user Industry
- 11.2.1. Power Industry
- 11.2.2. Steel, Mining & Metallurgy
- 11.2.3. Petrochemicals and Oil and Gas
- 11.2.4. Food and Beverage
- 11.2.5. Textile and Dyes
- 11.2.6. Other End-user Industries
- 11.1. Market Analysis, Insights and Forecast - by Type
- 12. Competitive Analysis
- 12.1. Global Market Share Analysis 2025
- 12.2. Company Profiles
- 12.2.1 Ecolab
- 12.2.1.1. Overview
- 12.2.1.2. Products
- 12.2.1.3. SWOT Analysis
- 12.2.1.4. Recent Developments
- 12.2.1.5. Financials (Based on Availability)
- 12.2.2 Chemtex Speciality Limited
- 12.2.2.1. Overview
- 12.2.2.2. Products
- 12.2.2.3. SWOT Analysis
- 12.2.2.4. Recent Developments
- 12.2.2.5. Financials (Based on Availability)
- 12.2.3 Thermax Limited
- 12.2.3.1. Overview
- 12.2.3.2. Products
- 12.2.3.3. SWOT Analysis
- 12.2.3.4. Recent Developments
- 12.2.3.5. Financials (Based on Availability)
- 12.2.4 Nouryon
- 12.2.4.1. Overview
- 12.2.4.2. Products
- 12.2.4.3. SWOT Analysis
- 12.2.4.4. Recent Developments
- 12.2.4.5. Financials (Based on Availability)
- 12.2.5 Chemtrade Logistics
- 12.2.5.1. Overview
- 12.2.5.2. Products
- 12.2.5.3. SWOT Analysis
- 12.2.5.4. Recent Developments
- 12.2.5.5. Financials (Based on Availability)
- 12.2.6 Buckman
- 12.2.6.1. Overview
- 12.2.6.2. Products
- 12.2.6.3. SWOT Analysis
- 12.2.6.4. Recent Developments
- 12.2.6.5. Financials (Based on Availability)
- 12.2.7 Kemira
- 12.2.7.1. Overview
- 12.2.7.2. Products
- 12.2.7.3. SWOT Analysis
- 12.2.7.4. Recent Developments
- 12.2.7.5. Financials (Based on Availability)
- 12.2.8 DuPont
- 12.2.8.1. Overview
- 12.2.8.2. Products
- 12.2.8.3. SWOT Analysis
- 12.2.8.4. Recent Developments
- 12.2.8.5. Financials (Based on Availability)
- 12.2.9 Solenis
- 12.2.9.1. Overview
- 12.2.9.2. Products
- 12.2.9.3. SWOT Analysis
- 12.2.9.4. Recent Developments
- 12.2.9.5. Financials (Based on Availability)
- 12.2.10 Italmatch Chemicals
- 12.2.10.1. Overview
- 12.2.10.2. Products
- 12.2.10.3. SWOT Analysis
- 12.2.10.4. Recent Developments
- 12.2.10.5. Financials (Based on Availability)
- 12.2.11 Suez
- 12.2.11.1. Overview
- 12.2.11.2. Products
- 12.2.11.3. SWOT Analysis
- 12.2.11.4. Recent Developments
- 12.2.11.5. Financials (Based on Availability)
- 12.2.12 Veolia
- 12.2.12.1. Overview
- 12.2.12.2. Products
- 12.2.12.3. SWOT Analysis
- 12.2.12.4. Recent Developments
- 12.2.12.5. Financials (Based on Availability)
- 12.2.13 Albemarle Corporation
- 12.2.13.1. Overview
- 12.2.13.2. Products
- 12.2.13.3. SWOT Analysis
- 12.2.13.4. Recent Developments
- 12.2.13.5. Financials (Based on Availability)
- 12.2.14 DuBois Chemicals
- 12.2.14.1. Overview
- 12.2.14.2. Products
- 12.2.14.3. SWOT Analysis
- 12.2.14.4. Recent Developments
- 12.2.14.5. Financials (Based on Availability)
- 12.2.1 Ecolab
List of Figures
- Figure 1: Global Cooling Water Treatment Chemicals Market Revenue Breakdown (Billion, %) by Region 2025 & 2033
- Figure 2: Global Cooling Water Treatment Chemicals Market Volume Breakdown (K Tons, %) by Region 2025 & 2033
- Figure 3: Asia Pacific Cooling Water Treatment Chemicals Market Revenue (Billion), by Type 2025 & 2033
- Figure 4: Asia Pacific Cooling Water Treatment Chemicals Market Volume (K Tons), by Type 2025 & 2033
- Figure 5: Asia Pacific Cooling Water Treatment Chemicals Market Revenue Share (%), by Type 2025 & 2033
- Figure 6: Asia Pacific Cooling Water Treatment Chemicals Market Volume Share (%), by Type 2025 & 2033
- Figure 7: Asia Pacific Cooling Water Treatment Chemicals Market Revenue (Billion), by End-user Industry 2025 & 2033
- Figure 8: Asia Pacific Cooling Water Treatment Chemicals Market Volume (K Tons), by End-user Industry 2025 & 2033
- Figure 9: Asia Pacific Cooling Water Treatment Chemicals Market Revenue Share (%), by End-user Industry 2025 & 2033
- Figure 10: Asia Pacific Cooling Water Treatment Chemicals Market Volume Share (%), by End-user Industry 2025 & 2033
- Figure 11: Asia Pacific Cooling Water Treatment Chemicals Market Revenue (Billion), by Country 2025 & 2033
- Figure 12: Asia Pacific Cooling Water Treatment Chemicals Market Volume (K Tons), by Country 2025 & 2033
- Figure 13: Asia Pacific Cooling Water Treatment Chemicals Market Revenue Share (%), by Country 2025 & 2033
- Figure 14: Asia Pacific Cooling Water Treatment Chemicals Market Volume Share (%), by Country 2025 & 2033
- Figure 15: North America Cooling Water Treatment Chemicals Market Revenue (Billion), by Type 2025 & 2033
- Figure 16: North America Cooling Water Treatment Chemicals Market Volume (K Tons), by Type 2025 & 2033
- Figure 17: North America Cooling Water Treatment Chemicals Market Revenue Share (%), by Type 2025 & 2033
- Figure 18: North America Cooling Water Treatment Chemicals Market Volume Share (%), by Type 2025 & 2033
- Figure 19: North America Cooling Water Treatment Chemicals Market Revenue (Billion), by End-user Industry 2025 & 2033
- Figure 20: North America Cooling Water Treatment Chemicals Market Volume (K Tons), by End-user Industry 2025 & 2033
- Figure 21: North America Cooling Water Treatment Chemicals Market Revenue Share (%), by End-user Industry 2025 & 2033
- Figure 22: North America Cooling Water Treatment Chemicals Market Volume Share (%), by End-user Industry 2025 & 2033
- Figure 23: North America Cooling Water Treatment Chemicals Market Revenue (Billion), by Country 2025 & 2033
- Figure 24: North America Cooling Water Treatment Chemicals Market Volume (K Tons), by Country 2025 & 2033
- Figure 25: North America Cooling Water Treatment Chemicals Market Revenue Share (%), by Country 2025 & 2033
- Figure 26: North America Cooling Water Treatment Chemicals Market Volume Share (%), by Country 2025 & 2033
- Figure 27: Europe Cooling Water Treatment Chemicals Market Revenue (Billion), by Type 2025 & 2033
- Figure 28: Europe Cooling Water Treatment Chemicals Market Volume (K Tons), by Type 2025 & 2033
- Figure 29: Europe Cooling Water Treatment Chemicals Market Revenue Share (%), by Type 2025 & 2033
- Figure 30: Europe Cooling Water Treatment Chemicals Market Volume Share (%), by Type 2025 & 2033
- Figure 31: Europe Cooling Water Treatment Chemicals Market Revenue (Billion), by End-user Industry 2025 & 2033
- Figure 32: Europe Cooling Water Treatment Chemicals Market Volume (K Tons), by End-user Industry 2025 & 2033
- Figure 33: Europe Cooling Water Treatment Chemicals Market Revenue Share (%), by End-user Industry 2025 & 2033
- Figure 34: Europe Cooling Water Treatment Chemicals Market Volume Share (%), by End-user Industry 2025 & 2033
- Figure 35: Europe Cooling Water Treatment Chemicals Market Revenue (Billion), by Country 2025 & 2033
- Figure 36: Europe Cooling Water Treatment Chemicals Market Volume (K Tons), by Country 2025 & 2033
- Figure 37: Europe Cooling Water Treatment Chemicals Market Revenue Share (%), by Country 2025 & 2033
- Figure 38: Europe Cooling Water Treatment Chemicals Market Volume Share (%), by Country 2025 & 2033
- Figure 39: South America Cooling Water Treatment Chemicals Market Revenue (Billion), by Type 2025 & 2033
- Figure 40: South America Cooling Water Treatment Chemicals Market Volume (K Tons), by Type 2025 & 2033
- Figure 41: South America Cooling Water Treatment Chemicals Market Revenue Share (%), by Type 2025 & 2033
- Figure 42: South America Cooling Water Treatment Chemicals Market Volume Share (%), by Type 2025 & 2033
- Figure 43: South America Cooling Water Treatment Chemicals Market Revenue (Billion), by End-user Industry 2025 & 2033
- Figure 44: South America Cooling Water Treatment Chemicals Market Volume (K Tons), by End-user Industry 2025 & 2033
- Figure 45: South America Cooling Water Treatment Chemicals Market Revenue Share (%), by End-user Industry 2025 & 2033
- Figure 46: South America Cooling Water Treatment Chemicals Market Volume Share (%), by End-user Industry 2025 & 2033
- Figure 47: South America Cooling Water Treatment Chemicals Market Revenue (Billion), by Country 2025 & 2033
- Figure 48: South America Cooling Water Treatment Chemicals Market Volume (K Tons), by Country 2025 & 2033
- Figure 49: South America Cooling Water Treatment Chemicals Market Revenue Share (%), by Country 2025 & 2033
- Figure 50: South America Cooling Water Treatment Chemicals Market Volume Share (%), by Country 2025 & 2033
- Figure 51: Middle East Cooling Water Treatment Chemicals Market Revenue (Billion), by Type 2025 & 2033
- Figure 52: Middle East Cooling Water Treatment Chemicals Market Volume (K Tons), by Type 2025 & 2033
- Figure 53: Middle East Cooling Water Treatment Chemicals Market Revenue Share (%), by Type 2025 & 2033
- Figure 54: Middle East Cooling Water Treatment Chemicals Market Volume Share (%), by Type 2025 & 2033
- Figure 55: Middle East Cooling Water Treatment Chemicals Market Revenue (Billion), by End-user Industry 2025 & 2033
- Figure 56: Middle East Cooling Water Treatment Chemicals Market Volume (K Tons), by End-user Industry 2025 & 2033
- Figure 57: Middle East Cooling Water Treatment Chemicals Market Revenue Share (%), by End-user Industry 2025 & 2033
- Figure 58: Middle East Cooling Water Treatment Chemicals Market Volume Share (%), by End-user Industry 2025 & 2033
- Figure 59: Middle East Cooling Water Treatment Chemicals Market Revenue (Billion), by Country 2025 & 2033
- Figure 60: Middle East Cooling Water Treatment Chemicals Market Volume (K Tons), by Country 2025 & 2033
- Figure 61: Middle East Cooling Water Treatment Chemicals Market Revenue Share (%), by Country 2025 & 2033
- Figure 62: Middle East Cooling Water Treatment Chemicals Market Volume Share (%), by Country 2025 & 2033
- Figure 63: Saudi Arabia Cooling Water Treatment Chemicals Market Revenue (Billion), by Type 2025 & 2033
- Figure 64: Saudi Arabia Cooling Water Treatment Chemicals Market Volume (K Tons), by Type 2025 & 2033
- Figure 65: Saudi Arabia Cooling Water Treatment Chemicals Market Revenue Share (%), by Type 2025 & 2033
- Figure 66: Saudi Arabia Cooling Water Treatment Chemicals Market Volume Share (%), by Type 2025 & 2033
- Figure 67: Saudi Arabia Cooling Water Treatment Chemicals Market Revenue (Billion), by End-user Industry 2025 & 2033
- Figure 68: Saudi Arabia Cooling Water Treatment Chemicals Market Volume (K Tons), by End-user Industry 2025 & 2033
- Figure 69: Saudi Arabia Cooling Water Treatment Chemicals Market Revenue Share (%), by End-user Industry 2025 & 2033
- Figure 70: Saudi Arabia Cooling Water Treatment Chemicals Market Volume Share (%), by End-user Industry 2025 & 2033
- Figure 71: Saudi Arabia Cooling Water Treatment Chemicals Market Revenue (Billion), by Country 2025 & 2033
- Figure 72: Saudi Arabia Cooling Water Treatment Chemicals Market Volume (K Tons), by Country 2025 & 2033
- Figure 73: Saudi Arabia Cooling Water Treatment Chemicals Market Revenue Share (%), by Country 2025 & 2033
- Figure 74: Saudi Arabia Cooling Water Treatment Chemicals Market Volume Share (%), by Country 2025 & 2033
List of Tables
- Table 1: Global Cooling Water Treatment Chemicals Market Revenue Billion Forecast, by Type 2020 & 2033
- Table 2: Global Cooling Water Treatment Chemicals Market Volume K Tons Forecast, by Type 2020 & 2033
- Table 3: Global Cooling Water Treatment Chemicals Market Revenue Billion Forecast, by End-user Industry 2020 & 2033
- Table 4: Global Cooling Water Treatment Chemicals Market Volume K Tons Forecast, by End-user Industry 2020 & 2033
- Table 5: Global Cooling Water Treatment Chemicals Market Revenue Billion Forecast, by Region 2020 & 2033
- Table 6: Global Cooling Water Treatment Chemicals Market Volume K Tons Forecast, by Region 2020 & 2033
- Table 7: Global Cooling Water Treatment Chemicals Market Revenue Billion Forecast, by Type 2020 & 2033
- Table 8: Global Cooling Water Treatment Chemicals Market Volume K Tons Forecast, by Type 2020 & 2033
- Table 9: Global Cooling Water Treatment Chemicals Market Revenue Billion Forecast, by End-user Industry 2020 & 2033
- Table 10: Global Cooling Water Treatment Chemicals Market Volume K Tons Forecast, by End-user Industry 2020 & 2033
- Table 11: Global Cooling Water Treatment Chemicals Market Revenue Billion Forecast, by Country 2020 & 2033
- Table 12: Global Cooling Water Treatment Chemicals Market Volume K Tons Forecast, by Country 2020 & 2033
- Table 13: China Cooling Water Treatment Chemicals Market Revenue (Billion) Forecast, by Application 2020 & 2033
- Table 14: China Cooling Water Treatment Chemicals Market Volume (K Tons) Forecast, by Application 2020 & 2033
- Table 15: India Cooling Water Treatment Chemicals Market Revenue (Billion) Forecast, by Application 2020 & 2033
- Table 16: India Cooling Water Treatment Chemicals Market Volume (K Tons) Forecast, by Application 2020 & 2033
- Table 17: Japan Cooling Water Treatment Chemicals Market Revenue (Billion) Forecast, by Application 2020 & 2033
- Table 18: Japan Cooling Water Treatment Chemicals Market Volume (K Tons) Forecast, by Application 2020 & 2033
- Table 19: South Korea Cooling Water Treatment Chemicals Market Revenue (Billion) Forecast, by Application 2020 & 2033
- Table 20: South Korea Cooling Water Treatment Chemicals Market Volume (K Tons) Forecast, by Application 2020 & 2033
- Table 21: Rest of Asia Pacific Cooling Water Treatment Chemicals Market Revenue (Billion) Forecast, by Application 2020 & 2033
- Table 22: Rest of Asia Pacific Cooling Water Treatment Chemicals Market Volume (K Tons) Forecast, by Application 2020 & 2033
- Table 23: Global Cooling Water Treatment Chemicals Market Revenue Billion Forecast, by Type 2020 & 2033
- Table 24: Global Cooling Water Treatment Chemicals Market Volume K Tons Forecast, by Type 2020 & 2033
- Table 25: Global Cooling Water Treatment Chemicals Market Revenue Billion Forecast, by End-user Industry 2020 & 2033
- Table 26: Global Cooling Water Treatment Chemicals Market Volume K Tons Forecast, by End-user Industry 2020 & 2033
- Table 27: Global Cooling Water Treatment Chemicals Market Revenue Billion Forecast, by Country 2020 & 2033
- Table 28: Global Cooling Water Treatment Chemicals Market Volume K Tons Forecast, by Country 2020 & 2033
- Table 29: United States Cooling Water Treatment Chemicals Market Revenue (Billion) Forecast, by Application 2020 & 2033
- Table 30: United States Cooling Water Treatment Chemicals Market Volume (K Tons) Forecast, by Application 2020 & 2033
- Table 31: Canada Cooling Water Treatment Chemicals Market Revenue (Billion) Forecast, by Application 2020 & 2033
- Table 32: Canada Cooling Water Treatment Chemicals Market Volume (K Tons) Forecast, by Application 2020 & 2033
- Table 33: Mexico Cooling Water Treatment Chemicals Market Revenue (Billion) Forecast, by Application 2020 & 2033
- Table 34: Mexico Cooling Water Treatment Chemicals Market Volume (K Tons) Forecast, by Application 2020 & 2033
- Table 35: Global Cooling Water Treatment Chemicals Market Revenue Billion Forecast, by Type 2020 & 2033
- Table 36: Global Cooling Water Treatment Chemicals Market Volume K Tons Forecast, by Type 2020 & 2033
- Table 37: Global Cooling Water Treatment Chemicals Market Revenue Billion Forecast, by End-user Industry 2020 & 2033
- Table 38: Global Cooling Water Treatment Chemicals Market Volume K Tons Forecast, by End-user Industry 2020 & 2033
- Table 39: Global Cooling Water Treatment Chemicals Market Revenue Billion Forecast, by Country 2020 & 2033
- Table 40: Global Cooling Water Treatment Chemicals Market Volume K Tons Forecast, by Country 2020 & 2033
- Table 41: Germany Cooling Water Treatment Chemicals Market Revenue (Billion) Forecast, by Application 2020 & 2033
- Table 42: Germany Cooling Water Treatment Chemicals Market Volume (K Tons) Forecast, by Application 2020 & 2033
- Table 43: United Kingdom Cooling Water Treatment Chemicals Market Revenue (Billion) Forecast, by Application 2020 & 2033
- Table 44: United Kingdom Cooling Water Treatment Chemicals Market Volume (K Tons) Forecast, by Application 2020 & 2033
- Table 45: France Cooling Water Treatment Chemicals Market Revenue (Billion) Forecast, by Application 2020 & 2033
- Table 46: France Cooling Water Treatment Chemicals Market Volume (K Tons) Forecast, by Application 2020 & 2033
- Table 47: Italy Cooling Water Treatment Chemicals Market Revenue (Billion) Forecast, by Application 2020 & 2033
- Table 48: Italy Cooling Water Treatment Chemicals Market Volume (K Tons) Forecast, by Application 2020 & 2033
- Table 49: Rest of Europe Cooling Water Treatment Chemicals Market Revenue (Billion) Forecast, by Application 2020 & 2033
- Table 50: Rest of Europe Cooling Water Treatment Chemicals Market Volume (K Tons) Forecast, by Application 2020 & 2033
- Table 51: Global Cooling Water Treatment Chemicals Market Revenue Billion Forecast, by Type 2020 & 2033
- Table 52: Global Cooling Water Treatment Chemicals Market Volume K Tons Forecast, by Type 2020 & 2033
- Table 53: Global Cooling Water Treatment Chemicals Market Revenue Billion Forecast, by End-user Industry 2020 & 2033
- Table 54: Global Cooling Water Treatment Chemicals Market Volume K Tons Forecast, by End-user Industry 2020 & 2033
- Table 55: Global Cooling Water Treatment Chemicals Market Revenue Billion Forecast, by Country 2020 & 2033
- Table 56: Global Cooling Water Treatment Chemicals Market Volume K Tons Forecast, by Country 2020 & 2033
- Table 57: Brazil Cooling Water Treatment Chemicals Market Revenue (Billion) Forecast, by Application 2020 & 2033
- Table 58: Brazil Cooling Water Treatment Chemicals Market Volume (K Tons) Forecast, by Application 2020 & 2033
- Table 59: Argentina Cooling Water Treatment Chemicals Market Revenue (Billion) Forecast, by Application 2020 & 2033
- Table 60: Argentina Cooling Water Treatment Chemicals Market Volume (K Tons) Forecast, by Application 2020 & 2033
- Table 61: Rest of South America Cooling Water Treatment Chemicals Market Revenue (Billion) Forecast, by Application 2020 & 2033
- Table 62: Rest of South America Cooling Water Treatment Chemicals Market Volume (K Tons) Forecast, by Application 2020 & 2033
- Table 63: Global Cooling Water Treatment Chemicals Market Revenue Billion Forecast, by Type 2020 & 2033
- Table 64: Global Cooling Water Treatment Chemicals Market Volume K Tons Forecast, by Type 2020 & 2033
- Table 65: Global Cooling Water Treatment Chemicals Market Revenue Billion Forecast, by End-user Industry 2020 & 2033
- Table 66: Global Cooling Water Treatment Chemicals Market Volume K Tons Forecast, by End-user Industry 2020 & 2033
- Table 67: Global Cooling Water Treatment Chemicals Market Revenue Billion Forecast, by Country 2020 & 2033
- Table 68: Global Cooling Water Treatment Chemicals Market Volume K Tons Forecast, by Country 2020 & 2033
- Table 69: Global Cooling Water Treatment Chemicals Market Revenue Billion Forecast, by Type 2020 & 2033
- Table 70: Global Cooling Water Treatment Chemicals Market Volume K Tons Forecast, by Type 2020 & 2033
- Table 71: Global Cooling Water Treatment Chemicals Market Revenue Billion Forecast, by End-user Industry 2020 & 2033
- Table 72: Global Cooling Water Treatment Chemicals Market Volume K Tons Forecast, by End-user Industry 2020 & 2033
- Table 73: Global Cooling Water Treatment Chemicals Market Revenue Billion Forecast, by Country 2020 & 2033
- Table 74: Global Cooling Water Treatment Chemicals Market Volume K Tons Forecast, by Country 2020 & 2033
- Table 75: South Africa Cooling Water Treatment Chemicals Market Revenue (Billion) Forecast, by Application 2020 & 2033
- Table 76: South Africa Cooling Water Treatment Chemicals Market Volume (K Tons) Forecast, by Application 2020 & 2033
- Table 77: Rest of Middle East Cooling Water Treatment Chemicals Market Revenue (Billion) Forecast, by Application 2020 & 2033
- Table 78: Rest of Middle East Cooling Water Treatment Chemicals Market Volume (K Tons) Forecast, by Application 2020 & 2033
Frequently Asked Questions
1. What is the projected Compound Annual Growth Rate (CAGR) of the Cooling Water Treatment Chemicals Market?
The projected CAGR is approximately 5.8%.
2. Which companies are prominent players in the Cooling Water Treatment Chemicals Market?
Key companies in the market include Ecolab, Chemtex Speciality Limited, Thermax Limited, Nouryon, Chemtrade Logistics, Buckman, Kemira, DuPont, Solenis, Italmatch Chemicals, Suez, Veolia, Albemarle Corporation, DuBois Chemicals.
3. What are the main segments of the Cooling Water Treatment Chemicals Market?
The market segments include Type, End-user Industry.
4. Can you provide details about the market size?
The market size is estimated to be USD 11.8 Billion as of 2022.
5. What are some drivers contributing to market growth?
Accelerating Growth of the Power Industry; Growing Popularity of Zero-liquid Blowdown.
6. What are the notable trends driving market growth?
Power Industry to Dominate the Market.
7. Are there any restraints impacting market growth?
Lack of Awareness about Cooling Water Treatment; Increasing Popularity of Chlorine Alternatives.
8. Can you provide examples of recent developments in the market?
October 2022: Italmatch Chemicals company introduced a new Smart-Tagged Polymers brand line specialized for Industrial Water Treatment solutions. It is a cutting-edge smart solution for Cooling Tower applications and a significant step forward in digitalizing chemical treatment performance control.
9. What pricing options are available for accessing the report?
Pricing options include single-user, multi-user, and enterprise licenses priced at USD 3,950, USD 4,950, and USD 6,950 respectively.
10. Is the market size provided in terms of value or volume?
The market size is provided in terms of value, measured in Billion and volume, measured in K Tons.
11. Are there any specific market keywords associated with the report?
Yes, the market keyword associated with the report is "Cooling Water Treatment Chemicals Market," which aids in identifying and referencing the specific market segment covered.
12. How do I determine which pricing option suits my needs best?
The pricing options vary based on user requirements and access needs. Individual users may opt for single-user licenses, while businesses requiring broader access may choose multi-user or enterprise licenses for cost-effective access to the report.
13. Are there any additional resources or data provided in the Cooling Water Treatment Chemicals Market report?
While the report offers comprehensive insights, it's advisable to review the specific contents or supplementary materials provided to ascertain if additional resources or data are available.
14. How can I stay updated on further developments or reports in the Cooling Water Treatment Chemicals Market?
To stay informed about further developments, trends, and reports in the Cooling Water Treatment Chemicals Market, consider subscribing to industry newsletters, following relevant companies and organizations, or regularly checking reputable industry news sources and publications.
Methodology
Step 1 - Identification of Relevant Samples Size from Population Database


Step 2 - Approaches for Defining Global Market Size (Value, Volume* & Price*)

Note*: In applicable scenarios
Step 3 - Data Sources
Primary Research
- Web Analytics
- Survey Reports
- Research Institute
- Latest Research Reports
- Opinion Leaders
Secondary Research
- Annual Reports
- White Paper
- Latest Press Release
- Industry Association
- Paid Database
- Investor Presentations

Step 4 - Data Triangulation
Involves using different sources of information in order to increase the validity of a study
These sources are likely to be stakeholders in a program - participants, other researchers, program staff, other community members, and so on.
Then we put all data in single framework & apply various statistical tools to find out the dynamic on the market.
During the analysis stage, feedback from the stakeholder groups would be compared to determine areas of agreement as well as areas of divergence