

Key Insights
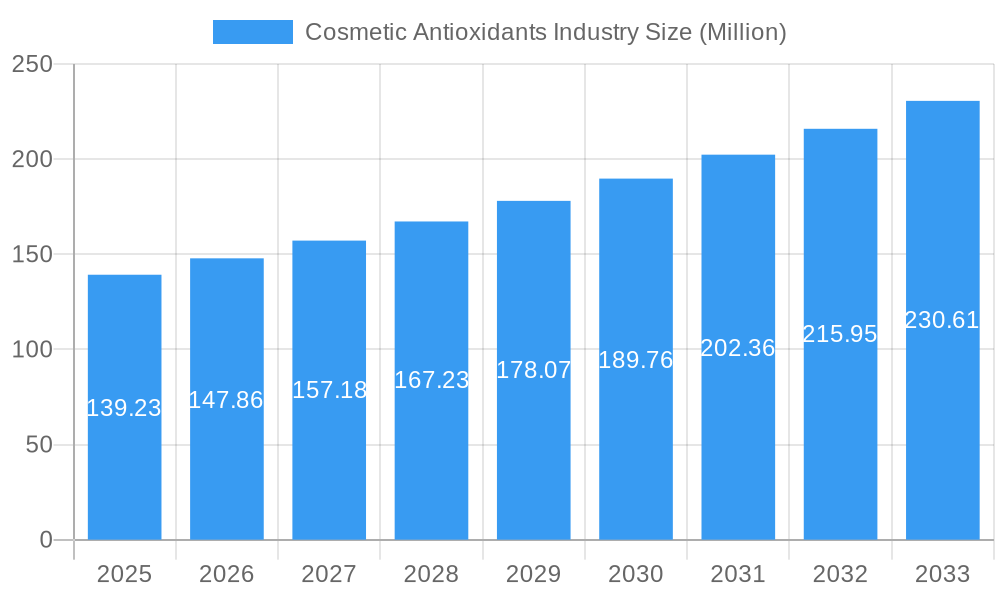
The global cosmetic antioxidants market, valued at $139.23 million in 2025, is projected to experience robust growth, driven by increasing consumer awareness of skincare benefits and the rising demand for natural and organic cosmetic products. A Compound Annual Growth Rate (CAGR) of 5.95% from 2025 to 2033 indicates a significant market expansion, reaching an estimated $230 million by 2033. Key drivers include the growing prevalence of skin aging and related concerns, the increasing adoption of anti-aging products, and a surge in popularity of products emphasizing natural ingredients. The market is segmented by source (natural and chemically derived), type (vitamins, polyphenols, enzymes, carotenoids, and others like flavonoids and terpenes), and application (skincare, haircare, injectables, and others like makeup and body care). The natural segment is experiencing faster growth due to consumer preference for clean beauty products. Among applications, skincare dominates the market, reflecting the widespread use of antioxidants in creams, serums, and lotions. Major players like DSM, Lonza, Kemin Industries, and Evonik are actively involved in research and development, fueling innovation in antioxidant formulations and delivery systems. Regional analysis shows a strong presence across North America, Europe, and Asia Pacific, with the Asia Pacific region anticipated to exhibit substantial growth, primarily due to increasing disposable incomes and rising cosmetic consumption in countries like China and India.
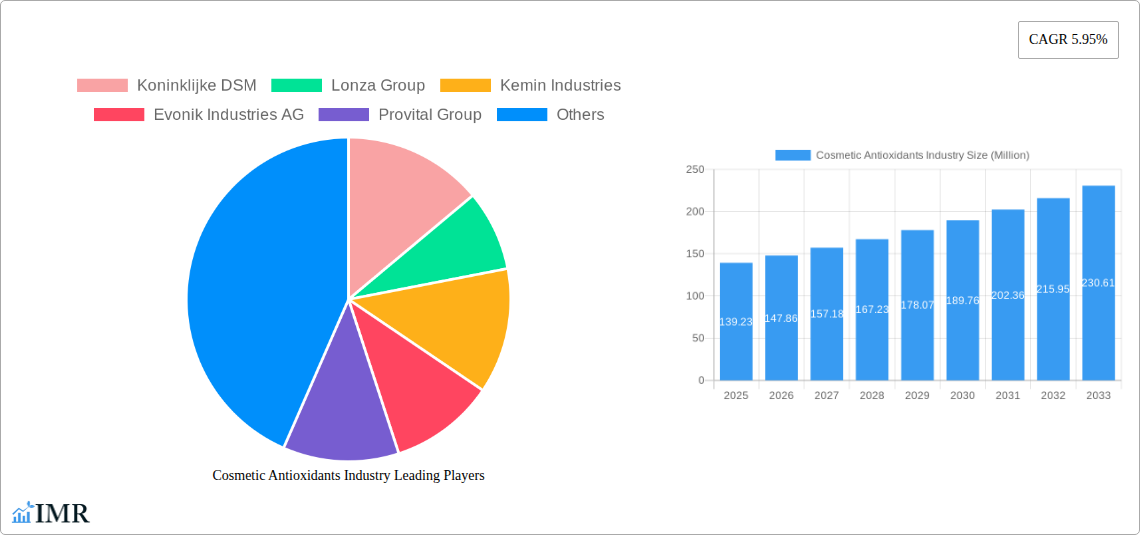
Cosmetic Antioxidants Industry Market Size (In Million)
The competitive landscape is characterized by the presence of both large multinational corporations and smaller specialized companies. The market's growth is likely to be influenced by several factors, including fluctuating raw material prices, stringent regulatory approvals for cosmetic ingredients, and the increasing focus on sustainable and ethically sourced ingredients. Future market growth will likely hinge on advancements in antioxidant technology, the development of novel delivery systems for enhanced efficacy, and a continued emphasis on addressing consumer concerns regarding ingredient safety and environmental impact. The market’s dynamic nature presents opportunities for both established players and emerging companies to innovate and capitalize on the rising consumer demand for effective and safe cosmetic antioxidants.
Cosmetic Antioxidants Industry Company Market Share
This comprehensive report provides an in-depth analysis of the global cosmetic antioxidants market, encompassing its dynamics, growth trends, regional segmentation, product landscape, and key players. With a study period spanning 2019-2033, a base year of 2025, and a forecast period of 2025-2033, this report is an essential resource for industry professionals, investors, and strategists seeking to understand and capitalize on the opportunities within this thriving market. The market is valued at xx Million units in 2025 and is expected to reach xx Million units by 2033.
Cosmetic Antioxidants Industry Market Dynamics & Structure
The cosmetic antioxidants market is characterized by a dynamic interplay of factors, indicating a moderately concentrated landscape. Leading entities such as Koninklijke DSM, BASF SE, and Lonza Group are prominent players, significantly influencing market trends. A pivotal driver is the relentless pursuit of technological innovation, particularly in the development of novel antioxidant compounds that offer superior efficacy, enhanced stability, and improved bioavailability. The global regulatory framework, with its stringent mandates on the safety and efficacy of cosmetic ingredients, acts as both a guide and a challenge, shaping product development pipelines and market entry strategies. While synthetic preservatives and alternative anti-aging solutions present competitive pressures, the escalating demand for premium anti-aging, sun protection, and overall skin health products, fueled by an increasingly health-conscious global consumer base, propels market expansion. Mergers and acquisitions (M&A) are anticipated to remain a moderate but strategic tool for market consolidation and expansion, with a growing emphasis on synergistic partnerships to leverage specialized expertise and market reach.
- Market Concentration: Moderately concentrated, with top 5 players estimated to hold approximately 45-55% of the market share in 2025. This reflects a competitive yet consolidated environment.
- Technological Innovation: A significant focus is placed on the research and development of natural and sustainably sourced antioxidants, alongside advancements in novel compounds with demonstrably improved efficacy, stability, and targeted delivery mechanisms.
- Regulatory Landscape: Stringent global regulations concerning ingredient safety, efficacy testing, and labeling requirements significantly influence product development cycles, R&D investment, and market access.
- Competitive Substitutes: The market faces competition not only from synthetic preservatives but also from a growing array of innovative anti-aging ingredients and alternative skincare technologies, necessitating continuous product differentiation.
- End-User Demographics: The expanding global population, coupled with a pronounced shift towards health-conscious living and a proactive approach to aging, drives the demand for effective and safe cosmetic antioxidant solutions.
- M&A Activity: Moderate levels of mergers and acquisitions are projected, with strategic partnerships and collaborations playing a crucial role in enhancing market presence, accessing new technologies, and expanding product portfolios.
Cosmetic Antioxidants Industry Growth Trends & Insights
The global cosmetic antioxidants market is experiencing robust and sustained growth, propelled by a confluence of factors. Foremost among these is the heightened consumer awareness regarding the intrinsic link between skin health, environmental protection, and the benefits of potent antioxidants. This has cultivated a strong demand for both natural and scientifically advanced beauty solutions. The market size has witnessed a significant upward trajectory, expanding from approximately [Insert specific figure for 2019] Million units in 2019 to an estimated [Insert specific figure for 2025] Million units by 2025. Technological advancements are acting as powerful catalysts, with innovations such as nanotechnology-driven enhanced delivery systems and the meticulous development of synergistic antioxidant blends offering superior performance and efficacy. Furthermore, evolving consumer preferences are leaning heavily towards natural, organic, and clean beauty products, thereby significantly boosting the growth of the natural antioxidants segment. Projections indicate that the market will continue to expand at a Compound Annual Growth Rate (CAGR) of approximately [Insert specific CAGR %]% during the forecast period of 2025-2033. Significant growth impetus is anticipated in the Asia-Pacific and North America regions, driven by increasing disposable incomes and a growing middle class. Market penetration is expected to rise, particularly in emerging economies where consumer demand for premium skincare and anti-aging solutions is on an upswing.
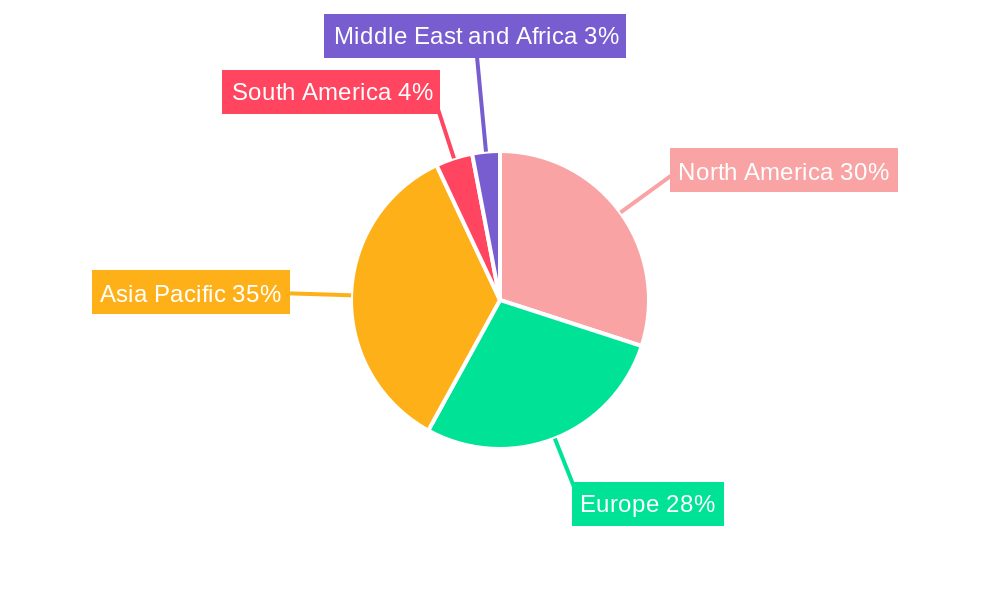
Dominant Regions, Countries, or Segments in Cosmetic Antioxidants Industry
North America currently holds the largest market share in the cosmetic antioxidants industry, driven by high consumer spending on premium skincare and the presence of major players. The skin care application segment dominates the market, followed by hair care. Within the source segment, the natural antioxidants segment is experiencing the fastest growth due to rising consumer preference for natural ingredients. Europe also displays substantial growth driven by strong regulatory frameworks and an established cosmetic industry. Asia-Pacific is anticipated to witness the highest growth rate during the forecast period fueled by a burgeoning middle class and increasing awareness of skincare benefits.
- Key Drivers (North America): High consumer spending on premium skincare, established cosmetic industry, strong regulatory frameworks.
- Key Drivers (Asia-Pacific): Rising disposable incomes, increasing awareness of skincare benefits, expanding middle class.
- Dominant Segment (Application): Skin care, owing to extensive use of antioxidants in anti-aging and sun protection products.
- Dominant Segment (Source): Natural antioxidants, driven by increasing consumer preference for natural and organic ingredients.
Cosmetic Antioxidants Industry Product Landscape
The product landscape within the cosmetic antioxidants market is remarkably diverse and continuously evolving, encompassing a wide array of potent ingredients. Key categories include essential vitamins like Vitamin C (Ascorbic Acid) and Vitamin E (Tocopherol), a rich spectrum of polyphenols derived from botanicals, vital carotenoids such as beta-carotene and lycopene, and crucial enzymes like Superoxide Dismutase (SOD). The industry's innovation engine is relentlessly focused on optimizing the stability, bioavailability, and efficacy of these compounds. Cutting-edge technologies, including advanced encapsulation techniques, sophisticated liposomal delivery systems, and the strategic formulation of synergistic antioxidant blends, are at the forefront of product development. Unique selling propositions frequently highlight ingredients derived from natural, sustainable sources, enhanced skin penetration capabilities, and compelling clinically proven efficacy backed by scientific research. These technological advancements are instrumental in elevating performance metrics, including prolonged shelf-life, superior antioxidant activity, and improved absorption by the skin.
Key Drivers, Barriers & Challenges in Cosmetic Antioxidants Industry
Key Drivers: The escalating global demand for advanced anti-aging and comprehensive skin protection products; heightened consumer awareness concerning the detrimental effects of free radicals and oxidative stress; a pronounced and growing consumer preference for natural, organic, and "clean" beauty formulations; significant technological advancements in ingredient delivery systems, encapsulation, and synergistic formulation technologies; and the increasing penetration of premium skincare products in emerging markets.
Challenges & Restraints: Volatility in the pricing and availability of key raw materials; navigating and adhering to increasingly stringent and diverse global regulatory requirements; intense competition from established synthetic antioxidants and emerging novel ingredients; the inherent technical challenge of ensuring long-term product stability, efficacy, and consistent performance; and the potential for supply chain disruptions due to geopolitical factors, climate change, or unforeseen global events.
Emerging Opportunities in Cosmetic Antioxidants Industry
The market presents significant opportunities in personalized skincare, leveraging the increasing use of genomics and tailored antioxidant formulations. The growing demand for sustainable and ethically sourced ingredients provides an opportunity for brands to highlight environmentally friendly practices. Expanding into untapped markets, particularly in emerging economies, presents significant growth potential. Innovative applications in sunscreens, anti-pollution cosmetics, and color cosmetics also offer exciting prospects.
Growth Accelerators in the Cosmetic Antioxidants Industry
Strategic partnerships and collaborations between cosmetic brands and ingredient suppliers accelerate innovation and market penetration. Technological breakthroughs in ingredient delivery systems enhance efficacy and consumer experience. The expansion into new geographical markets, particularly in developing economies, contributes substantially to market growth.
Key Players Shaping the Cosmetic Antioxidants Industry Market
- Koninklijke DSM - A global science-based company active in nutrition, health, and sustainable living.
- Lonza Group - A Swiss multinational manufacturing company, offering a wide range of products and services to the pharmaceutical, biotech, and nutrition markets.
- Kemin Industries - A global ingredient manufacturer focused on improving the quality of life by touching half the people of the world every day with its products and services.
- Evonik Industries AG - A German specialty chemicals company that operates worldwide.
- Provital Group - A company dedicated to the development and manufacture of cosmetic ingredients.
- Croda International Plc - A global specialty chemical company that manufactures and supplies chemicals for a wide range of industries.
- BASF SE - A German multinational chemical company and the largest chemical producer in the world.
- Eastman Chemical Company - An American specialty materials company.
- BTSA Biotecnologias Aplicadas - Specializes in the production of natural antioxidants for food, animal feed, and cosmetic applications.
- Wacker Chemie AG - A German multinational chemical company.
- List Not Exhaustive
Notable Milestones in Cosmetic Antioxidants Industry Sector
- October 2023: BASF's Care Chemicals division invests in a new plant to produce emollient specialties for skin and sun protection products. This expansion signifies increased production capacity and commitment to the market.
- June 2023: DKSH signs an exclusive distribution agreement with Bitop for cosmetic ingredients in Australia, New Zealand, Malaysia, and Singapore. This strategic partnership expands Bitop's market reach significantly.
In-Depth Cosmetic Antioxidants Industry Market Outlook
The cosmetic antioxidants market is poised for continued robust growth, driven by innovation, expanding consumer bases, and increasing health consciousness. Strategic partnerships, technological advancements in delivery systems, and expansion into new markets will further fuel this growth. The long-term outlook remains positive, with significant opportunities for both established players and new entrants to capture market share.
Cosmetic Antioxidants Industry Segmentation
-
1. Source
- 1.1. Natural
- 1.2. Chemically Derived
-
2. Type
- 2.1. Vitamins
- 2.2. Polyphenols
- 2.3. Enzymes
- 2.4. Carotenoids
- 2.5. Other Ty
-
3. Application
- 3.1. Skin Care
- 3.2. Hair Care
- 3.3. Injectables
- 3.4. Other Applications (Makeup and Body care)
Cosmetic Antioxidants Industry Segmentation By Geography
-
1. Asia Pacific
- 1.1. China
- 1.2. India
- 1.3. Japan
- 1.4. South Korea
- 1.5. Rest of Asia Pacific
-
2. North America
- 2.1. United States
- 2.2. Canada
- 2.3. Mexico
-
3. Europe
- 3.1. Germany
- 3.2. United Kingdom
- 3.3. Italy
- 3.4. France
- 3.5. Rest of Europe
-
4. South America
- 4.1. Brazil
- 4.2. Argentina
- 4.3. Rest of South America
-
5. Middle East and Africa
- 5.1. Saudi Arabia
- 5.2. South Africa
- 5.3. Rest of Middle East and Africa
Cosmetic Antioxidants Industry Regional Market Share
Geographic Coverage of Cosmetic Antioxidants Industry
Cosmetic Antioxidants Industry REPORT HIGHLIGHTS
| Aspects | Details |
|---|---|
| Study Period | 2020-2034 |
| Base Year | 2025 |
| Estimated Year | 2026 |
| Forecast Period | 2026-2034 |
| Historical Period | 2020-2025 |
| Growth Rate | CAGR of 5.95% from 2020-2034 |
| Segmentation |
|
Table of Contents
- 1. Introduction
- 1.1. Research Scope
- 1.2. Market Segmentation
- 1.3. Research Objective
- 1.4. Definitions and Assumptions
- 2. Executive Summary
- 2.1. Market Snapshot
- 3. Market Dynamics
- 3.1. Market Drivers
- 3.2. Market Restrains
- 3.3. Market Trends
- 3.4. Market Opportunities
- 4. Market Factor Analysis
- 4.1. Porters Five Forces
- 4.1.1. Bargaining Power of Suppliers
- 4.1.2. Bargaining Power of Buyers
- 4.1.3. Threat of New Entrants
- 4.1.4. Threat of Substitutes
- 4.1.5. Competitive Rivalry
- 4.2. PESTEL analysis
- 4.3. BCG Analysis
- 4.3.1. Stars (High Growth, High Market Share)
- 4.3.2. Cash Cows (Low Growth, High Market Share)
- 4.3.3. Question Mark (High Growth, Low Market Share)
- 4.3.4. Dogs (Low Growth, Low Market Share)
- 4.4. Ansoff Matrix Analysis
- 4.5. Supply Chain Analysis
- 4.6. Regulatory Landscape
- 4.7. Current Market Potential and Opportunity Assessment (TAM–SAM–SOM Framework)
- 4.8. IMR Analyst Note
- 4.1. Porters Five Forces
- 5. Market Analysis, Insights and Forecast 2021-2033
- 5.1. Market Analysis, Insights and Forecast - by Source
- 5.1.1. Natural
- 5.1.2. Chemically Derived
- 5.2. Market Analysis, Insights and Forecast - by Type
- 5.2.1. Vitamins
- 5.2.2. Polyphenols
- 5.2.3. Enzymes
- 5.2.4. Carotenoids
- 5.2.5. Other Ty
- 5.3. Market Analysis, Insights and Forecast - by Application
- 5.3.1. Skin Care
- 5.3.2. Hair Care
- 5.3.3. Injectables
- 5.3.4. Other Applications (Makeup and Body care)
- 5.4. Market Analysis, Insights and Forecast - by Region
- 5.4.1. Asia Pacific
- 5.4.2. North America
- 5.4.3. Europe
- 5.4.4. South America
- 5.4.5. Middle East and Africa
- 5.1. Market Analysis, Insights and Forecast - by Source
- 6. Global Cosmetic Antioxidants Industry Analysis, Insights and Forecast, 2021-2033
- 6.1. Market Analysis, Insights and Forecast - by Source
- 6.1.1. Natural
- 6.1.2. Chemically Derived
- 6.2. Market Analysis, Insights and Forecast - by Type
- 6.2.1. Vitamins
- 6.2.2. Polyphenols
- 6.2.3. Enzymes
- 6.2.4. Carotenoids
- 6.2.5. Other Ty
- 6.3. Market Analysis, Insights and Forecast - by Application
- 6.3.1. Skin Care
- 6.3.2. Hair Care
- 6.3.3. Injectables
- 6.3.4. Other Applications (Makeup and Body care)
- 6.1. Market Analysis, Insights and Forecast - by Source
- 7. Asia Pacific Cosmetic Antioxidants Industry Analysis, Insights and Forecast, 2020-2032
- 7.1. Market Analysis, Insights and Forecast - by Source
- 7.1.1. Natural
- 7.1.2. Chemically Derived
- 7.2. Market Analysis, Insights and Forecast - by Type
- 7.2.1. Vitamins
- 7.2.2. Polyphenols
- 7.2.3. Enzymes
- 7.2.4. Carotenoids
- 7.2.5. Other Ty
- 7.3. Market Analysis, Insights and Forecast - by Application
- 7.3.1. Skin Care
- 7.3.2. Hair Care
- 7.3.3. Injectables
- 7.3.4. Other Applications (Makeup and Body care)
- 7.1. Market Analysis, Insights and Forecast - by Source
- 8. North America Cosmetic Antioxidants Industry Analysis, Insights and Forecast, 2020-2032
- 8.1. Market Analysis, Insights and Forecast - by Source
- 8.1.1. Natural
- 8.1.2. Chemically Derived
- 8.2. Market Analysis, Insights and Forecast - by Type
- 8.2.1. Vitamins
- 8.2.2. Polyphenols
- 8.2.3. Enzymes
- 8.2.4. Carotenoids
- 8.2.5. Other Ty
- 8.3. Market Analysis, Insights and Forecast - by Application
- 8.3.1. Skin Care
- 8.3.2. Hair Care
- 8.3.3. Injectables
- 8.3.4. Other Applications (Makeup and Body care)
- 8.1. Market Analysis, Insights and Forecast - by Source
- 9. Europe Cosmetic Antioxidants Industry Analysis, Insights and Forecast, 2020-2032
- 9.1. Market Analysis, Insights and Forecast - by Source
- 9.1.1. Natural
- 9.1.2. Chemically Derived
- 9.2. Market Analysis, Insights and Forecast - by Type
- 9.2.1. Vitamins
- 9.2.2. Polyphenols
- 9.2.3. Enzymes
- 9.2.4. Carotenoids
- 9.2.5. Other Ty
- 9.3. Market Analysis, Insights and Forecast - by Application
- 9.3.1. Skin Care
- 9.3.2. Hair Care
- 9.3.3. Injectables
- 9.3.4. Other Applications (Makeup and Body care)
- 9.1. Market Analysis, Insights and Forecast - by Source
- 10. South America Cosmetic Antioxidants Industry Analysis, Insights and Forecast, 2020-2032
- 10.1. Market Analysis, Insights and Forecast - by Source
- 10.1.1. Natural
- 10.1.2. Chemically Derived
- 10.2. Market Analysis, Insights and Forecast - by Type
- 10.2.1. Vitamins
- 10.2.2. Polyphenols
- 10.2.3. Enzymes
- 10.2.4. Carotenoids
- 10.2.5. Other Ty
- 10.3. Market Analysis, Insights and Forecast - by Application
- 10.3.1. Skin Care
- 10.3.2. Hair Care
- 10.3.3. Injectables
- 10.3.4. Other Applications (Makeup and Body care)
- 10.1. Market Analysis, Insights and Forecast - by Source
- 11. Middle East and Africa Cosmetic Antioxidants Industry Analysis, Insights and Forecast, 2020-2032
- 11.1. Market Analysis, Insights and Forecast - by Source
- 11.1.1. Natural
- 11.1.2. Chemically Derived
- 11.2. Market Analysis, Insights and Forecast - by Type
- 11.2.1. Vitamins
- 11.2.2. Polyphenols
- 11.2.3. Enzymes
- 11.2.4. Carotenoids
- 11.2.5. Other Ty
- 11.3. Market Analysis, Insights and Forecast - by Application
- 11.3.1. Skin Care
- 11.3.2. Hair Care
- 11.3.3. Injectables
- 11.3.4. Other Applications (Makeup and Body care)
- 11.1. Market Analysis, Insights and Forecast - by Source
- 12. Competitive Analysis
- 12.1. Company Profiles
- 12.1.1 Koninklijke DSM
- 12.1.1.1. Company Overview
- 12.1.1.2. Products
- 12.1.1.3. Company Financials
- 12.1.1.4. SWOT Analysis
- 12.1.2 Lonza Group
- 12.1.2.1. Company Overview
- 12.1.2.2. Products
- 12.1.2.3. Company Financials
- 12.1.2.4. SWOT Analysis
- 12.1.3 Kemin Industries
- 12.1.3.1. Company Overview
- 12.1.3.2. Products
- 12.1.3.3. Company Financials
- 12.1.3.4. SWOT Analysis
- 12.1.4 Evonik Industries AG
- 12.1.4.1. Company Overview
- 12.1.4.2. Products
- 12.1.4.3. Company Financials
- 12.1.4.4. SWOT Analysis
- 12.1.5 Provital Group
- 12.1.5.1. Company Overview
- 12.1.5.2. Products
- 12.1.5.3. Company Financials
- 12.1.5.4. SWOT Analysis
- 12.1.6 Croda International Plc
- 12.1.6.1. Company Overview
- 12.1.6.2. Products
- 12.1.6.3. Company Financials
- 12.1.6.4. SWOT Analysis
- 12.1.7 BASF SE
- 12.1.7.1. Company Overview
- 12.1.7.2. Products
- 12.1.7.3. Company Financials
- 12.1.7.4. SWOT Analysis
- 12.1.8 Eastman Chemical Company
- 12.1.8.1. Company Overview
- 12.1.8.2. Products
- 12.1.8.3. Company Financials
- 12.1.8.4. SWOT Analysis
- 12.1.9 BTSA Biotecnologias Aplicadas
- 12.1.9.1. Company Overview
- 12.1.9.2. Products
- 12.1.9.3. Company Financials
- 12.1.9.4. SWOT Analysis
- 12.1.10 Wacker Chemie AG*List Not Exhaustive
- 12.1.10.1. Company Overview
- 12.1.10.2. Products
- 12.1.10.3. Company Financials
- 12.1.10.4. SWOT Analysis
- 12.1.1 Koninklijke DSM
- 12.2. Market Entropy
- 12.2.1 Company's Key Areas Served
- 12.2.2 Recent Developments
- 12.3. Company Market Share Analysis 2025
- 12.3.1 Top 5 Companies Market Share Analysis
- 12.3.2 Top 3 Companies Market Share Analysis
- 12.4. List of Potential Customers
- 13. Research Methodology
List of Figures
- Figure 1: Global Cosmetic Antioxidants Industry Revenue Breakdown (Million, %) by Region 2025 & 2033
- Figure 2: Asia Pacific Cosmetic Antioxidants Industry Revenue (Million), by Source 2025 & 2033
- Figure 3: Asia Pacific Cosmetic Antioxidants Industry Revenue Share (%), by Source 2025 & 2033
- Figure 4: Asia Pacific Cosmetic Antioxidants Industry Revenue (Million), by Type 2025 & 2033
- Figure 5: Asia Pacific Cosmetic Antioxidants Industry Revenue Share (%), by Type 2025 & 2033
- Figure 6: Asia Pacific Cosmetic Antioxidants Industry Revenue (Million), by Application 2025 & 2033
- Figure 7: Asia Pacific Cosmetic Antioxidants Industry Revenue Share (%), by Application 2025 & 2033
- Figure 8: Asia Pacific Cosmetic Antioxidants Industry Revenue (Million), by Country 2025 & 2033
- Figure 9: Asia Pacific Cosmetic Antioxidants Industry Revenue Share (%), by Country 2025 & 2033
- Figure 10: North America Cosmetic Antioxidants Industry Revenue (Million), by Source 2025 & 2033
- Figure 11: North America Cosmetic Antioxidants Industry Revenue Share (%), by Source 2025 & 2033
- Figure 12: North America Cosmetic Antioxidants Industry Revenue (Million), by Type 2025 & 2033
- Figure 13: North America Cosmetic Antioxidants Industry Revenue Share (%), by Type 2025 & 2033
- Figure 14: North America Cosmetic Antioxidants Industry Revenue (Million), by Application 2025 & 2033
- Figure 15: North America Cosmetic Antioxidants Industry Revenue Share (%), by Application 2025 & 2033
- Figure 16: North America Cosmetic Antioxidants Industry Revenue (Million), by Country 2025 & 2033
- Figure 17: North America Cosmetic Antioxidants Industry Revenue Share (%), by Country 2025 & 2033
- Figure 18: Europe Cosmetic Antioxidants Industry Revenue (Million), by Source 2025 & 2033
- Figure 19: Europe Cosmetic Antioxidants Industry Revenue Share (%), by Source 2025 & 2033
- Figure 20: Europe Cosmetic Antioxidants Industry Revenue (Million), by Type 2025 & 2033
- Figure 21: Europe Cosmetic Antioxidants Industry Revenue Share (%), by Type 2025 & 2033
- Figure 22: Europe Cosmetic Antioxidants Industry Revenue (Million), by Application 2025 & 2033
- Figure 23: Europe Cosmetic Antioxidants Industry Revenue Share (%), by Application 2025 & 2033
- Figure 24: Europe Cosmetic Antioxidants Industry Revenue (Million), by Country 2025 & 2033
- Figure 25: Europe Cosmetic Antioxidants Industry Revenue Share (%), by Country 2025 & 2033
- Figure 26: South America Cosmetic Antioxidants Industry Revenue (Million), by Source 2025 & 2033
- Figure 27: South America Cosmetic Antioxidants Industry Revenue Share (%), by Source 2025 & 2033
- Figure 28: South America Cosmetic Antioxidants Industry Revenue (Million), by Type 2025 & 2033
- Figure 29: South America Cosmetic Antioxidants Industry Revenue Share (%), by Type 2025 & 2033
- Figure 30: South America Cosmetic Antioxidants Industry Revenue (Million), by Application 2025 & 2033
- Figure 31: South America Cosmetic Antioxidants Industry Revenue Share (%), by Application 2025 & 2033
- Figure 32: South America Cosmetic Antioxidants Industry Revenue (Million), by Country 2025 & 2033
- Figure 33: South America Cosmetic Antioxidants Industry Revenue Share (%), by Country 2025 & 2033
- Figure 34: Middle East and Africa Cosmetic Antioxidants Industry Revenue (Million), by Source 2025 & 2033
- Figure 35: Middle East and Africa Cosmetic Antioxidants Industry Revenue Share (%), by Source 2025 & 2033
- Figure 36: Middle East and Africa Cosmetic Antioxidants Industry Revenue (Million), by Type 2025 & 2033
- Figure 37: Middle East and Africa Cosmetic Antioxidants Industry Revenue Share (%), by Type 2025 & 2033
- Figure 38: Middle East and Africa Cosmetic Antioxidants Industry Revenue (Million), by Application 2025 & 2033
- Figure 39: Middle East and Africa Cosmetic Antioxidants Industry Revenue Share (%), by Application 2025 & 2033
- Figure 40: Middle East and Africa Cosmetic Antioxidants Industry Revenue (Million), by Country 2025 & 2033
- Figure 41: Middle East and Africa Cosmetic Antioxidants Industry Revenue Share (%), by Country 2025 & 2033
List of Tables
- Table 1: Global Cosmetic Antioxidants Industry Revenue Million Forecast, by Source 2020 & 2033
- Table 2: Global Cosmetic Antioxidants Industry Revenue Million Forecast, by Type 2020 & 2033
- Table 3: Global Cosmetic Antioxidants Industry Revenue Million Forecast, by Application 2020 & 2033
- Table 4: Global Cosmetic Antioxidants Industry Revenue Million Forecast, by Region 2020 & 2033
- Table 5: Global Cosmetic Antioxidants Industry Revenue Million Forecast, by Source 2020 & 2033
- Table 6: Global Cosmetic Antioxidants Industry Revenue Million Forecast, by Type 2020 & 2033
- Table 7: Global Cosmetic Antioxidants Industry Revenue Million Forecast, by Application 2020 & 2033
- Table 8: Global Cosmetic Antioxidants Industry Revenue Million Forecast, by Country 2020 & 2033
- Table 9: China Cosmetic Antioxidants Industry Revenue (Million) Forecast, by Application 2020 & 2033
- Table 10: India Cosmetic Antioxidants Industry Revenue (Million) Forecast, by Application 2020 & 2033
- Table 11: Japan Cosmetic Antioxidants Industry Revenue (Million) Forecast, by Application 2020 & 2033
- Table 12: South Korea Cosmetic Antioxidants Industry Revenue (Million) Forecast, by Application 2020 & 2033
- Table 13: Rest of Asia Pacific Cosmetic Antioxidants Industry Revenue (Million) Forecast, by Application 2020 & 2033
- Table 14: Global Cosmetic Antioxidants Industry Revenue Million Forecast, by Source 2020 & 2033
- Table 15: Global Cosmetic Antioxidants Industry Revenue Million Forecast, by Type 2020 & 2033
- Table 16: Global Cosmetic Antioxidants Industry Revenue Million Forecast, by Application 2020 & 2033
- Table 17: Global Cosmetic Antioxidants Industry Revenue Million Forecast, by Country 2020 & 2033
- Table 18: United States Cosmetic Antioxidants Industry Revenue (Million) Forecast, by Application 2020 & 2033
- Table 19: Canada Cosmetic Antioxidants Industry Revenue (Million) Forecast, by Application 2020 & 2033
- Table 20: Mexico Cosmetic Antioxidants Industry Revenue (Million) Forecast, by Application 2020 & 2033
- Table 21: Global Cosmetic Antioxidants Industry Revenue Million Forecast, by Source 2020 & 2033
- Table 22: Global Cosmetic Antioxidants Industry Revenue Million Forecast, by Type 2020 & 2033
- Table 23: Global Cosmetic Antioxidants Industry Revenue Million Forecast, by Application 2020 & 2033
- Table 24: Global Cosmetic Antioxidants Industry Revenue Million Forecast, by Country 2020 & 2033
- Table 25: Germany Cosmetic Antioxidants Industry Revenue (Million) Forecast, by Application 2020 & 2033
- Table 26: United Kingdom Cosmetic Antioxidants Industry Revenue (Million) Forecast, by Application 2020 & 2033
- Table 27: Italy Cosmetic Antioxidants Industry Revenue (Million) Forecast, by Application 2020 & 2033
- Table 28: France Cosmetic Antioxidants Industry Revenue (Million) Forecast, by Application 2020 & 2033
- Table 29: Rest of Europe Cosmetic Antioxidants Industry Revenue (Million) Forecast, by Application 2020 & 2033
- Table 30: Global Cosmetic Antioxidants Industry Revenue Million Forecast, by Source 2020 & 2033
- Table 31: Global Cosmetic Antioxidants Industry Revenue Million Forecast, by Type 2020 & 2033
- Table 32: Global Cosmetic Antioxidants Industry Revenue Million Forecast, by Application 2020 & 2033
- Table 33: Global Cosmetic Antioxidants Industry Revenue Million Forecast, by Country 2020 & 2033
- Table 34: Brazil Cosmetic Antioxidants Industry Revenue (Million) Forecast, by Application 2020 & 2033
- Table 35: Argentina Cosmetic Antioxidants Industry Revenue (Million) Forecast, by Application 2020 & 2033
- Table 36: Rest of South America Cosmetic Antioxidants Industry Revenue (Million) Forecast, by Application 2020 & 2033
- Table 37: Global Cosmetic Antioxidants Industry Revenue Million Forecast, by Source 2020 & 2033
- Table 38: Global Cosmetic Antioxidants Industry Revenue Million Forecast, by Type 2020 & 2033
- Table 39: Global Cosmetic Antioxidants Industry Revenue Million Forecast, by Application 2020 & 2033
- Table 40: Global Cosmetic Antioxidants Industry Revenue Million Forecast, by Country 2020 & 2033
- Table 41: Saudi Arabia Cosmetic Antioxidants Industry Revenue (Million) Forecast, by Application 2020 & 2033
- Table 42: South Africa Cosmetic Antioxidants Industry Revenue (Million) Forecast, by Application 2020 & 2033
- Table 43: Rest of Middle East and Africa Cosmetic Antioxidants Industry Revenue (Million) Forecast, by Application 2020 & 2033
Frequently Asked Questions
1. What is the projected Compound Annual Growth Rate (CAGR) of the Cosmetic Antioxidants Industry?
The projected CAGR is approximately 5.95%.
2. Which companies are prominent players in the Cosmetic Antioxidants Industry?
Key companies in the market include Koninklijke DSM, Lonza Group, Kemin Industries, Evonik Industries AG, Provital Group, Croda International Plc, BASF SE, Eastman Chemical Company, BTSA Biotecnologias Aplicadas, Wacker Chemie AG*List Not Exhaustive.
3. What are the main segments of the Cosmetic Antioxidants Industry?
The market segments include Source, Type, Application.
4. Can you provide details about the market size?
The market size is estimated to be USD 139.23 Million as of 2022.
5. What are some drivers contributing to market growth?
Rise in Online Purcahse of Cosmetics; Increasing Use of Beauty Products and Personal Care Products; Other Drivers.
6. What are the notable trends driving market growth?
Increasing Usage of Natural Antioxidants in Cosmetics Products.
7. Are there any restraints impacting market growth?
High Cost of Natural Antioxidants; Other Restraints.
8. Can you provide examples of recent developments in the market?
October 2023: BASF's Care Chemicals division is investing in a new plant to produce emollient specialties at its Düsseldorf site targeted for skin and sun protection products.
9. What pricing options are available for accessing the report?
Pricing options include single-user, multi-user, and enterprise licenses priced at USD 4750, USD 5250, and USD 8750 respectively.
10. Is the market size provided in terms of value or volume?
The market size is provided in terms of value, measured in Million.
11. Are there any specific market keywords associated with the report?
Yes, the market keyword associated with the report is "Cosmetic Antioxidants Industry," which aids in identifying and referencing the specific market segment covered.
12. How do I determine which pricing option suits my needs best?
The pricing options vary based on user requirements and access needs. Individual users may opt for single-user licenses, while businesses requiring broader access may choose multi-user or enterprise licenses for cost-effective access to the report.
13. Are there any additional resources or data provided in the Cosmetic Antioxidants Industry report?
While the report offers comprehensive insights, it's advisable to review the specific contents or supplementary materials provided to ascertain if additional resources or data are available.
14. How can I stay updated on further developments or reports in the Cosmetic Antioxidants Industry?
To stay informed about further developments, trends, and reports in the Cosmetic Antioxidants Industry, consider subscribing to industry newsletters, following relevant companies and organizations, or regularly checking reputable industry news sources and publications.
Methodology
Step 1 - Identification of Relevant Samples Size from Population Database


Step 2 - Approaches for Defining Global Market Size (Value, Volume* & Price*)

Note*: In applicable scenarios
Step 3 - Data Sources
Primary Research
- Web Analytics
- Survey Reports
- Research Institute
- Latest Research Reports
- Opinion Leaders
Secondary Research
- Annual Reports
- White Paper
- Latest Press Release
- Industry Association
- Paid Database
- Investor Presentations

Step 4 - Data Triangulation
Involves using different sources of information in order to increase the validity of a study
These sources are likely to be stakeholders in a program - participants, other researchers, program staff, other community members, and so on.
Then we put all data in single framework & apply various statistical tools to find out the dynamic on the market.
During the analysis stage, feedback from the stakeholder groups would be compared to determine areas of agreement as well as areas of divergence