

Key Insights
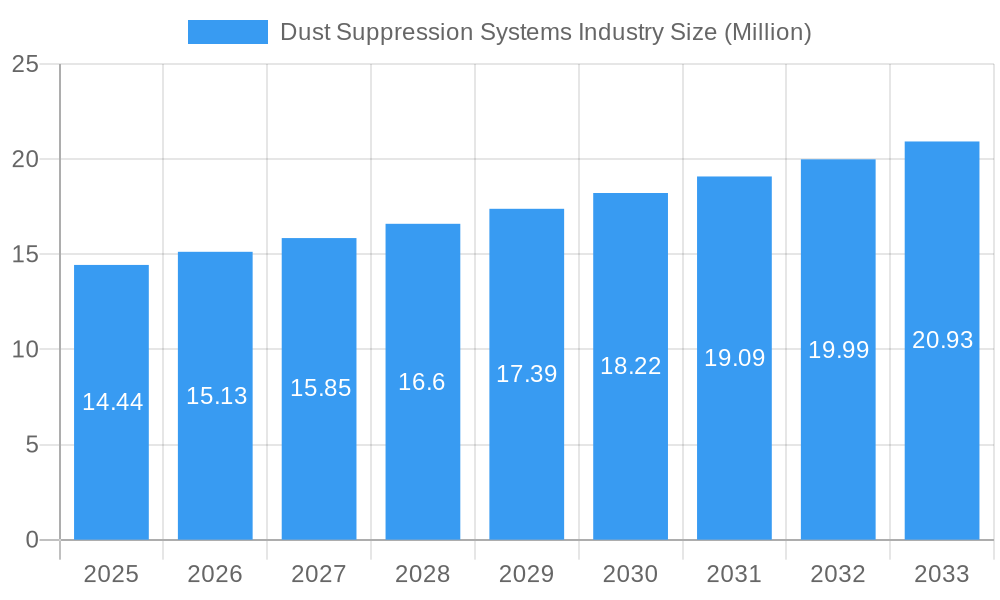
The global Dust Suppression Systems market is poised for significant growth, currently valued at an estimated $14.44 million. Projecting a Compound Annual Growth Rate (CAGR) of 4.73% from 2025 to 2033, the market is expected to expand substantially, driven by increasing global industrialization, stringent environmental regulations, and a growing awareness of the health hazards associated with airborne dust. Key growth drivers include the mining sector, where dust control is paramount for worker safety and operational efficiency, and the construction industry, which faces growing pressure to mitigate environmental impact. The demand for effective dust suppression solutions is further fueled by the oil and gas sector, particularly in operations involving fracking and drilling, and the food and beverage industry where hygiene and product integrity are critical. Emerging economies in the Asia Pacific region, led by China and India, are anticipated to be major growth contributors due to rapid infrastructure development and expanding industrial bases.
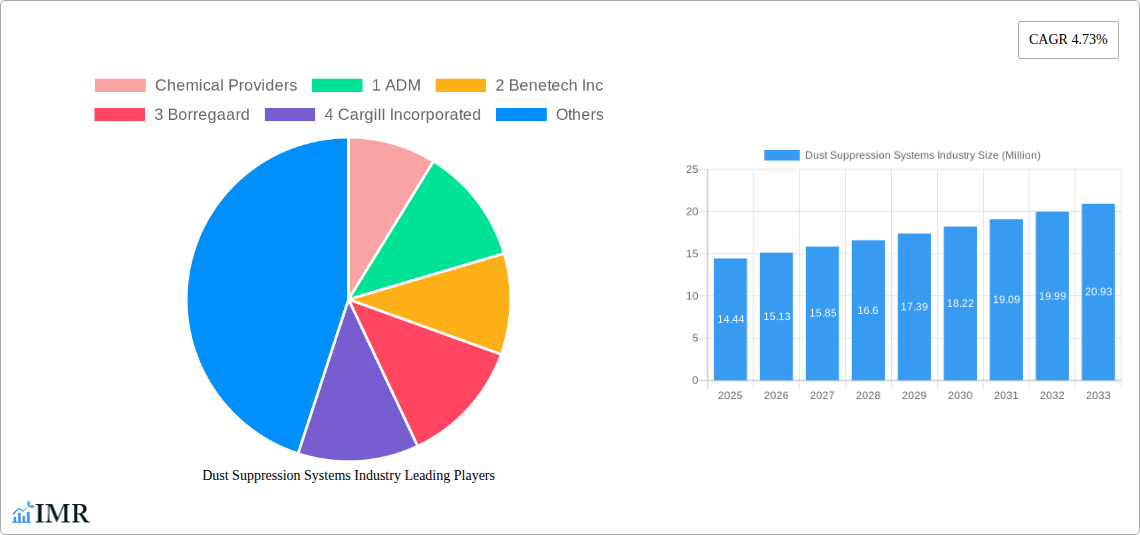
Dust Suppression Systems Industry Market Size (In Million)
The market is segmented across various chemical types, including Lignin Sulfonate, Calcium Chloride, Magnesium Chloride, Asphalt Emulsions, Oil Emulsions, and Polymeric Emulsions, each offering unique properties for different dust suppression applications. System types are broadly categorized into Dry Collection and Wet Suppression, with wet suppression methods gaining traction due to their high efficiency in capturing fine dust particles. The competitive landscape is characterized by a mix of established chemical providers and specialized system manufacturers. Leading chemical providers like ADM, Cargill Incorporated, and Evonik Industries AG, alongside system providers such as BossTek, Camfil, and Nederman Holding AB, are actively innovating to offer advanced, cost-effective, and environmentally friendly solutions. Challenges to market growth, such as the initial capital investment for sophisticated systems and the availability of natural dust suppressants in certain regions, are being addressed through technological advancements and evolving regulatory frameworks that prioritize sustainable dust management practices.
Dust Suppression Systems Industry Company Market Share
Dust Suppression Systems Industry Report: Comprehensive Market Analysis & Forecast (2019-2033)
This in-depth report provides a definitive analysis of the global Dust Suppression Systems Industry, offering critical insights into market dynamics, growth trajectories, and competitive landscapes. Covering a comprehensive study period from 2019 to 2033, with a base year of 2025, this research is essential for stakeholders seeking to understand the evolution of dust control solutions. We delve into parent and child market segments, including chemical types like Lignin Sulfonate, Calcium Chloride, and Polymeric Emulsions, system types such as Dry Collection and Wet Suppression, and crucial end-user industries including Mining, Construction, and Oil & Gas. With a focus on SEO optimization and high-traffic keywords, this report maximizes visibility for industry professionals. All values are presented in Million units for clear quantitative understanding.
Dust Suppression Systems Industry Market Dynamics & Structure
The Dust Suppression Systems Industry is characterized by a dynamic interplay of technological innovation, stringent regulatory frameworks, and evolving end-user demands. Market concentration varies across regions, with established players and emerging innovators vying for market share. Technological advancements in chemical formulations and system design are key drivers, pushing the boundaries of efficiency and environmental compliance. Regulatory mandates concerning air quality and worker safety are increasingly influencing product development and adoption rates. Competitive product substitutes, ranging from water-based sprays to advanced chemical agents, necessitate continuous innovation and cost-effectiveness. End-user demographics are expanding, driven by growth in sectors like mining, construction, and the oil and gas industry, each with unique dust suppression needs. Merger and acquisition (M&A) trends are indicative of market consolidation and strategic expansion, with a notable increase in deal volumes as companies seek to broaden their product portfolios and geographical reach.
- Market Concentration: Fragmented in some regions, consolidated in others, with a growing trend towards strategic alliances.
- Technological Innovation Drivers: Demand for eco-friendly solutions, improved efficiency, and automation in dust control.
- Regulatory Frameworks: Increasingly stringent environmental and occupational health and safety regulations worldwide.
- Competitive Product Substitutes: Ongoing development of advanced chemical agents, improved filtration technologies, and water-saving suppression methods.
- End-User Demographics: Driven by global infrastructure development, resource extraction, and industrial expansion.
- M&A Trends: Companies are actively acquiring smaller players to gain market access, technology, and patents.
Dust Suppression Systems Industry Growth Trends & Insights
The global Dust Suppression Systems Industry is poised for robust growth, projected to experience a Compound Annual Growth Rate (CAGR) of XX% between 2025 and 2033. This expansion is fueled by a confluence of factors, including escalating global industrialization, heightened awareness of environmental pollution, and increasingly stringent government regulations aimed at improving air quality and worker safety. The market size evolution is directly linked to the demand from critical end-user sectors such as mining, construction, and the burgeoning oil and gas industry. Adoption rates for advanced dust suppression technologies are on an upward trajectory, as businesses recognize the long-term economic benefits of mitigating dust, including reduced equipment wear, improved operational efficiency, and minimized health-related costs.
Technological disruptions are a significant feature of this market. Innovations in chemical formulations, such as enhanced polymeric emulsions and eco-friendly lignin sulfonates, are offering more effective and sustainable dust control solutions. Furthermore, the development of intelligent and automated wet suppression systems, alongside advancements in dry collection technologies, are transforming how dust is managed across various industrial applications. Consumer behavior shifts are also playing a crucial role. End-users are increasingly prioritizing solutions that not only comply with regulations but also offer cost-effectiveness and environmental responsibility. This trend is driving demand for customized dust suppression strategies tailored to specific operational needs and environmental conditions. The market penetration of sophisticated dust suppression systems is expected to deepen as awareness of their multifaceted benefits, from operational safety to environmental stewardship, continues to grow across industries globally. The estimated market size in 2025 stands at $XX million units, with projections indicating significant expansion driven by these fundamental growth trends.
Dominant Regions, Countries, or Segments in Dust Suppression Systems Industry
The Dust Suppression Systems Industry is witnessing significant growth drivers across various regions and segments, with Mining emerging as the dominant end-user industry. This segment's prominence is attributed to the continuous global demand for natural resources, necessitating extensive excavation and material handling operations that inherently generate substantial dust. Government regulations in key mining nations, coupled with a growing emphasis on sustainable mining practices and worker health, are compelling mining companies to invest heavily in advanced dust suppression technologies. The Mining sector alone is estimated to account for approximately 35% of the total dust suppression systems market share in 2025, with a projected CAGR of XX% during the forecast period.
Within the Chemical Type segment, Lignin Sulfonate is a leading contender due to its cost-effectiveness, natural origin, and efficacy in dust binding, particularly in unpaved road applications and mining operations. Its market share is substantial, driven by its widespread availability and biodegradability. However, Polymeric Emulsions are gaining traction rapidly, offering superior performance and longevity, especially in demanding construction and industrial environments. The System Type segment is largely dominated by Wet Suppression systems. These systems are highly effective in capturing airborne dust particles by binding them with water or chemical agents. Their widespread application in construction sites, quarries, and industrial facilities, especially where dust generation is continuous and significant, underpins their market dominance.
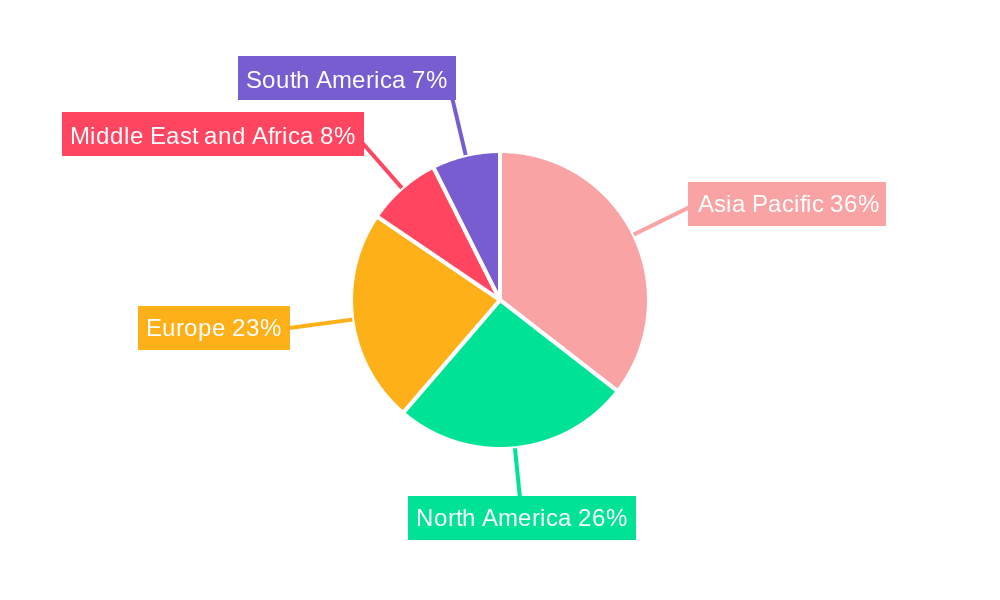
Geographically, North America and Asia-Pacific are the leading regions driving market growth. North America benefits from its well-established mining and construction sectors, coupled with stringent environmental regulations. Asia-Pacific, particularly China and India, is experiencing unprecedented infrastructure development, leading to a surge in construction and mining activities, thereby creating immense demand for dust suppression solutions. Economic policies supporting industrial growth and infrastructure investment in these regions are key drivers. Furthermore, the focus on reducing air pollution in densely populated urban centers within Asia-Pacific is accelerating the adoption of dust suppression technologies.
- Dominant End-User Industry: Mining, driven by global resource demand and worker safety regulations.
- Leading Chemical Type: Lignin Sulfonate, owing to its cost-effectiveness and eco-friendly profile; Polymeric Emulsions for high-performance applications.
- Dominant System Type: Wet Suppression, due to its effectiveness in capturing airborne dust in diverse industrial settings.
- Leading Regions: North America and Asia-Pacific, propelled by robust industrial activity, infrastructure development, and regulatory frameworks.
- Key Drivers in Dominant Regions:
- North America: Mature mining and construction industries, strict environmental standards.
- Asia-Pacific: Rapid infrastructure development, increasing urbanization, government initiatives for pollution control.
- Market Share & Growth Potential: The mining sector is projected to maintain its leading position with significant growth potential, while wet suppression systems will continue to dominate system types due to their versatility.
Dust Suppression Systems Industry Product Landscape
The product landscape of the Dust Suppression Systems Industry is characterized by continuous innovation focused on enhancing efficiency, sustainability, and ease of use. Leading companies are introducing advanced chemical formulations that offer superior dust binding capabilities with reduced environmental impact, such as bio-based agents and biodegradable polymers. System providers are developing sophisticated equipment, including automated mist cannons, mobile dust extractors, and integrated dry collection systems, designed for specific industrial applications. These innovations aim to provide targeted dust control, minimize water usage, and improve operator safety. Performance metrics are increasingly focused on dust capture efficiency, long-term effectiveness, and compatibility with diverse environmental conditions.
Key Drivers, Barriers & Challenges in Dust Suppression Systems Industry
The Dust Suppression Systems Industry is propelled by several key drivers, primarily stemming from increasing global awareness of air pollution and its associated health risks, coupled with stringent environmental regulations mandating cleaner industrial operations. Economic growth, particularly in infrastructure development and resource extraction sectors like mining and construction, creates substantial demand for effective dust control solutions. Technological advancements in chemical formulations and application systems, leading to more efficient and cost-effective solutions, also act as significant drivers.
However, the market faces several barriers and challenges. The initial capital investment for advanced dust suppression systems can be substantial, posing a challenge for small and medium-sized enterprises. Fluctuations in raw material prices for chemical agents can impact the profitability of manufacturers. Moreover, the availability of effective substitutes, such as basic water spraying, can sometimes limit the adoption of more advanced technologies. Supply chain disruptions and logistical complexities in delivering specialized equipment and chemicals to remote industrial sites also present hurdles. Competitive pressures and the need for continuous R&D to stay ahead of evolving regulatory requirements and performance demands add to the challenges.
Emerging Opportunities in Dust Suppression Systems Industry
Emerging opportunities in the Dust Suppression Systems Industry lie in the development and adoption of smart and IoT-enabled dust monitoring and control systems. These technologies offer real-time data analysis for optimized dust management, predictive maintenance, and enhanced operational efficiency. The increasing focus on sustainable and green solutions presents a significant opportunity for companies offering biodegradable chemical agents and water-efficient suppression systems. Untapped markets in emerging economies, driven by rapid industrialization and infrastructure projects, offer substantial growth potential. Furthermore, the growing demand for customized dust suppression solutions tailored to specific industry challenges, such as those found in tunneling operations or pharmaceutical manufacturing, represents a niche but lucrative area for innovation and market penetration.
Growth Accelerators in the Dust Suppression Systems Industry Industry
Long-term growth in the Dust Suppression Systems Industry will be significantly accelerated by ongoing technological breakthroughs, particularly in the development of highly efficient and environmentally benign dust suppression chemicals and advanced filtration technologies. Strategic partnerships between system providers and chemical manufacturers are expected to foster integrated solutions, offering end-users comprehensive dust control packages. Market expansion into developing regions, coupled with government incentives for industrial dust mitigation, will further fuel growth. The increasing adoption of automation and artificial intelligence in dust suppression systems will enhance their effectiveness and reduce operational costs, thereby driving widespread adoption across a broader range of industries and applications.
Key Players Shaping the Dust Suppression Systems Industry Market
- ADM
- Benetech Inc
- Borregaard
- Cargill Incorporated
- Chemtex Speciality Limited
- Evonik Industries AG
- GelTech Solutions
- Hexion
- Quaker Houghton (Quaker Chemical Corporation)
- Shaw Almex Industries Ltd
- SUEZ
- Ecolab
- BossTek
- Camfil
- CW Machine Worx
- Donaldson Company Inc
- DSH Systems Ltd
- Duztech AB
- Nederman Holding AB
- SLY Inc
- The ACT Group
Notable Milestones in Dust Suppression Systems Industry Sector
- March 2024: Camfil Air Pollution Control (APC) unveiled the Gold Series Timer (GST), an innovative dust collection controller designed for intuitive management of pulse-jet cleaning in industrial dust collection systems like baghouses.
- February 2023: BOSSTEK introduced the DustBoss DB-45 Surge, featuring an innovative pressurized center nozzle, enhancing their portable dust-suppression equipment capabilities in various weather conditions.
In-Depth Dust Suppression Systems Industry Market Outlook
The future of the Dust Suppression Systems Industry looks exceptionally promising, with growth accelerators pointing towards sustained expansion. The market is set to be defined by an increasing integration of digital technologies, leading to smarter, more efficient, and data-driven dust control solutions. Innovations in sustainable materials and processes will dominate product development, aligning with global environmental objectives. Strategic collaborations and market expansion into underserved regions will be crucial for major players. The continuous evolution of regulatory landscapes will further solidify the demand for advanced dust suppression systems, creating significant future market potential and strategic opportunities for stakeholders invested in a cleaner, safer industrial future.
Dust Suppression Systems Industry Segmentation
-
1. Chemical Type
- 1.1. Lignin Sulfonate
- 1.2. Calcium Chloride
- 1.3. Magnesium Chloride
- 1.4. Asphalt Emulsions
- 1.5. Oil Emulsions
- 1.6. Polymeric Emulsions
- 1.7. Other Chemical Types
-
2. System Type
- 2.1. Dry Collection
- 2.2. Wet Suppression
-
3. End-user Industry
- 3.1. Mining
- 3.2. Construction
- 3.3. Food and Beverage
- 3.4. Oil and Gas and Petrochemical
- 3.5. Pharmaceutical
- 3.6. Other End-user Industries
Dust Suppression Systems Industry Segmentation By Geography
-
1. Asia Pacific
- 1.1. China
- 1.2. India
- 1.3. Japan
- 1.4. South Korea
- 1.5. Malaysia
- 1.6. Thailand
- 1.7. Indonesia
- 1.8. Vietnam
- 1.9. Rest of Asia Pacific
-
2. North America
- 2.1. United States
- 2.2. Canada
- 2.3. Mexico
-
3. Europe
- 3.1. Germany
- 3.2. United Kingdom
- 3.3. Italy
- 3.4. France
- 3.5. Italy
- 3.6. Spain
- 3.7. Nordic Countries
- 3.8. Turkey
- 3.9. Russia
- 3.10. Rest of Europe
-
4. South America
- 4.1. Brazil
- 4.2. Argentina
- 4.3. Colombia
- 4.4. Rest of South America
-
5. Middle East and Africa
- 5.1. Saudi Arabia
- 5.2. Qatar
- 5.3. United Arab Emirates
- 5.4. Nigeria
- 5.5. Egypt
- 5.6. South Africa
- 5.7. Rest of Middle East and Africa
Dust Suppression Systems Industry Regional Market Share
Geographic Coverage of Dust Suppression Systems Industry
Dust Suppression Systems Industry REPORT HIGHLIGHTS
| Aspects | Details |
|---|---|
| Study Period | 2020-2034 |
| Base Year | 2025 |
| Estimated Year | 2026 |
| Forecast Period | 2026-2034 |
| Historical Period | 2020-2025 |
| Growth Rate | CAGR of 4.73% from 2020-2034 |
| Segmentation |
|
Table of Contents
- 1. Introduction
- 1.1. Research Scope
- 1.2. Market Segmentation
- 1.3. Research Objective
- 1.4. Definitions and Assumptions
- 2. Executive Summary
- 2.1. Market Snapshot
- 3. Market Dynamics
- 3.1. Market Drivers
- 3.2. Market Restrains
- 3.3. Market Trends
- 3.4. Market Opportunities
- 4. Market Factor Analysis
- 4.1. Porters Five Forces
- 4.1.1. Bargaining Power of Suppliers
- 4.1.2. Bargaining Power of Buyers
- 4.1.3. Threat of New Entrants
- 4.1.4. Threat of Substitutes
- 4.1.5. Competitive Rivalry
- 4.2. PESTEL analysis
- 4.3. BCG Analysis
- 4.3.1. Stars (High Growth, High Market Share)
- 4.3.2. Cash Cows (Low Growth, High Market Share)
- 4.3.3. Question Mark (High Growth, Low Market Share)
- 4.3.4. Dogs (Low Growth, Low Market Share)
- 4.4. Ansoff Matrix Analysis
- 4.5. Supply Chain Analysis
- 4.6. Regulatory Landscape
- 4.7. Current Market Potential and Opportunity Assessment (TAM–SAM–SOM Framework)
- 4.8. IMR Analyst Note
- 4.1. Porters Five Forces
- 5. Market Analysis, Insights and Forecast 2021-2033
- 5.1. Market Analysis, Insights and Forecast - by Chemical Type
- 5.1.1. Lignin Sulfonate
- 5.1.2. Calcium Chloride
- 5.1.3. Magnesium Chloride
- 5.1.4. Asphalt Emulsions
- 5.1.5. Oil Emulsions
- 5.1.6. Polymeric Emulsions
- 5.1.7. Other Chemical Types
- 5.2. Market Analysis, Insights and Forecast - by System Type
- 5.2.1. Dry Collection
- 5.2.2. Wet Suppression
- 5.3. Market Analysis, Insights and Forecast - by End-user Industry
- 5.3.1. Mining
- 5.3.2. Construction
- 5.3.3. Food and Beverage
- 5.3.4. Oil and Gas and Petrochemical
- 5.3.5. Pharmaceutical
- 5.3.6. Other End-user Industries
- 5.4. Market Analysis, Insights and Forecast - by Region
- 5.4.1. Asia Pacific
- 5.4.2. North America
- 5.4.3. Europe
- 5.4.4. South America
- 5.4.5. Middle East and Africa
- 5.1. Market Analysis, Insights and Forecast - by Chemical Type
- 6. Global Dust Suppression Systems Industry Analysis, Insights and Forecast, 2021-2033
- 6.1. Market Analysis, Insights and Forecast - by Chemical Type
- 6.1.1. Lignin Sulfonate
- 6.1.2. Calcium Chloride
- 6.1.3. Magnesium Chloride
- 6.1.4. Asphalt Emulsions
- 6.1.5. Oil Emulsions
- 6.1.6. Polymeric Emulsions
- 6.1.7. Other Chemical Types
- 6.2. Market Analysis, Insights and Forecast - by System Type
- 6.2.1. Dry Collection
- 6.2.2. Wet Suppression
- 6.3. Market Analysis, Insights and Forecast - by End-user Industry
- 6.3.1. Mining
- 6.3.2. Construction
- 6.3.3. Food and Beverage
- 6.3.4. Oil and Gas and Petrochemical
- 6.3.5. Pharmaceutical
- 6.3.6. Other End-user Industries
- 6.1. Market Analysis, Insights and Forecast - by Chemical Type
- 7. Asia Pacific Dust Suppression Systems Industry Analysis, Insights and Forecast, 2020-2032
- 7.1. Market Analysis, Insights and Forecast - by Chemical Type
- 7.1.1. Lignin Sulfonate
- 7.1.2. Calcium Chloride
- 7.1.3. Magnesium Chloride
- 7.1.4. Asphalt Emulsions
- 7.1.5. Oil Emulsions
- 7.1.6. Polymeric Emulsions
- 7.1.7. Other Chemical Types
- 7.2. Market Analysis, Insights and Forecast - by System Type
- 7.2.1. Dry Collection
- 7.2.2. Wet Suppression
- 7.3. Market Analysis, Insights and Forecast - by End-user Industry
- 7.3.1. Mining
- 7.3.2. Construction
- 7.3.3. Food and Beverage
- 7.3.4. Oil and Gas and Petrochemical
- 7.3.5. Pharmaceutical
- 7.3.6. Other End-user Industries
- 7.1. Market Analysis, Insights and Forecast - by Chemical Type
- 8. North America Dust Suppression Systems Industry Analysis, Insights and Forecast, 2020-2032
- 8.1. Market Analysis, Insights and Forecast - by Chemical Type
- 8.1.1. Lignin Sulfonate
- 8.1.2. Calcium Chloride
- 8.1.3. Magnesium Chloride
- 8.1.4. Asphalt Emulsions
- 8.1.5. Oil Emulsions
- 8.1.6. Polymeric Emulsions
- 8.1.7. Other Chemical Types
- 8.2. Market Analysis, Insights and Forecast - by System Type
- 8.2.1. Dry Collection
- 8.2.2. Wet Suppression
- 8.3. Market Analysis, Insights and Forecast - by End-user Industry
- 8.3.1. Mining
- 8.3.2. Construction
- 8.3.3. Food and Beverage
- 8.3.4. Oil and Gas and Petrochemical
- 8.3.5. Pharmaceutical
- 8.3.6. Other End-user Industries
- 8.1. Market Analysis, Insights and Forecast - by Chemical Type
- 9. Europe Dust Suppression Systems Industry Analysis, Insights and Forecast, 2020-2032
- 9.1. Market Analysis, Insights and Forecast - by Chemical Type
- 9.1.1. Lignin Sulfonate
- 9.1.2. Calcium Chloride
- 9.1.3. Magnesium Chloride
- 9.1.4. Asphalt Emulsions
- 9.1.5. Oil Emulsions
- 9.1.6. Polymeric Emulsions
- 9.1.7. Other Chemical Types
- 9.2. Market Analysis, Insights and Forecast - by System Type
- 9.2.1. Dry Collection
- 9.2.2. Wet Suppression
- 9.3. Market Analysis, Insights and Forecast - by End-user Industry
- 9.3.1. Mining
- 9.3.2. Construction
- 9.3.3. Food and Beverage
- 9.3.4. Oil and Gas and Petrochemical
- 9.3.5. Pharmaceutical
- 9.3.6. Other End-user Industries
- 9.1. Market Analysis, Insights and Forecast - by Chemical Type
- 10. South America Dust Suppression Systems Industry Analysis, Insights and Forecast, 2020-2032
- 10.1. Market Analysis, Insights and Forecast - by Chemical Type
- 10.1.1. Lignin Sulfonate
- 10.1.2. Calcium Chloride
- 10.1.3. Magnesium Chloride
- 10.1.4. Asphalt Emulsions
- 10.1.5. Oil Emulsions
- 10.1.6. Polymeric Emulsions
- 10.1.7. Other Chemical Types
- 10.2. Market Analysis, Insights and Forecast - by System Type
- 10.2.1. Dry Collection
- 10.2.2. Wet Suppression
- 10.3. Market Analysis, Insights and Forecast - by End-user Industry
- 10.3.1. Mining
- 10.3.2. Construction
- 10.3.3. Food and Beverage
- 10.3.4. Oil and Gas and Petrochemical
- 10.3.5. Pharmaceutical
- 10.3.6. Other End-user Industries
- 10.1. Market Analysis, Insights and Forecast - by Chemical Type
- 11. Middle East and Africa Dust Suppression Systems Industry Analysis, Insights and Forecast, 2020-2032
- 11.1. Market Analysis, Insights and Forecast - by Chemical Type
- 11.1.1. Lignin Sulfonate
- 11.1.2. Calcium Chloride
- 11.1.3. Magnesium Chloride
- 11.1.4. Asphalt Emulsions
- 11.1.5. Oil Emulsions
- 11.1.6. Polymeric Emulsions
- 11.1.7. Other Chemical Types
- 11.2. Market Analysis, Insights and Forecast - by System Type
- 11.2.1. Dry Collection
- 11.2.2. Wet Suppression
- 11.3. Market Analysis, Insights and Forecast - by End-user Industry
- 11.3.1. Mining
- 11.3.2. Construction
- 11.3.3. Food and Beverage
- 11.3.4. Oil and Gas and Petrochemical
- 11.3.5. Pharmaceutical
- 11.3.6. Other End-user Industries
- 11.1. Market Analysis, Insights and Forecast - by Chemical Type
- 12. Competitive Analysis
- 12.1. Company Profiles
- 12.1.1 Chemical Providers
- 12.1.1.1. Company Overview
- 12.1.1.2. Products
- 12.1.1.3. Company Financials
- 12.1.1.4. SWOT Analysis
- 12.1.2 1 ADM
- 12.1.2.1. Company Overview
- 12.1.2.2. Products
- 12.1.2.3. Company Financials
- 12.1.2.4. SWOT Analysis
- 12.1.3 2 Benetech Inc
- 12.1.3.1. Company Overview
- 12.1.3.2. Products
- 12.1.3.3. Company Financials
- 12.1.3.4. SWOT Analysis
- 12.1.4 3 Borregaard
- 12.1.4.1. Company Overview
- 12.1.4.2. Products
- 12.1.4.3. Company Financials
- 12.1.4.4. SWOT Analysis
- 12.1.5 4 Cargill Incorporated
- 12.1.5.1. Company Overview
- 12.1.5.2. Products
- 12.1.5.3. Company Financials
- 12.1.5.4. SWOT Analysis
- 12.1.6 5 Chemtex Speciality Limited
- 12.1.6.1. Company Overview
- 12.1.6.2. Products
- 12.1.6.3. Company Financials
- 12.1.6.4. SWOT Analysis
- 12.1.7 6 Evonik Industries AG
- 12.1.7.1. Company Overview
- 12.1.7.2. Products
- 12.1.7.3. Company Financials
- 12.1.7.4. SWOT Analysis
- 12.1.8 7 GelTech Solutions
- 12.1.8.1. Company Overview
- 12.1.8.2. Products
- 12.1.8.3. Company Financials
- 12.1.8.4. SWOT Analysis
- 12.1.9 8 Hexion
- 12.1.9.1. Company Overview
- 12.1.9.2. Products
- 12.1.9.3. Company Financials
- 12.1.9.4. SWOT Analysis
- 12.1.10 9 Quaker Houghton (Quaker Chemical Corporation)
- 12.1.10.1. Company Overview
- 12.1.10.2. Products
- 12.1.10.3. Company Financials
- 12.1.10.4. SWOT Analysis
- 12.1.11 10 Shaw Almex Industries Ltd
- 12.1.11.1. Company Overview
- 12.1.11.2. Products
- 12.1.11.3. Company Financials
- 12.1.11.4. SWOT Analysis
- 12.1.12 11 SUEZ
- 12.1.12.1. Company Overview
- 12.1.12.2. Products
- 12.1.12.3. Company Financials
- 12.1.12.4. SWOT Analysis
- 12.1.13 12 Ecolab
- 12.1.13.1. Company Overview
- 12.1.13.2. Products
- 12.1.13.3. Company Financials
- 12.1.13.4. SWOT Analysis
- 12.1.14 System Providers
- 12.1.14.1. Company Overview
- 12.1.14.2. Products
- 12.1.14.3. Company Financials
- 12.1.14.4. SWOT Analysis
- 12.1.15 1 BossTek
- 12.1.15.1. Company Overview
- 12.1.15.2. Products
- 12.1.15.3. Company Financials
- 12.1.15.4. SWOT Analysis
- 12.1.16 2 Camfil
- 12.1.16.1. Company Overview
- 12.1.16.2. Products
- 12.1.16.3. Company Financials
- 12.1.16.4. SWOT Analysis
- 12.1.17 3 CW Machine Worx
- 12.1.17.1. Company Overview
- 12.1.17.2. Products
- 12.1.17.3. Company Financials
- 12.1.17.4. SWOT Analysis
- 12.1.18 4 Donaldson Company Inc
- 12.1.18.1. Company Overview
- 12.1.18.2. Products
- 12.1.18.3. Company Financials
- 12.1.18.4. SWOT Analysis
- 12.1.19 5 DSH Systems Ltd
- 12.1.19.1. Company Overview
- 12.1.19.2. Products
- 12.1.19.3. Company Financials
- 12.1.19.4. SWOT Analysis
- 12.1.20 6 Duztech AB
- 12.1.20.1. Company Overview
- 12.1.20.2. Products
- 12.1.20.3. Company Financials
- 12.1.20.4. SWOT Analysis
- 12.1.21 7 Nederman Holding AB
- 12.1.21.1. Company Overview
- 12.1.21.2. Products
- 12.1.21.3. Company Financials
- 12.1.21.4. SWOT Analysis
- 12.1.22 8 SLY Inc
- 12.1.22.1. Company Overview
- 12.1.22.2. Products
- 12.1.22.3. Company Financials
- 12.1.22.4. SWOT Analysis
- 12.1.23 9 The ACT Group*List Not Exhaustive
- 12.1.23.1. Company Overview
- 12.1.23.2. Products
- 12.1.23.3. Company Financials
- 12.1.23.4. SWOT Analysis
- 12.1.1 Chemical Providers
- 12.2. Market Entropy
- 12.2.1 Company's Key Areas Served
- 12.2.2 Recent Developments
- 12.3. Company Market Share Analysis 2025
- 12.3.1 Top 5 Companies Market Share Analysis
- 12.3.2 Top 3 Companies Market Share Analysis
- 12.4. List of Potential Customers
- 13. Research Methodology
List of Figures
- Figure 1: Global Dust Suppression Systems Industry Revenue Breakdown (Million, %) by Region 2025 & 2033
- Figure 2: Global Dust Suppression Systems Industry Volume Breakdown (Billion, %) by Region 2025 & 2033
- Figure 3: Asia Pacific Dust Suppression Systems Industry Revenue (Million), by Chemical Type 2025 & 2033
- Figure 4: Asia Pacific Dust Suppression Systems Industry Volume (Billion), by Chemical Type 2025 & 2033
- Figure 5: Asia Pacific Dust Suppression Systems Industry Revenue Share (%), by Chemical Type 2025 & 2033
- Figure 6: Asia Pacific Dust Suppression Systems Industry Volume Share (%), by Chemical Type 2025 & 2033
- Figure 7: Asia Pacific Dust Suppression Systems Industry Revenue (Million), by System Type 2025 & 2033
- Figure 8: Asia Pacific Dust Suppression Systems Industry Volume (Billion), by System Type 2025 & 2033
- Figure 9: Asia Pacific Dust Suppression Systems Industry Revenue Share (%), by System Type 2025 & 2033
- Figure 10: Asia Pacific Dust Suppression Systems Industry Volume Share (%), by System Type 2025 & 2033
- Figure 11: Asia Pacific Dust Suppression Systems Industry Revenue (Million), by End-user Industry 2025 & 2033
- Figure 12: Asia Pacific Dust Suppression Systems Industry Volume (Billion), by End-user Industry 2025 & 2033
- Figure 13: Asia Pacific Dust Suppression Systems Industry Revenue Share (%), by End-user Industry 2025 & 2033
- Figure 14: Asia Pacific Dust Suppression Systems Industry Volume Share (%), by End-user Industry 2025 & 2033
- Figure 15: Asia Pacific Dust Suppression Systems Industry Revenue (Million), by Country 2025 & 2033
- Figure 16: Asia Pacific Dust Suppression Systems Industry Volume (Billion), by Country 2025 & 2033
- Figure 17: Asia Pacific Dust Suppression Systems Industry Revenue Share (%), by Country 2025 & 2033
- Figure 18: Asia Pacific Dust Suppression Systems Industry Volume Share (%), by Country 2025 & 2033
- Figure 19: North America Dust Suppression Systems Industry Revenue (Million), by Chemical Type 2025 & 2033
- Figure 20: North America Dust Suppression Systems Industry Volume (Billion), by Chemical Type 2025 & 2033
- Figure 21: North America Dust Suppression Systems Industry Revenue Share (%), by Chemical Type 2025 & 2033
- Figure 22: North America Dust Suppression Systems Industry Volume Share (%), by Chemical Type 2025 & 2033
- Figure 23: North America Dust Suppression Systems Industry Revenue (Million), by System Type 2025 & 2033
- Figure 24: North America Dust Suppression Systems Industry Volume (Billion), by System Type 2025 & 2033
- Figure 25: North America Dust Suppression Systems Industry Revenue Share (%), by System Type 2025 & 2033
- Figure 26: North America Dust Suppression Systems Industry Volume Share (%), by System Type 2025 & 2033
- Figure 27: North America Dust Suppression Systems Industry Revenue (Million), by End-user Industry 2025 & 2033
- Figure 28: North America Dust Suppression Systems Industry Volume (Billion), by End-user Industry 2025 & 2033
- Figure 29: North America Dust Suppression Systems Industry Revenue Share (%), by End-user Industry 2025 & 2033
- Figure 30: North America Dust Suppression Systems Industry Volume Share (%), by End-user Industry 2025 & 2033
- Figure 31: North America Dust Suppression Systems Industry Revenue (Million), by Country 2025 & 2033
- Figure 32: North America Dust Suppression Systems Industry Volume (Billion), by Country 2025 & 2033
- Figure 33: North America Dust Suppression Systems Industry Revenue Share (%), by Country 2025 & 2033
- Figure 34: North America Dust Suppression Systems Industry Volume Share (%), by Country 2025 & 2033
- Figure 35: Europe Dust Suppression Systems Industry Revenue (Million), by Chemical Type 2025 & 2033
- Figure 36: Europe Dust Suppression Systems Industry Volume (Billion), by Chemical Type 2025 & 2033
- Figure 37: Europe Dust Suppression Systems Industry Revenue Share (%), by Chemical Type 2025 & 2033
- Figure 38: Europe Dust Suppression Systems Industry Volume Share (%), by Chemical Type 2025 & 2033
- Figure 39: Europe Dust Suppression Systems Industry Revenue (Million), by System Type 2025 & 2033
- Figure 40: Europe Dust Suppression Systems Industry Volume (Billion), by System Type 2025 & 2033
- Figure 41: Europe Dust Suppression Systems Industry Revenue Share (%), by System Type 2025 & 2033
- Figure 42: Europe Dust Suppression Systems Industry Volume Share (%), by System Type 2025 & 2033
- Figure 43: Europe Dust Suppression Systems Industry Revenue (Million), by End-user Industry 2025 & 2033
- Figure 44: Europe Dust Suppression Systems Industry Volume (Billion), by End-user Industry 2025 & 2033
- Figure 45: Europe Dust Suppression Systems Industry Revenue Share (%), by End-user Industry 2025 & 2033
- Figure 46: Europe Dust Suppression Systems Industry Volume Share (%), by End-user Industry 2025 & 2033
- Figure 47: Europe Dust Suppression Systems Industry Revenue (Million), by Country 2025 & 2033
- Figure 48: Europe Dust Suppression Systems Industry Volume (Billion), by Country 2025 & 2033
- Figure 49: Europe Dust Suppression Systems Industry Revenue Share (%), by Country 2025 & 2033
- Figure 50: Europe Dust Suppression Systems Industry Volume Share (%), by Country 2025 & 2033
- Figure 51: South America Dust Suppression Systems Industry Revenue (Million), by Chemical Type 2025 & 2033
- Figure 52: South America Dust Suppression Systems Industry Volume (Billion), by Chemical Type 2025 & 2033
- Figure 53: South America Dust Suppression Systems Industry Revenue Share (%), by Chemical Type 2025 & 2033
- Figure 54: South America Dust Suppression Systems Industry Volume Share (%), by Chemical Type 2025 & 2033
- Figure 55: South America Dust Suppression Systems Industry Revenue (Million), by System Type 2025 & 2033
- Figure 56: South America Dust Suppression Systems Industry Volume (Billion), by System Type 2025 & 2033
- Figure 57: South America Dust Suppression Systems Industry Revenue Share (%), by System Type 2025 & 2033
- Figure 58: South America Dust Suppression Systems Industry Volume Share (%), by System Type 2025 & 2033
- Figure 59: South America Dust Suppression Systems Industry Revenue (Million), by End-user Industry 2025 & 2033
- Figure 60: South America Dust Suppression Systems Industry Volume (Billion), by End-user Industry 2025 & 2033
- Figure 61: South America Dust Suppression Systems Industry Revenue Share (%), by End-user Industry 2025 & 2033
- Figure 62: South America Dust Suppression Systems Industry Volume Share (%), by End-user Industry 2025 & 2033
- Figure 63: South America Dust Suppression Systems Industry Revenue (Million), by Country 2025 & 2033
- Figure 64: South America Dust Suppression Systems Industry Volume (Billion), by Country 2025 & 2033
- Figure 65: South America Dust Suppression Systems Industry Revenue Share (%), by Country 2025 & 2033
- Figure 66: South America Dust Suppression Systems Industry Volume Share (%), by Country 2025 & 2033
- Figure 67: Middle East and Africa Dust Suppression Systems Industry Revenue (Million), by Chemical Type 2025 & 2033
- Figure 68: Middle East and Africa Dust Suppression Systems Industry Volume (Billion), by Chemical Type 2025 & 2033
- Figure 69: Middle East and Africa Dust Suppression Systems Industry Revenue Share (%), by Chemical Type 2025 & 2033
- Figure 70: Middle East and Africa Dust Suppression Systems Industry Volume Share (%), by Chemical Type 2025 & 2033
- Figure 71: Middle East and Africa Dust Suppression Systems Industry Revenue (Million), by System Type 2025 & 2033
- Figure 72: Middle East and Africa Dust Suppression Systems Industry Volume (Billion), by System Type 2025 & 2033
- Figure 73: Middle East and Africa Dust Suppression Systems Industry Revenue Share (%), by System Type 2025 & 2033
- Figure 74: Middle East and Africa Dust Suppression Systems Industry Volume Share (%), by System Type 2025 & 2033
- Figure 75: Middle East and Africa Dust Suppression Systems Industry Revenue (Million), by End-user Industry 2025 & 2033
- Figure 76: Middle East and Africa Dust Suppression Systems Industry Volume (Billion), by End-user Industry 2025 & 2033
- Figure 77: Middle East and Africa Dust Suppression Systems Industry Revenue Share (%), by End-user Industry 2025 & 2033
- Figure 78: Middle East and Africa Dust Suppression Systems Industry Volume Share (%), by End-user Industry 2025 & 2033
- Figure 79: Middle East and Africa Dust Suppression Systems Industry Revenue (Million), by Country 2025 & 2033
- Figure 80: Middle East and Africa Dust Suppression Systems Industry Volume (Billion), by Country 2025 & 2033
- Figure 81: Middle East and Africa Dust Suppression Systems Industry Revenue Share (%), by Country 2025 & 2033
- Figure 82: Middle East and Africa Dust Suppression Systems Industry Volume Share (%), by Country 2025 & 2033
List of Tables
- Table 1: Global Dust Suppression Systems Industry Revenue Million Forecast, by Chemical Type 2020 & 2033
- Table 2: Global Dust Suppression Systems Industry Volume Billion Forecast, by Chemical Type 2020 & 2033
- Table 3: Global Dust Suppression Systems Industry Revenue Million Forecast, by System Type 2020 & 2033
- Table 4: Global Dust Suppression Systems Industry Volume Billion Forecast, by System Type 2020 & 2033
- Table 5: Global Dust Suppression Systems Industry Revenue Million Forecast, by End-user Industry 2020 & 2033
- Table 6: Global Dust Suppression Systems Industry Volume Billion Forecast, by End-user Industry 2020 & 2033
- Table 7: Global Dust Suppression Systems Industry Revenue Million Forecast, by Region 2020 & 2033
- Table 8: Global Dust Suppression Systems Industry Volume Billion Forecast, by Region 2020 & 2033
- Table 9: Global Dust Suppression Systems Industry Revenue Million Forecast, by Chemical Type 2020 & 2033
- Table 10: Global Dust Suppression Systems Industry Volume Billion Forecast, by Chemical Type 2020 & 2033
- Table 11: Global Dust Suppression Systems Industry Revenue Million Forecast, by System Type 2020 & 2033
- Table 12: Global Dust Suppression Systems Industry Volume Billion Forecast, by System Type 2020 & 2033
- Table 13: Global Dust Suppression Systems Industry Revenue Million Forecast, by End-user Industry 2020 & 2033
- Table 14: Global Dust Suppression Systems Industry Volume Billion Forecast, by End-user Industry 2020 & 2033
- Table 15: Global Dust Suppression Systems Industry Revenue Million Forecast, by Country 2020 & 2033
- Table 16: Global Dust Suppression Systems Industry Volume Billion Forecast, by Country 2020 & 2033
- Table 17: China Dust Suppression Systems Industry Revenue (Million) Forecast, by Application 2020 & 2033
- Table 18: China Dust Suppression Systems Industry Volume (Billion) Forecast, by Application 2020 & 2033
- Table 19: India Dust Suppression Systems Industry Revenue (Million) Forecast, by Application 2020 & 2033
- Table 20: India Dust Suppression Systems Industry Volume (Billion) Forecast, by Application 2020 & 2033
- Table 21: Japan Dust Suppression Systems Industry Revenue (Million) Forecast, by Application 2020 & 2033
- Table 22: Japan Dust Suppression Systems Industry Volume (Billion) Forecast, by Application 2020 & 2033
- Table 23: South Korea Dust Suppression Systems Industry Revenue (Million) Forecast, by Application 2020 & 2033
- Table 24: South Korea Dust Suppression Systems Industry Volume (Billion) Forecast, by Application 2020 & 2033
- Table 25: Malaysia Dust Suppression Systems Industry Revenue (Million) Forecast, by Application 2020 & 2033
- Table 26: Malaysia Dust Suppression Systems Industry Volume (Billion) Forecast, by Application 2020 & 2033
- Table 27: Thailand Dust Suppression Systems Industry Revenue (Million) Forecast, by Application 2020 & 2033
- Table 28: Thailand Dust Suppression Systems Industry Volume (Billion) Forecast, by Application 2020 & 2033
- Table 29: Indonesia Dust Suppression Systems Industry Revenue (Million) Forecast, by Application 2020 & 2033
- Table 30: Indonesia Dust Suppression Systems Industry Volume (Billion) Forecast, by Application 2020 & 2033
- Table 31: Vietnam Dust Suppression Systems Industry Revenue (Million) Forecast, by Application 2020 & 2033
- Table 32: Vietnam Dust Suppression Systems Industry Volume (Billion) Forecast, by Application 2020 & 2033
- Table 33: Rest of Asia Pacific Dust Suppression Systems Industry Revenue (Million) Forecast, by Application 2020 & 2033
- Table 34: Rest of Asia Pacific Dust Suppression Systems Industry Volume (Billion) Forecast, by Application 2020 & 2033
- Table 35: Global Dust Suppression Systems Industry Revenue Million Forecast, by Chemical Type 2020 & 2033
- Table 36: Global Dust Suppression Systems Industry Volume Billion Forecast, by Chemical Type 2020 & 2033
- Table 37: Global Dust Suppression Systems Industry Revenue Million Forecast, by System Type 2020 & 2033
- Table 38: Global Dust Suppression Systems Industry Volume Billion Forecast, by System Type 2020 & 2033
- Table 39: Global Dust Suppression Systems Industry Revenue Million Forecast, by End-user Industry 2020 & 2033
- Table 40: Global Dust Suppression Systems Industry Volume Billion Forecast, by End-user Industry 2020 & 2033
- Table 41: Global Dust Suppression Systems Industry Revenue Million Forecast, by Country 2020 & 2033
- Table 42: Global Dust Suppression Systems Industry Volume Billion Forecast, by Country 2020 & 2033
- Table 43: United States Dust Suppression Systems Industry Revenue (Million) Forecast, by Application 2020 & 2033
- Table 44: United States Dust Suppression Systems Industry Volume (Billion) Forecast, by Application 2020 & 2033
- Table 45: Canada Dust Suppression Systems Industry Revenue (Million) Forecast, by Application 2020 & 2033
- Table 46: Canada Dust Suppression Systems Industry Volume (Billion) Forecast, by Application 2020 & 2033
- Table 47: Mexico Dust Suppression Systems Industry Revenue (Million) Forecast, by Application 2020 & 2033
- Table 48: Mexico Dust Suppression Systems Industry Volume (Billion) Forecast, by Application 2020 & 2033
- Table 49: Global Dust Suppression Systems Industry Revenue Million Forecast, by Chemical Type 2020 & 2033
- Table 50: Global Dust Suppression Systems Industry Volume Billion Forecast, by Chemical Type 2020 & 2033
- Table 51: Global Dust Suppression Systems Industry Revenue Million Forecast, by System Type 2020 & 2033
- Table 52: Global Dust Suppression Systems Industry Volume Billion Forecast, by System Type 2020 & 2033
- Table 53: Global Dust Suppression Systems Industry Revenue Million Forecast, by End-user Industry 2020 & 2033
- Table 54: Global Dust Suppression Systems Industry Volume Billion Forecast, by End-user Industry 2020 & 2033
- Table 55: Global Dust Suppression Systems Industry Revenue Million Forecast, by Country 2020 & 2033
- Table 56: Global Dust Suppression Systems Industry Volume Billion Forecast, by Country 2020 & 2033
- Table 57: Germany Dust Suppression Systems Industry Revenue (Million) Forecast, by Application 2020 & 2033
- Table 58: Germany Dust Suppression Systems Industry Volume (Billion) Forecast, by Application 2020 & 2033
- Table 59: United Kingdom Dust Suppression Systems Industry Revenue (Million) Forecast, by Application 2020 & 2033
- Table 60: United Kingdom Dust Suppression Systems Industry Volume (Billion) Forecast, by Application 2020 & 2033
- Table 61: Italy Dust Suppression Systems Industry Revenue (Million) Forecast, by Application 2020 & 2033
- Table 62: Italy Dust Suppression Systems Industry Volume (Billion) Forecast, by Application 2020 & 2033
- Table 63: France Dust Suppression Systems Industry Revenue (Million) Forecast, by Application 2020 & 2033
- Table 64: France Dust Suppression Systems Industry Volume (Billion) Forecast, by Application 2020 & 2033
- Table 65: Italy Dust Suppression Systems Industry Revenue (Million) Forecast, by Application 2020 & 2033
- Table 66: Italy Dust Suppression Systems Industry Volume (Billion) Forecast, by Application 2020 & 2033
- Table 67: Spain Dust Suppression Systems Industry Revenue (Million) Forecast, by Application 2020 & 2033
- Table 68: Spain Dust Suppression Systems Industry Volume (Billion) Forecast, by Application 2020 & 2033
- Table 69: Nordic Countries Dust Suppression Systems Industry Revenue (Million) Forecast, by Application 2020 & 2033
- Table 70: Nordic Countries Dust Suppression Systems Industry Volume (Billion) Forecast, by Application 2020 & 2033
- Table 71: Turkey Dust Suppression Systems Industry Revenue (Million) Forecast, by Application 2020 & 2033
- Table 72: Turkey Dust Suppression Systems Industry Volume (Billion) Forecast, by Application 2020 & 2033
- Table 73: Russia Dust Suppression Systems Industry Revenue (Million) Forecast, by Application 2020 & 2033
- Table 74: Russia Dust Suppression Systems Industry Volume (Billion) Forecast, by Application 2020 & 2033
- Table 75: Rest of Europe Dust Suppression Systems Industry Revenue (Million) Forecast, by Application 2020 & 2033
- Table 76: Rest of Europe Dust Suppression Systems Industry Volume (Billion) Forecast, by Application 2020 & 2033
- Table 77: Global Dust Suppression Systems Industry Revenue Million Forecast, by Chemical Type 2020 & 2033
- Table 78: Global Dust Suppression Systems Industry Volume Billion Forecast, by Chemical Type 2020 & 2033
- Table 79: Global Dust Suppression Systems Industry Revenue Million Forecast, by System Type 2020 & 2033
- Table 80: Global Dust Suppression Systems Industry Volume Billion Forecast, by System Type 2020 & 2033
- Table 81: Global Dust Suppression Systems Industry Revenue Million Forecast, by End-user Industry 2020 & 2033
- Table 82: Global Dust Suppression Systems Industry Volume Billion Forecast, by End-user Industry 2020 & 2033
- Table 83: Global Dust Suppression Systems Industry Revenue Million Forecast, by Country 2020 & 2033
- Table 84: Global Dust Suppression Systems Industry Volume Billion Forecast, by Country 2020 & 2033
- Table 85: Brazil Dust Suppression Systems Industry Revenue (Million) Forecast, by Application 2020 & 2033
- Table 86: Brazil Dust Suppression Systems Industry Volume (Billion) Forecast, by Application 2020 & 2033
- Table 87: Argentina Dust Suppression Systems Industry Revenue (Million) Forecast, by Application 2020 & 2033
- Table 88: Argentina Dust Suppression Systems Industry Volume (Billion) Forecast, by Application 2020 & 2033
- Table 89: Colombia Dust Suppression Systems Industry Revenue (Million) Forecast, by Application 2020 & 2033
- Table 90: Colombia Dust Suppression Systems Industry Volume (Billion) Forecast, by Application 2020 & 2033
- Table 91: Rest of South America Dust Suppression Systems Industry Revenue (Million) Forecast, by Application 2020 & 2033
- Table 92: Rest of South America Dust Suppression Systems Industry Volume (Billion) Forecast, by Application 2020 & 2033
- Table 93: Global Dust Suppression Systems Industry Revenue Million Forecast, by Chemical Type 2020 & 2033
- Table 94: Global Dust Suppression Systems Industry Volume Billion Forecast, by Chemical Type 2020 & 2033
- Table 95: Global Dust Suppression Systems Industry Revenue Million Forecast, by System Type 2020 & 2033
- Table 96: Global Dust Suppression Systems Industry Volume Billion Forecast, by System Type 2020 & 2033
- Table 97: Global Dust Suppression Systems Industry Revenue Million Forecast, by End-user Industry 2020 & 2033
- Table 98: Global Dust Suppression Systems Industry Volume Billion Forecast, by End-user Industry 2020 & 2033
- Table 99: Global Dust Suppression Systems Industry Revenue Million Forecast, by Country 2020 & 2033
- Table 100: Global Dust Suppression Systems Industry Volume Billion Forecast, by Country 2020 & 2033
- Table 101: Saudi Arabia Dust Suppression Systems Industry Revenue (Million) Forecast, by Application 2020 & 2033
- Table 102: Saudi Arabia Dust Suppression Systems Industry Volume (Billion) Forecast, by Application 2020 & 2033
- Table 103: Qatar Dust Suppression Systems Industry Revenue (Million) Forecast, by Application 2020 & 2033
- Table 104: Qatar Dust Suppression Systems Industry Volume (Billion) Forecast, by Application 2020 & 2033
- Table 105: United Arab Emirates Dust Suppression Systems Industry Revenue (Million) Forecast, by Application 2020 & 2033
- Table 106: United Arab Emirates Dust Suppression Systems Industry Volume (Billion) Forecast, by Application 2020 & 2033
- Table 107: Nigeria Dust Suppression Systems Industry Revenue (Million) Forecast, by Application 2020 & 2033
- Table 108: Nigeria Dust Suppression Systems Industry Volume (Billion) Forecast, by Application 2020 & 2033
- Table 109: Egypt Dust Suppression Systems Industry Revenue (Million) Forecast, by Application 2020 & 2033
- Table 110: Egypt Dust Suppression Systems Industry Volume (Billion) Forecast, by Application 2020 & 2033
- Table 111: South Africa Dust Suppression Systems Industry Revenue (Million) Forecast, by Application 2020 & 2033
- Table 112: South Africa Dust Suppression Systems Industry Volume (Billion) Forecast, by Application 2020 & 2033
- Table 113: Rest of Middle East and Africa Dust Suppression Systems Industry Revenue (Million) Forecast, by Application 2020 & 2033
- Table 114: Rest of Middle East and Africa Dust Suppression Systems Industry Volume (Billion) Forecast, by Application 2020 & 2033
Frequently Asked Questions
1. What is the projected Compound Annual Growth Rate (CAGR) of the Dust Suppression Systems Industry?
The projected CAGR is approximately 4.73%.
2. Which companies are prominent players in the Dust Suppression Systems Industry?
Key companies in the market include Chemical Providers, 1 ADM, 2 Benetech Inc, 3 Borregaard, 4 Cargill Incorporated, 5 Chemtex Speciality Limited, 6 Evonik Industries AG, 7 GelTech Solutions, 8 Hexion, 9 Quaker Houghton (Quaker Chemical Corporation), 10 Shaw Almex Industries Ltd, 11 SUEZ, 12 Ecolab, System Providers, 1 BossTek, 2 Camfil, 3 CW Machine Worx, 4 Donaldson Company Inc, 5 DSH Systems Ltd, 6 Duztech AB, 7 Nederman Holding AB, 8 SLY Inc, 9 The ACT Group*List Not Exhaustive.
3. What are the main segments of the Dust Suppression Systems Industry?
The market segments include Chemical Type, System Type, End-user Industry.
4. Can you provide details about the market size?
The market size is estimated to be USD 14.44 Million as of 2022.
5. What are some drivers contributing to market growth?
Growth in Construction and Infrastructure in Asia-Pacific; Increase in Regulatory Compliances; Other Drivers.
6. What are the notable trends driving market growth?
Construction Industry to Dominate the Market.
7. Are there any restraints impacting market growth?
Growth in Construction and Infrastructure in Asia-Pacific; Increase in Regulatory Compliances; Other Drivers.
8. Can you provide examples of recent developments in the market?
March 2024: Camfil Air Pollution Control (APC) has unveiled its newest offering, the Gold Series Timer (GST), an innovative-edge dust collection controller. The GST serves as a straightforward yet powerful tool for managing pulse-jet cleaning in various industrial dust collection systems, such as baghouses. With its state-of-the-art design, the GST provides an intuitive and easily implementable solution for pulse-jet cleaning in industrial dust collection systems.February 2023: BOSSTEK, renowned for its portable dust-suppression equipment, has unveiled the DustBoss DB-45 Surge, the newest addition to its acclaimed Surge line. This innovative-edge technology features an innovative pressurized center nozzle, complemented by the OEM's trusted fan and misting ring system, empowering users to effectively manage dust, regardless of weather conditions.
9. What pricing options are available for accessing the report?
Pricing options include single-user, multi-user, and enterprise licenses priced at USD 4750, USD 5250, and USD 8750 respectively.
10. Is the market size provided in terms of value or volume?
The market size is provided in terms of value, measured in Million and volume, measured in Billion.
11. Are there any specific market keywords associated with the report?
Yes, the market keyword associated with the report is "Dust Suppression Systems Industry," which aids in identifying and referencing the specific market segment covered.
12. How do I determine which pricing option suits my needs best?
The pricing options vary based on user requirements and access needs. Individual users may opt for single-user licenses, while businesses requiring broader access may choose multi-user or enterprise licenses for cost-effective access to the report.
13. Are there any additional resources or data provided in the Dust Suppression Systems Industry report?
While the report offers comprehensive insights, it's advisable to review the specific contents or supplementary materials provided to ascertain if additional resources or data are available.
14. How can I stay updated on further developments or reports in the Dust Suppression Systems Industry?
To stay informed about further developments, trends, and reports in the Dust Suppression Systems Industry, consider subscribing to industry newsletters, following relevant companies and organizations, or regularly checking reputable industry news sources and publications.
Methodology
Step 1 - Identification of Relevant Samples Size from Population Database


Step 2 - Approaches for Defining Global Market Size (Value, Volume* & Price*)

Note*: In applicable scenarios
Step 3 - Data Sources
Primary Research
- Web Analytics
- Survey Reports
- Research Institute
- Latest Research Reports
- Opinion Leaders
Secondary Research
- Annual Reports
- White Paper
- Latest Press Release
- Industry Association
- Paid Database
- Investor Presentations

Step 4 - Data Triangulation
Involves using different sources of information in order to increase the validity of a study
These sources are likely to be stakeholders in a program - participants, other researchers, program staff, other community members, and so on.
Then we put all data in single framework & apply various statistical tools to find out the dynamic on the market.
During the analysis stage, feedback from the stakeholder groups would be compared to determine areas of agreement as well as areas of divergence