

Key Insights
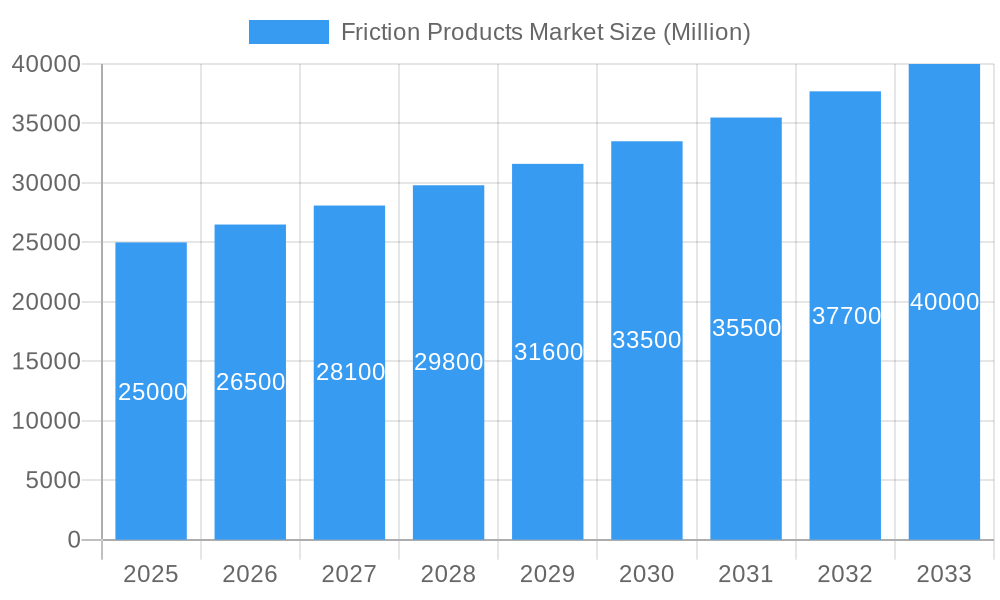
The global friction products market is experiencing robust growth, projected to maintain a Compound Annual Growth Rate (CAGR) exceeding 6.00% from 2025 to 2033. This expansion is fueled by several key drivers. The automotive industry, a major consumer of friction products, is witnessing significant growth, particularly in developing economies like India and China, driving demand for brake pads, discs, and linings. The increasing adoption of advanced driver-assistance systems (ADAS) and the rising popularity of electric vehicles (EVs), while presenting some material-specific challenges, also contribute to overall market expansion. Furthermore, growth in other sectors such as railway, aerospace, and mining, where durable and high-performance friction materials are crucial, is adding to market momentum. The market is segmented by application (clutch and brake systems, gear tooth systems, and others), end-user industry (automotive, railway, aerospace, mining, and others), type (discs, pads, blocks, linings, and others), and material (ceramic, asbestos, semi-metallic, sintered metals, aramid fibers, and others). The Asia Pacific region, particularly China and India, is expected to dominate the market due to substantial automotive production and infrastructure development. While the increasing use of alternative materials and stringent environmental regulations present challenges, continuous innovation in friction material technology is mitigating these restraints.
Friction Products Market Market Size (In Billion)
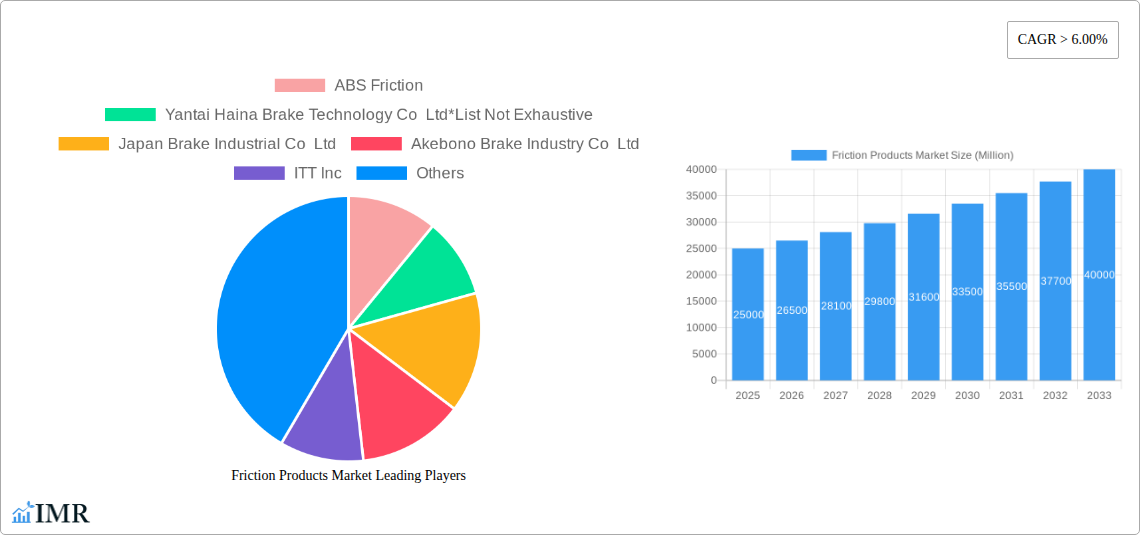
The competitive landscape is characterized by a mix of established global players and regional manufacturers. Companies such as Akebono Brake Industry Co Ltd, Brembo SpA, and Tenneco Inc are leading the market through their technological advancements and global reach. However, the emergence of new players, especially in the Asia-Pacific region, is creating a dynamic competitive environment. Future growth will depend on factors such as technological advancements leading to improved friction material performance, the successful integration of sustainable materials, and the ability of manufacturers to adapt to changing regulatory landscapes concerning environmental concerns and safety standards. The market is expected to witness further consolidation through mergers and acquisitions, as companies strive to gain a larger market share and expand their product portfolios. Specific material segments like ceramic and sintered metals are anticipated to experience higher growth rates than others due to their superior performance characteristics.
Friction Products Market Company Market Share
Friction Products Market: A Comprehensive Market Report (2019-2033)
This in-depth report provides a comprehensive analysis of the Friction Products Market, encompassing market dynamics, growth trends, regional dominance, product landscape, key players, and future outlook. The study covers the period from 2019 to 2033, with 2025 as the base year and a forecast period spanning 2025-2033. The report segments the market by application (Clutch and Brake Systems, Gear Tooth Systems, Other Applications), end-user industry (Automotive, Railway, Aerospace, Mining, Other End-user Industries), type (Discs, Pads, Blocks, Linings, Other Types), and material (Ceramic, Asbestos, Semi-metallic, Sintered Metals, Aramid Fibers, Other Materials). The total market size in 2025 is estimated at XX Million units.
Friction Products Market Market Dynamics & Structure
The Friction Products Market exhibits a moderately concentrated structure, with a few major players holding significant market share. Technological innovation, particularly in materials science and manufacturing processes, is a key driver, alongside stringent regulatory frameworks concerning safety and environmental impact. Competition from substitute materials and products, particularly in specific niche applications, presents a challenge. The automotive sector remains the dominant end-user, although growing demand from railway and aerospace applications offers substantial growth opportunities. M&A activity within the industry has been moderate in recent years, with approximately xx deals completed between 2019 and 2024, primarily focused on expanding product portfolios and geographic reach.
- Market Concentration: Moderately concentrated, with top 5 players holding approximately xx% market share in 2025.
- Technological Innovation: Focus on developing high-performance, lightweight, and environmentally friendly materials.
- Regulatory Landscape: Stringent safety and environmental regulations impacting material choices and manufacturing processes.
- Substitute Products: Competition from alternative braking and friction technologies impacting market growth in niche segments.
- M&A Activity: xx deals between 2019-2024, primarily driven by expansion and diversification strategies.
- Innovation Barriers: High R&D costs and stringent testing requirements hinder innovation.
Friction Products Market Growth Trends & Insights
The Friction Products Market experienced robust growth during the historical period (2019-2024), driven by rising demand from the automotive industry, particularly in developing economies. The market size is projected to expand at a CAGR of xx% from 2025 to 2033, reaching an estimated XX Million units by 2033. Increased adoption of advanced driver-assistance systems (ADAS) and the growing popularity of electric and hybrid vehicles are further contributing to market expansion. Technological advancements in material science, focusing on improved performance and durability, are also fueling growth. Consumer preferences for enhanced safety and fuel efficiency are impacting demand for higher-performing friction products.
Dominant Regions, Countries, or Segments in Friction Products Market
The Automotive sector dominates the Friction Products market, accounting for approximately xx% of the total market share in 2025. Within this segment, the Asia-Pacific region is projected to be the fastest-growing, driven by robust automotive production in countries like China and India. In terms of material, Semi-metallic materials currently dominate, holding over xx% of the market share, followed by Ceramic and Sintered Metals. However, the demand for environmentally friendly materials such as Ceramic and Aramid Fibers is increasing, leading to significant growth projections in these segments.
- Leading Region: Asia-Pacific, driven by strong automotive production.
- Dominant End-User Industry: Automotive, owing to high volume of vehicle production.
- Leading Material Type: Semi-metallic, due to its cost-effectiveness and performance.
- High Growth Segments: Ceramic and Aramid Fibers due to their environmental benefits and high-performance characteristics.
- Key Drivers: Growing vehicle production, rising adoption of ADAS, and increasing demand for high-performance materials.
Friction Products Market Product Landscape
Recent innovations in friction product technology have focused on enhancing performance, durability, and reducing environmental impact. This includes the development of lightweight materials, improved heat dissipation, and reduced noise levels. Manufacturers are increasingly emphasizing unique selling propositions such as extended lifespan, improved braking performance, and reduced environmental impact. Technological advancements in material science and manufacturing processes are enabling the creation of friction products with superior performance characteristics.
Key Drivers, Barriers & Challenges in Friction Products Market
Key Drivers:
- Rising global vehicle production, particularly in developing economies.
- Increased adoption of advanced driver-assistance systems (ADAS).
- Growing demand for electric and hybrid vehicles.
- Technological advancements in material science.
Key Challenges:
- Fluctuations in raw material prices impacting production costs.
- Stringent environmental regulations limiting the use of certain materials.
- Intense competition from established and emerging players.
- Supply chain disruptions affecting production and delivery.
Emerging Opportunities in Friction Products Market
- Growing demand for friction products in emerging markets.
- Development of innovative materials with improved performance characteristics.
- Increased focus on sustainable and environmentally friendly friction products.
- Expansion into new applications, such as robotics and industrial machinery.
Growth Accelerators in the Friction Products Market Industry
Technological breakthroughs in materials science and manufacturing processes are key growth catalysts. Strategic partnerships and collaborations between manufacturers and automotive OEMs are also driving market expansion. Aggressive market expansion strategies targeting untapped markets and emerging applications are expected to contribute significantly to long-term growth.
Key Players Shaping the Friction Products Market Market
- ABS Friction
- Yantai Haina Brake Technology Co Ltd
- Japan Brake Industrial Co Ltd
- Akebono Brake Industry Co Ltd
- ITT Inc
- ANAND Group
- Miba AG
- Tenneco Inc
- Brembo SpA
- Nisshinbo Holdings Inc
Notable Milestones in Friction Products Market Sector
- 2021: Introduction of a new range of ceramic brake pads by Akebono Brake Industry Co Ltd.
- 2022: Strategic partnership between ABS Friction and a major automotive OEM for the development of new friction materials.
- 2023: Acquisition of a smaller friction products manufacturer by Brembo SpA, expanding its product portfolio. (Further milestones to be added based on available data)
In-Depth Friction Products Market Market Outlook
The Friction Products Market is poised for significant growth in the coming years, driven by technological advancements, increasing demand from various end-user industries, and strategic expansion initiatives by key players. The market presents lucrative opportunities for businesses engaged in the development, manufacturing, and distribution of friction products. Focus on innovation, sustainable materials, and strategic partnerships will be key to success in this dynamic market.
Friction Products Market Segmentation
-
1. Type
- 1.1. Discs
- 1.2. Pads
- 1.3. Blocks
- 1.4. Linings
- 1.5. Other Types
-
2. Material
- 2.1. Ceramic
- 2.2. Asbestos
- 2.3. Semi-metallic
- 2.4. Sintered Metals
- 2.5. Aramid Fibers
- 2.6. Other Materials
-
3. Application
- 3.1. Clutch and Brake Systems
- 3.2. Gear Tooth Systems
- 3.3. Other Applications
-
4. End-user Industry
- 4.1. Automotive
- 4.2. Railway
- 4.3. Aerospace
- 4.4. Mining
- 4.5. Other End-user Industries
Friction Products Market Segmentation By Geography
-
1. Asia Pacific
- 1.1. China
- 1.2. India
- 1.3. Japan
- 1.4. South Korea
- 1.5. Rest of Asia Pacific
-
2. North America
- 2.1. United States
- 2.2. Canada
- 2.3. Mexico
-
3. Europe
- 3.1. Germany
- 3.2. United Kingdom
- 3.3. France
- 3.4. Italy
- 3.5. Rest of Europe
-
4. South America
- 4.1. Brazil
- 4.2. Argentina
- 4.3. Rest of South America
-
5. Middle East and Africa
- 5.1. Saudi Arabia
- 5.2. South Africa
- 5.3. Rest of Middle East and Africa
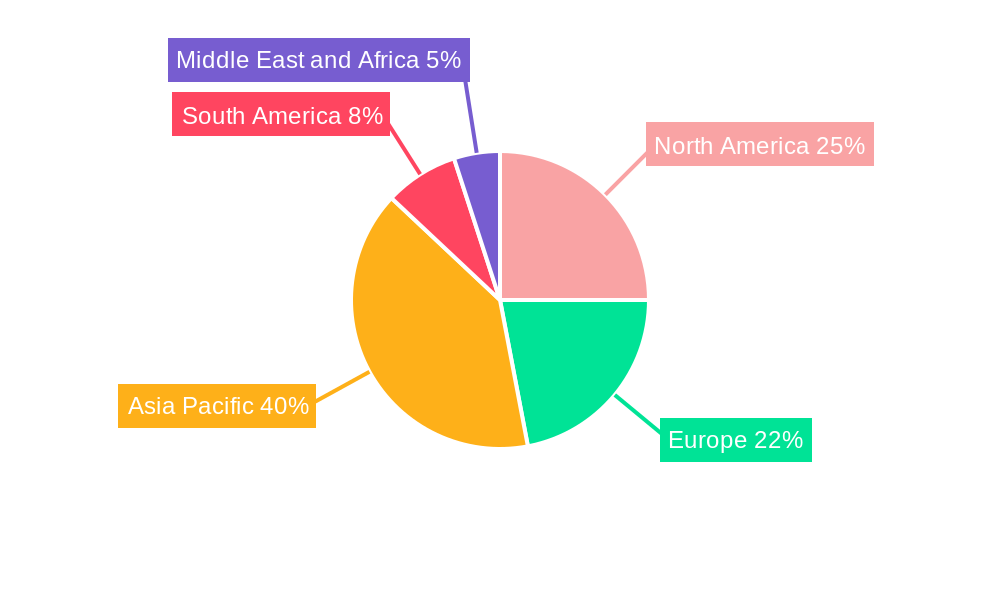
Friction Products Market Regional Market Share
Geographic Coverage of Friction Products Market
Friction Products Market REPORT HIGHLIGHTS
| Aspects | Details |
|---|---|
| Study Period | 2020-2034 |
| Base Year | 2025 |
| Estimated Year | 2026 |
| Forecast Period | 2026-2034 |
| Historical Period | 2020-2025 |
| Growth Rate | CAGR of 2.2% from 2020-2034 |
| Segmentation |
|
Table of Contents
- 1. Introduction
- 1.1. Research Scope
- 1.2. Market Segmentation
- 1.3. Research Objective
- 1.4. Definitions and Assumptions
- 2. Executive Summary
- 2.1. Market Snapshot
- 3. Market Dynamics
- 3.1. Market Drivers
- 3.2. Market Restrains
- 3.3. Market Trends
- 3.4. Market Opportunities
- 4. Market Factor Analysis
- 4.1. Porters Five Forces
- 4.1.1. Bargaining Power of Suppliers
- 4.1.2. Bargaining Power of Buyers
- 4.1.3. Threat of New Entrants
- 4.1.4. Threat of Substitutes
- 4.1.5. Competitive Rivalry
- 4.2. PESTEL analysis
- 4.3. BCG Analysis
- 4.3.1. Stars (High Growth, High Market Share)
- 4.3.2. Cash Cows (Low Growth, High Market Share)
- 4.3.3. Question Mark (High Growth, Low Market Share)
- 4.3.4. Dogs (Low Growth, Low Market Share)
- 4.4. Ansoff Matrix Analysis
- 4.5. Supply Chain Analysis
- 4.6. Regulatory Landscape
- 4.7. Current Market Potential and Opportunity Assessment (TAM–SAM–SOM Framework)
- 4.8. IMR Analyst Note
- 4.1. Porters Five Forces
- 5. Market Analysis, Insights and Forecast 2021-2033
- 5.1. Market Analysis, Insights and Forecast - by Type
- 5.1.1. Discs
- 5.1.2. Pads
- 5.1.3. Blocks
- 5.1.4. Linings
- 5.1.5. Other Types
- 5.2. Market Analysis, Insights and Forecast - by Material
- 5.2.1. Ceramic
- 5.2.2. Asbestos
- 5.2.3. Semi-metallic
- 5.2.4. Sintered Metals
- 5.2.5. Aramid Fibers
- 5.2.6. Other Materials
- 5.3. Market Analysis, Insights and Forecast - by Application
- 5.3.1. Clutch and Brake Systems
- 5.3.2. Gear Tooth Systems
- 5.3.3. Other Applications
- 5.4. Market Analysis, Insights and Forecast - by End-user Industry
- 5.4.1. Automotive
- 5.4.2. Railway
- 5.4.3. Aerospace
- 5.4.4. Mining
- 5.4.5. Other End-user Industries
- 5.5. Market Analysis, Insights and Forecast - by Region
- 5.5.1. Asia Pacific
- 5.5.2. North America
- 5.5.3. Europe
- 5.5.4. South America
- 5.5.5. Middle East and Africa
- 5.1. Market Analysis, Insights and Forecast - by Type
- 6. Global Friction Products Market Analysis, Insights and Forecast, 2021-2033
- 6.1. Market Analysis, Insights and Forecast - by Type
- 6.1.1. Discs
- 6.1.2. Pads
- 6.1.3. Blocks
- 6.1.4. Linings
- 6.1.5. Other Types
- 6.2. Market Analysis, Insights and Forecast - by Material
- 6.2.1. Ceramic
- 6.2.2. Asbestos
- 6.2.3. Semi-metallic
- 6.2.4. Sintered Metals
- 6.2.5. Aramid Fibers
- 6.2.6. Other Materials
- 6.3. Market Analysis, Insights and Forecast - by Application
- 6.3.1. Clutch and Brake Systems
- 6.3.2. Gear Tooth Systems
- 6.3.3. Other Applications
- 6.4. Market Analysis, Insights and Forecast - by End-user Industry
- 6.4.1. Automotive
- 6.4.2. Railway
- 6.4.3. Aerospace
- 6.4.4. Mining
- 6.4.5. Other End-user Industries
- 6.1. Market Analysis, Insights and Forecast - by Type
- 7. Asia Pacific Friction Products Market Analysis, Insights and Forecast, 2020-2032
- 7.1. Market Analysis, Insights and Forecast - by Type
- 7.1.1. Discs
- 7.1.2. Pads
- 7.1.3. Blocks
- 7.1.4. Linings
- 7.1.5. Other Types
- 7.2. Market Analysis, Insights and Forecast - by Material
- 7.2.1. Ceramic
- 7.2.2. Asbestos
- 7.2.3. Semi-metallic
- 7.2.4. Sintered Metals
- 7.2.5. Aramid Fibers
- 7.2.6. Other Materials
- 7.3. Market Analysis, Insights and Forecast - by Application
- 7.3.1. Clutch and Brake Systems
- 7.3.2. Gear Tooth Systems
- 7.3.3. Other Applications
- 7.4. Market Analysis, Insights and Forecast - by End-user Industry
- 7.4.1. Automotive
- 7.4.2. Railway
- 7.4.3. Aerospace
- 7.4.4. Mining
- 7.4.5. Other End-user Industries
- 7.1. Market Analysis, Insights and Forecast - by Type
- 8. North America Friction Products Market Analysis, Insights and Forecast, 2020-2032
- 8.1. Market Analysis, Insights and Forecast - by Type
- 8.1.1. Discs
- 8.1.2. Pads
- 8.1.3. Blocks
- 8.1.4. Linings
- 8.1.5. Other Types
- 8.2. Market Analysis, Insights and Forecast - by Material
- 8.2.1. Ceramic
- 8.2.2. Asbestos
- 8.2.3. Semi-metallic
- 8.2.4. Sintered Metals
- 8.2.5. Aramid Fibers
- 8.2.6. Other Materials
- 8.3. Market Analysis, Insights and Forecast - by Application
- 8.3.1. Clutch and Brake Systems
- 8.3.2. Gear Tooth Systems
- 8.3.3. Other Applications
- 8.4. Market Analysis, Insights and Forecast - by End-user Industry
- 8.4.1. Automotive
- 8.4.2. Railway
- 8.4.3. Aerospace
- 8.4.4. Mining
- 8.4.5. Other End-user Industries
- 8.1. Market Analysis, Insights and Forecast - by Type
- 9. Europe Friction Products Market Analysis, Insights and Forecast, 2020-2032
- 9.1. Market Analysis, Insights and Forecast - by Type
- 9.1.1. Discs
- 9.1.2. Pads
- 9.1.3. Blocks
- 9.1.4. Linings
- 9.1.5. Other Types
- 9.2. Market Analysis, Insights and Forecast - by Material
- 9.2.1. Ceramic
- 9.2.2. Asbestos
- 9.2.3. Semi-metallic
- 9.2.4. Sintered Metals
- 9.2.5. Aramid Fibers
- 9.2.6. Other Materials
- 9.3. Market Analysis, Insights and Forecast - by Application
- 9.3.1. Clutch and Brake Systems
- 9.3.2. Gear Tooth Systems
- 9.3.3. Other Applications
- 9.4. Market Analysis, Insights and Forecast - by End-user Industry
- 9.4.1. Automotive
- 9.4.2. Railway
- 9.4.3. Aerospace
- 9.4.4. Mining
- 9.4.5. Other End-user Industries
- 9.1. Market Analysis, Insights and Forecast - by Type
- 10. South America Friction Products Market Analysis, Insights and Forecast, 2020-2032
- 10.1. Market Analysis, Insights and Forecast - by Type
- 10.1.1. Discs
- 10.1.2. Pads
- 10.1.3. Blocks
- 10.1.4. Linings
- 10.1.5. Other Types
- 10.2. Market Analysis, Insights and Forecast - by Material
- 10.2.1. Ceramic
- 10.2.2. Asbestos
- 10.2.3. Semi-metallic
- 10.2.4. Sintered Metals
- 10.2.5. Aramid Fibers
- 10.2.6. Other Materials
- 10.3. Market Analysis, Insights and Forecast - by Application
- 10.3.1. Clutch and Brake Systems
- 10.3.2. Gear Tooth Systems
- 10.3.3. Other Applications
- 10.4. Market Analysis, Insights and Forecast - by End-user Industry
- 10.4.1. Automotive
- 10.4.2. Railway
- 10.4.3. Aerospace
- 10.4.4. Mining
- 10.4.5. Other End-user Industries
- 10.1. Market Analysis, Insights and Forecast - by Type
- 11. Middle East and Africa Friction Products Market Analysis, Insights and Forecast, 2020-2032
- 11.1. Market Analysis, Insights and Forecast - by Type
- 11.1.1. Discs
- 11.1.2. Pads
- 11.1.3. Blocks
- 11.1.4. Linings
- 11.1.5. Other Types
- 11.2. Market Analysis, Insights and Forecast - by Material
- 11.2.1. Ceramic
- 11.2.2. Asbestos
- 11.2.3. Semi-metallic
- 11.2.4. Sintered Metals
- 11.2.5. Aramid Fibers
- 11.2.6. Other Materials
- 11.3. Market Analysis, Insights and Forecast - by Application
- 11.3.1. Clutch and Brake Systems
- 11.3.2. Gear Tooth Systems
- 11.3.3. Other Applications
- 11.4. Market Analysis, Insights and Forecast - by End-user Industry
- 11.4.1. Automotive
- 11.4.2. Railway
- 11.4.3. Aerospace
- 11.4.4. Mining
- 11.4.5. Other End-user Industries
- 11.1. Market Analysis, Insights and Forecast - by Type
- 12. Competitive Analysis
- 12.1. Company Profiles
- 12.1.1 ABS Friction
- 12.1.1.1. Company Overview
- 12.1.1.2. Products
- 12.1.1.3. Company Financials
- 12.1.1.4. SWOT Analysis
- 12.1.2 Yantai Haina Brake Technology Co Ltd*List Not Exhaustive
- 12.1.2.1. Company Overview
- 12.1.2.2. Products
- 12.1.2.3. Company Financials
- 12.1.2.4. SWOT Analysis
- 12.1.3 Japan Brake Industrial Co Ltd
- 12.1.3.1. Company Overview
- 12.1.3.2. Products
- 12.1.3.3. Company Financials
- 12.1.3.4. SWOT Analysis
- 12.1.4 Akebono Brake Industry Co Ltd
- 12.1.4.1. Company Overview
- 12.1.4.2. Products
- 12.1.4.3. Company Financials
- 12.1.4.4. SWOT Analysis
- 12.1.5 ITT Inc
- 12.1.5.1. Company Overview
- 12.1.5.2. Products
- 12.1.5.3. Company Financials
- 12.1.5.4. SWOT Analysis
- 12.1.6 ANAND Group
- 12.1.6.1. Company Overview
- 12.1.6.2. Products
- 12.1.6.3. Company Financials
- 12.1.6.4. SWOT Analysis
- 12.1.7 Miba AG
- 12.1.7.1. Company Overview
- 12.1.7.2. Products
- 12.1.7.3. Company Financials
- 12.1.7.4. SWOT Analysis
- 12.1.8 Tenneco Inc
- 12.1.8.1. Company Overview
- 12.1.8.2. Products
- 12.1.8.3. Company Financials
- 12.1.8.4. SWOT Analysis
- 12.1.9 Brembo SpA
- 12.1.9.1. Company Overview
- 12.1.9.2. Products
- 12.1.9.3. Company Financials
- 12.1.9.4. SWOT Analysis
- 12.1.10 Nisshinbo Holdings Inc
- 12.1.10.1. Company Overview
- 12.1.10.2. Products
- 12.1.10.3. Company Financials
- 12.1.10.4. SWOT Analysis
- 12.1.1 ABS Friction
- 12.2. Market Entropy
- 12.2.1 Company's Key Areas Served
- 12.2.2 Recent Developments
- 12.3. Company Market Share Analysis 2025
- 12.3.1 Top 5 Companies Market Share Analysis
- 12.3.2 Top 3 Companies Market Share Analysis
- 12.4. List of Potential Customers
- 13. Research Methodology
List of Figures
- Figure 1: Global Friction Products Market Revenue Breakdown (billion, %) by Region 2025 & 2033
- Figure 2: Asia Pacific Friction Products Market Revenue (billion), by Type 2025 & 2033
- Figure 3: Asia Pacific Friction Products Market Revenue Share (%), by Type 2025 & 2033
- Figure 4: Asia Pacific Friction Products Market Revenue (billion), by Material 2025 & 2033
- Figure 5: Asia Pacific Friction Products Market Revenue Share (%), by Material 2025 & 2033
- Figure 6: Asia Pacific Friction Products Market Revenue (billion), by Application 2025 & 2033
- Figure 7: Asia Pacific Friction Products Market Revenue Share (%), by Application 2025 & 2033
- Figure 8: Asia Pacific Friction Products Market Revenue (billion), by End-user Industry 2025 & 2033
- Figure 9: Asia Pacific Friction Products Market Revenue Share (%), by End-user Industry 2025 & 2033
- Figure 10: Asia Pacific Friction Products Market Revenue (billion), by Country 2025 & 2033
- Figure 11: Asia Pacific Friction Products Market Revenue Share (%), by Country 2025 & 2033
- Figure 12: North America Friction Products Market Revenue (billion), by Type 2025 & 2033
- Figure 13: North America Friction Products Market Revenue Share (%), by Type 2025 & 2033
- Figure 14: North America Friction Products Market Revenue (billion), by Material 2025 & 2033
- Figure 15: North America Friction Products Market Revenue Share (%), by Material 2025 & 2033
- Figure 16: North America Friction Products Market Revenue (billion), by Application 2025 & 2033
- Figure 17: North America Friction Products Market Revenue Share (%), by Application 2025 & 2033
- Figure 18: North America Friction Products Market Revenue (billion), by End-user Industry 2025 & 2033
- Figure 19: North America Friction Products Market Revenue Share (%), by End-user Industry 2025 & 2033
- Figure 20: North America Friction Products Market Revenue (billion), by Country 2025 & 2033
- Figure 21: North America Friction Products Market Revenue Share (%), by Country 2025 & 2033
- Figure 22: Europe Friction Products Market Revenue (billion), by Type 2025 & 2033
- Figure 23: Europe Friction Products Market Revenue Share (%), by Type 2025 & 2033
- Figure 24: Europe Friction Products Market Revenue (billion), by Material 2025 & 2033
- Figure 25: Europe Friction Products Market Revenue Share (%), by Material 2025 & 2033
- Figure 26: Europe Friction Products Market Revenue (billion), by Application 2025 & 2033
- Figure 27: Europe Friction Products Market Revenue Share (%), by Application 2025 & 2033
- Figure 28: Europe Friction Products Market Revenue (billion), by End-user Industry 2025 & 2033
- Figure 29: Europe Friction Products Market Revenue Share (%), by End-user Industry 2025 & 2033
- Figure 30: Europe Friction Products Market Revenue (billion), by Country 2025 & 2033
- Figure 31: Europe Friction Products Market Revenue Share (%), by Country 2025 & 2033
- Figure 32: South America Friction Products Market Revenue (billion), by Type 2025 & 2033
- Figure 33: South America Friction Products Market Revenue Share (%), by Type 2025 & 2033
- Figure 34: South America Friction Products Market Revenue (billion), by Material 2025 & 2033
- Figure 35: South America Friction Products Market Revenue Share (%), by Material 2025 & 2033
- Figure 36: South America Friction Products Market Revenue (billion), by Application 2025 & 2033
- Figure 37: South America Friction Products Market Revenue Share (%), by Application 2025 & 2033
- Figure 38: South America Friction Products Market Revenue (billion), by End-user Industry 2025 & 2033
- Figure 39: South America Friction Products Market Revenue Share (%), by End-user Industry 2025 & 2033
- Figure 40: South America Friction Products Market Revenue (billion), by Country 2025 & 2033
- Figure 41: South America Friction Products Market Revenue Share (%), by Country 2025 & 2033
- Figure 42: Middle East and Africa Friction Products Market Revenue (billion), by Type 2025 & 2033
- Figure 43: Middle East and Africa Friction Products Market Revenue Share (%), by Type 2025 & 2033
- Figure 44: Middle East and Africa Friction Products Market Revenue (billion), by Material 2025 & 2033
- Figure 45: Middle East and Africa Friction Products Market Revenue Share (%), by Material 2025 & 2033
- Figure 46: Middle East and Africa Friction Products Market Revenue (billion), by Application 2025 & 2033
- Figure 47: Middle East and Africa Friction Products Market Revenue Share (%), by Application 2025 & 2033
- Figure 48: Middle East and Africa Friction Products Market Revenue (billion), by End-user Industry 2025 & 2033
- Figure 49: Middle East and Africa Friction Products Market Revenue Share (%), by End-user Industry 2025 & 2033
- Figure 50: Middle East and Africa Friction Products Market Revenue (billion), by Country 2025 & 2033
- Figure 51: Middle East and Africa Friction Products Market Revenue Share (%), by Country 2025 & 2033
List of Tables
- Table 1: Global Friction Products Market Revenue billion Forecast, by Type 2020 & 2033
- Table 2: Global Friction Products Market Revenue billion Forecast, by Material 2020 & 2033
- Table 3: Global Friction Products Market Revenue billion Forecast, by Application 2020 & 2033
- Table 4: Global Friction Products Market Revenue billion Forecast, by End-user Industry 2020 & 2033
- Table 5: Global Friction Products Market Revenue billion Forecast, by Region 2020 & 2033
- Table 6: Global Friction Products Market Revenue billion Forecast, by Type 2020 & 2033
- Table 7: Global Friction Products Market Revenue billion Forecast, by Material 2020 & 2033
- Table 8: Global Friction Products Market Revenue billion Forecast, by Application 2020 & 2033
- Table 9: Global Friction Products Market Revenue billion Forecast, by End-user Industry 2020 & 2033
- Table 10: Global Friction Products Market Revenue billion Forecast, by Country 2020 & 2033
- Table 11: China Friction Products Market Revenue (billion) Forecast, by Application 2020 & 2033
- Table 12: India Friction Products Market Revenue (billion) Forecast, by Application 2020 & 2033
- Table 13: Japan Friction Products Market Revenue (billion) Forecast, by Application 2020 & 2033
- Table 14: South Korea Friction Products Market Revenue (billion) Forecast, by Application 2020 & 2033
- Table 15: Rest of Asia Pacific Friction Products Market Revenue (billion) Forecast, by Application 2020 & 2033
- Table 16: Global Friction Products Market Revenue billion Forecast, by Type 2020 & 2033
- Table 17: Global Friction Products Market Revenue billion Forecast, by Material 2020 & 2033
- Table 18: Global Friction Products Market Revenue billion Forecast, by Application 2020 & 2033
- Table 19: Global Friction Products Market Revenue billion Forecast, by End-user Industry 2020 & 2033
- Table 20: Global Friction Products Market Revenue billion Forecast, by Country 2020 & 2033
- Table 21: United States Friction Products Market Revenue (billion) Forecast, by Application 2020 & 2033
- Table 22: Canada Friction Products Market Revenue (billion) Forecast, by Application 2020 & 2033
- Table 23: Mexico Friction Products Market Revenue (billion) Forecast, by Application 2020 & 2033
- Table 24: Global Friction Products Market Revenue billion Forecast, by Type 2020 & 2033
- Table 25: Global Friction Products Market Revenue billion Forecast, by Material 2020 & 2033
- Table 26: Global Friction Products Market Revenue billion Forecast, by Application 2020 & 2033
- Table 27: Global Friction Products Market Revenue billion Forecast, by End-user Industry 2020 & 2033
- Table 28: Global Friction Products Market Revenue billion Forecast, by Country 2020 & 2033
- Table 29: Germany Friction Products Market Revenue (billion) Forecast, by Application 2020 & 2033
- Table 30: United Kingdom Friction Products Market Revenue (billion) Forecast, by Application 2020 & 2033
- Table 31: France Friction Products Market Revenue (billion) Forecast, by Application 2020 & 2033
- Table 32: Italy Friction Products Market Revenue (billion) Forecast, by Application 2020 & 2033
- Table 33: Rest of Europe Friction Products Market Revenue (billion) Forecast, by Application 2020 & 2033
- Table 34: Global Friction Products Market Revenue billion Forecast, by Type 2020 & 2033
- Table 35: Global Friction Products Market Revenue billion Forecast, by Material 2020 & 2033
- Table 36: Global Friction Products Market Revenue billion Forecast, by Application 2020 & 2033
- Table 37: Global Friction Products Market Revenue billion Forecast, by End-user Industry 2020 & 2033
- Table 38: Global Friction Products Market Revenue billion Forecast, by Country 2020 & 2033
- Table 39: Brazil Friction Products Market Revenue (billion) Forecast, by Application 2020 & 2033
- Table 40: Argentina Friction Products Market Revenue (billion) Forecast, by Application 2020 & 2033
- Table 41: Rest of South America Friction Products Market Revenue (billion) Forecast, by Application 2020 & 2033
- Table 42: Global Friction Products Market Revenue billion Forecast, by Type 2020 & 2033
- Table 43: Global Friction Products Market Revenue billion Forecast, by Material 2020 & 2033
- Table 44: Global Friction Products Market Revenue billion Forecast, by Application 2020 & 2033
- Table 45: Global Friction Products Market Revenue billion Forecast, by End-user Industry 2020 & 2033
- Table 46: Global Friction Products Market Revenue billion Forecast, by Country 2020 & 2033
- Table 47: Saudi Arabia Friction Products Market Revenue (billion) Forecast, by Application 2020 & 2033
- Table 48: South Africa Friction Products Market Revenue (billion) Forecast, by Application 2020 & 2033
- Table 49: Rest of Middle East and Africa Friction Products Market Revenue (billion) Forecast, by Application 2020 & 2033
Frequently Asked Questions
1. What is the projected Compound Annual Growth Rate (CAGR) of the Friction Products Market?
The projected CAGR is approximately 2.2%.
2. Which companies are prominent players in the Friction Products Market?
Key companies in the market include ABS Friction, Yantai Haina Brake Technology Co Ltd*List Not Exhaustive, Japan Brake Industrial Co Ltd, Akebono Brake Industry Co Ltd, ITT Inc, ANAND Group, Miba AG, Tenneco Inc, Brembo SpA, Nisshinbo Holdings Inc.
3. What are the main segments of the Friction Products Market?
The market segments include Type, Material, Application, End-user Industry.
4. Can you provide details about the market size?
The market size is estimated to be USD 13.32 billion as of 2022.
5. What are some drivers contributing to market growth?
Growing Need for Industrial Machinery; Other Drivers.
6. What are the notable trends driving market growth?
The Automotive Industry Dominates the Market.
7. Are there any restraints impacting market growth?
High Maintenance and Cost of Friction Materials; Impact of COVID-19 Outbreak; Other Restraints.
8. Can you provide examples of recent developments in the market?
N/A
9. What pricing options are available for accessing the report?
Pricing options include single-user, multi-user, and enterprise licenses priced at USD 4750, USD 5250, and USD 8750 respectively.
10. Is the market size provided in terms of value or volume?
The market size is provided in terms of value, measured in billion.
11. Are there any specific market keywords associated with the report?
Yes, the market keyword associated with the report is "Friction Products Market," which aids in identifying and referencing the specific market segment covered.
12. How do I determine which pricing option suits my needs best?
The pricing options vary based on user requirements and access needs. Individual users may opt for single-user licenses, while businesses requiring broader access may choose multi-user or enterprise licenses for cost-effective access to the report.
13. Are there any additional resources or data provided in the Friction Products Market report?
While the report offers comprehensive insights, it's advisable to review the specific contents or supplementary materials provided to ascertain if additional resources or data are available.
14. How can I stay updated on further developments or reports in the Friction Products Market?
To stay informed about further developments, trends, and reports in the Friction Products Market, consider subscribing to industry newsletters, following relevant companies and organizations, or regularly checking reputable industry news sources and publications.
Methodology
Step 1 - Identification of Relevant Samples Size from Population Database


Step 2 - Approaches for Defining Global Market Size (Value, Volume* & Price*)

Note*: In applicable scenarios
Step 3 - Data Sources
Primary Research
- Web Analytics
- Survey Reports
- Research Institute
- Latest Research Reports
- Opinion Leaders
Secondary Research
- Annual Reports
- White Paper
- Latest Press Release
- Industry Association
- Paid Database
- Investor Presentations

Step 4 - Data Triangulation
Involves using different sources of information in order to increase the validity of a study
These sources are likely to be stakeholders in a program - participants, other researchers, program staff, other community members, and so on.
Then we put all data in single framework & apply various statistical tools to find out the dynamic on the market.
During the analysis stage, feedback from the stakeholder groups would be compared to determine areas of agreement as well as areas of divergence