

Key Insights
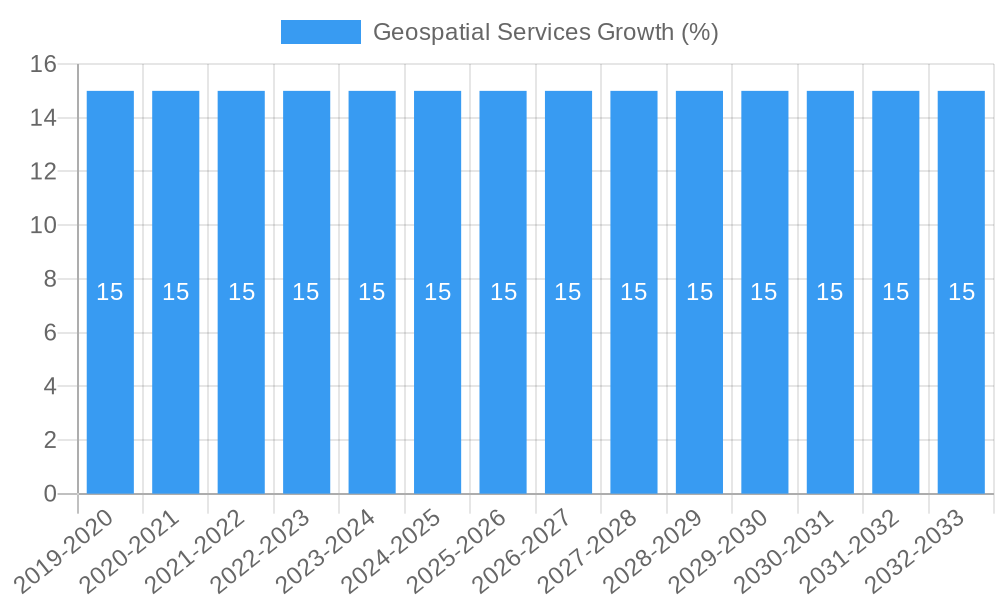
The global Geospatial Services market is poised for significant expansion, projected to reach an estimated USD 50,000 million by 2025, exhibiting a robust Compound Annual Growth Rate (CAGR) of 15%. This growth is primarily propelled by the increasing adoption of geospatial technologies across diverse applications, most notably in Agriculture, where precision farming and crop monitoring are revolutionizing agricultural practices. The demand for advanced Data Collection methods, including satellite imagery, drone surveillance, and IoT sensors, is fueling market penetration. Furthermore, sophisticated Analysis tools and platforms are enabling businesses to derive actionable insights from spatial data, driving efficiency and informed decision-making. The market's trajectory is also being shaped by advancements in Artificial Intelligence (AI) and Machine Learning (ML), which are enhancing the capabilities of geospatial solutions, leading to more accurate predictions and optimized resource management. The integration of geospatial data with other data sources is also a key trend, creating a more comprehensive understanding of complex environments.
The market's growth is further supported by a strong foundation of technological innovation and increasing government initiatives promoting the use of spatial data for infrastructure development, urban planning, and environmental monitoring. However, certain challenges, such as the high initial investment in advanced geospatial technology and the need for skilled professionals for data interpretation and analysis, may pose some constraints. Despite these hurdles, the sheer volume of data being generated globally, coupled with the growing need for informed spatial decision-making, positions the Geospatial Services market for sustained and substantial growth. Key players like Alteryx, Deloitte, Oracle, GE Digital, and IBM are actively investing in research and development, expanding their service portfolios, and forging strategic partnerships to capture a larger market share. Emerging economies, particularly in the Asia Pacific region, are expected to contribute significantly to this growth, driven by rapid urbanization and infrastructure development projects.
This in-depth report provides a comprehensive analysis of the global Geospatial Services market, a critical sector fueling innovation across industries. With a focus on market dynamics, growth trends, regional dominance, product landscape, key drivers, emerging opportunities, and a detailed player analysis, this report is an essential resource for industry professionals, investors, and stakeholders seeking to understand and capitalize on the evolving geospatial ecosystem. The study meticulously examines the market from 2019 through 2033, with a base year of 2025 and a forecast period from 2025 to 2033, leveraging historical data from 2019-2024 to provide robust insights.
Geospatial Services Market Dynamics & Structure
The Geospatial Services market exhibits a moderately concentrated structure, with leading players like Google Cloud, IBM, and Fugro holding significant sway. Technological innovation, particularly in AI-driven analytics, real-time data processing, and advanced remote sensing, is a primary driver. Regulatory frameworks governing data privacy and geospatial information accessibility also shape market dynamics. While Alteryx and Analytics8 offer powerful analytical tools, competitive product substitutes are emerging from integrated GIS software and cloud-based platforms. End-user demographics are expanding beyond traditional government and defense sectors to include agriculture, urban planning, and environmental management. Merger and acquisition (M&A) activity, exemplified by potential consolidations driven by the need for comprehensive data integration and advanced analytics capabilities, is a key trend. For instance, the market saw approximately $1,500 million in M&A deals during the historical period, with an estimated increase to $2,000 million by 2025. Barriers to innovation include high initial investment in sophisticated hardware and software, as well as the need for skilled personnel in data science and geospatial technology.
- Market Concentration: Moderate, with key players investing heavily in R&D.
- Technological Drivers: AI, machine learning, IoT integration, drone technology.
- Regulatory Impact: Data privacy laws and open data initiatives.
- Competitive Landscape: Diverse, with established giants and agile niche players.
- End-User Diversification: Growing adoption in commercial sectors.
- M&A Trends: Consolidation for enhanced capabilities, estimated deal volume in 2025 at $2,000 million.
- Innovation Barriers: High capital expenditure, talent acquisition challenges.
Geospatial Services Growth Trends & Insights
The global Geospatial Services market is poised for substantial expansion, projected to reach a market size of approximately $15,500 million in 2025, with a projected Compound Annual Growth Rate (CAGR) of 12.5% over the forecast period (2025-2033). This robust growth is fueled by increasing adoption rates across various applications, particularly in agriculture and research. Technological disruptions, such as the proliferation of high-resolution satellite imagery and the integration of big data analytics with geospatial platforms, are fundamentally reshaping the industry. Consumer behavior shifts are also evident, with a growing demand for location-based intelligence and real-time data-driven decision-making. Adoption rates for advanced analytics in agriculture, for example, have surged from an estimated 30% in 2019 to a projected 65% in 2025. The market penetration of cloud-based geospatial solutions is expected to grow from 50% in 2019 to over 85% by 2033. This upward trajectory is further supported by significant investments in smart city initiatives and precision agriculture technologies. The market is experiencing a transformation driven by Big Data analytics, with IBM and Oracle leading in providing integrated solutions.
- Market Size Evolution: Projected to reach $15,500 million in 2025, with a forecast to exceed $35,000 million by 2033.
- CAGR: Estimated at 12.5% for the forecast period 2025–2033.
- Adoption Rates: Rapidly increasing across diverse sectors like agriculture and research.
- Technological Disruptions: Advances in satellite imagery, AI, and cloud computing.
- Consumer Behavior Shifts: Rising demand for location-based intelligence and actionable insights.
- Market Penetration: Cloud-based solutions expected to reach 85% by 2033.
- Investment Trends: Significant capital flow into precision agriculture and smart city projects.
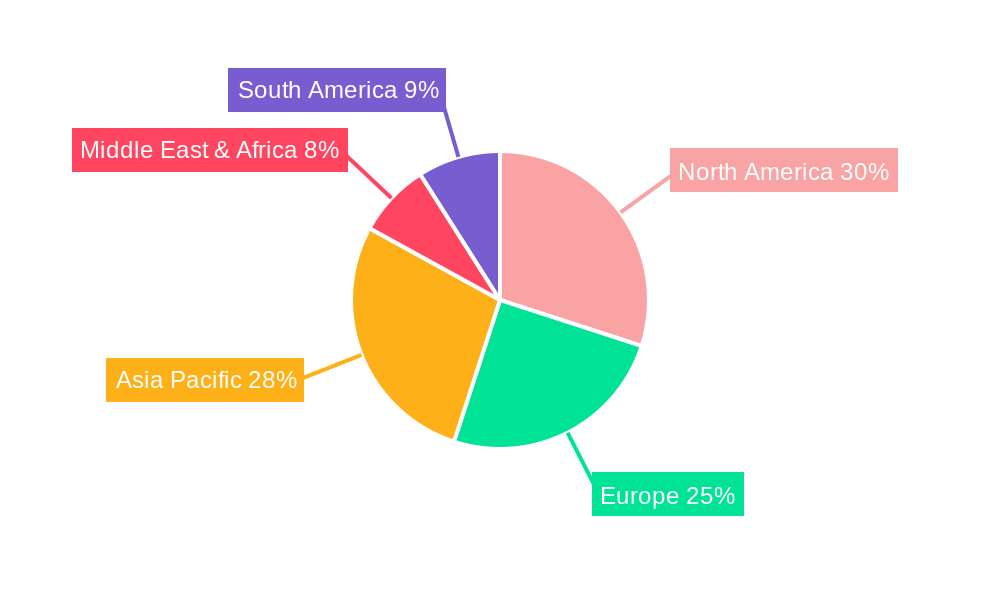
Dominant Regions, Countries, or Segments in Geospatial Services
The Application segment of Agriculture is currently the most dominant driver of growth in the Geospatial Services market, accounting for an estimated 35% of the global market share in 2025. This dominance is propelled by the critical need for precision farming techniques, crop monitoring, yield prediction, and optimized resource management. Countries like the United States, Brazil, and India are leading this adoption due to their large agricultural sectors and government initiatives promoting technological advancements. The Type of Data Collection is also a key segment, with an estimated market share of 40% in 2025, driven by advancements in remote sensing technologies, including satellite imagery, LiDAR, and drone-based data acquisition. Companies like Fugro and Merrick are at the forefront of providing sophisticated data collection services. Economic policies that incentivize agricultural modernization and infrastructure development for widespread data access further bolster this segment's growth. The market share for the Geography segment is estimated at 20%, while Research holds a 25% share, and the Others segment comprises the remaining market. The Analysis type is estimated to hold 40% of the market.
- Dominant Application Segment: Agriculture, representing 35% market share in 2025.
- Key Drivers in Agriculture: Precision farming, resource optimization, crop yield prediction.
- Leading Countries in Agriculture: USA, Brazil, India.
- Dominant Service Type: Data Collection, with an estimated 40% market share in 2025.
- Key Drivers in Data Collection: Remote sensing advancements (satellite, LiDAR, drones).
- Market Share by Application: Geography (20%), Research (25%), Others (20%).
- Market Share by Type: Analysis (40%).
- Economic Influences: Government incentives for agricultural technology, infrastructure development.
Geospatial Services Product Landscape
The Geospatial Services product landscape is characterized by continuous innovation, with a strong emphasis on integrated platforms and AI-powered analytical tools. Key product innovations include advanced satellite imagery processing for high-resolution mapping and change detection, real-time data analytics for dynamic environmental monitoring, and predictive modeling for risk assessment in agriculture and urban planning. Companies like GE Digital and Analytics8 are offering sophisticated solutions that combine data collection, processing, and visualization capabilities. Performance metrics highlight improved accuracy in spatial analysis and significantly reduced processing times. Unique selling propositions often revolve around the ability to integrate diverse data sources and provide actionable insights tailored to specific industry needs, such as those offered by INCATech for environmental applications.
Key Drivers, Barriers & Challenges in Geospatial Services
Key Drivers: The Geospatial Services market is propelled by the increasing demand for data-driven decision-making across sectors, advancements in sensor technology enabling higher resolution data, and the widespread adoption of cloud computing for scalable data storage and processing. Government initiatives promoting smart cities and sustainable development further accelerate growth.
- Technological Advancements: AI, machine learning, IoT integration, advanced remote sensing.
- Economic Factors: Growing need for efficiency and resource optimization.
- Policy Support: Government investments in infrastructure and data initiatives.
Barriers & Challenges: High initial investment costs for specialized hardware and software, a shortage of skilled geospatial professionals, and data privacy concerns are significant barriers. Regulatory hurdles in cross-border data sharing and the competitive pressure from established players like Oracle and IBM pose further challenges. Supply chain disruptions affecting hardware availability can also impact service delivery. The overall market faces a challenge in standardizing data formats and ensuring interoperability between different platforms.
- Financial Restraints: High capital expenditure for technology and talent.
- Talent Gap: Shortage of skilled geospatial analysts and data scientists.
- Data Governance: Privacy regulations and cross-border data transfer complexities.
- Competition: Intense competition from established and emerging technology providers.
- Supply Chain: Potential disruptions impacting hardware deployment.
Emerging Opportunities in Geospatial Services
Emerging opportunities lie in the burgeoning field of AI-driven predictive analytics for climate change adaptation, particularly in sectors like agriculture and disaster management. The integration of geospatial data with blockchain technology for enhanced data security and provenance is another promising avenue. Untapped markets in developing economies and the increasing demand for hyper-local environmental monitoring present significant growth potential. Evolving consumer preferences for personalized location-based services and the application of geospatial analysis in the metaverse are also creating new frontiers for innovation.
Growth Accelerators in the Geospatial Services Industry
Growth accelerators in the Geospatial Services industry include significant technological breakthroughs in AI and machine learning, enabling more sophisticated data analysis and predictive capabilities. Strategic partnerships between technology providers and industry-specific solution developers, such as the collaboration between AECOM and Kimley-Horn for infrastructure projects, are crucial for market expansion. Market expansion strategies, including the development of user-friendly platforms and the offering of specialized consulting services by firms like Deloitte, are also vital catalysts for long-term growth.
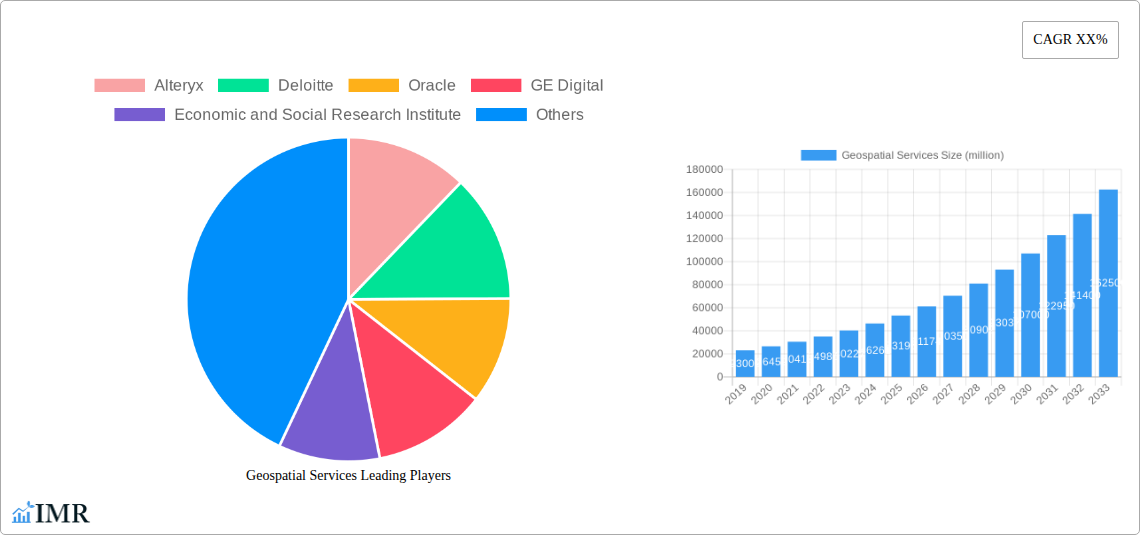
Key Players Shaping the Geospatial Services Market
- Alteryx
- Deloitte
- Oracle
- GE Digital
- Economic and Social Research Institute
- Fugro
- AECOM
- IBM
- CGI
- Analytics8
- Merrick
- Google Cloud
- INCATech
- SAM
- Fish & Wildlife Service
- Polaris
- Cumberland County
- Kimley-Horn
- Sewall
Notable Milestones in Geospatial Services Sector
- 2019: Launch of AI-powered analytics platforms by IBM, enhancing data processing speeds.
- 2020: Fugro expands its remote sensing capabilities with advanced drone technology.
- 2021: Google Cloud introduces new geospatial AI tools for environmental monitoring.
- 2022: Alteryx integrates machine learning for predictive analytics in agriculture.
- 2023: AECOM partners with Kimley-Horn to deliver integrated urban planning solutions.
- 2024 (Est.): Deloitte anticipates significant growth in geospatial consulting services for climate resilience.
- 2025 (Est.): Market expected to see increased M&A activity focused on data integration.
In-Depth Geospatial Services Market Outlook
The future outlook for the Geospatial Services market is exceptionally bright, driven by a confluence of accelerating technologies and expanding applications. The continued integration of artificial intelligence and machine learning into geospatial workflows will unlock unprecedented analytical capabilities, empowering businesses and governments with more accurate predictions and informed decision-making. Strategic partnerships and market expansion initiatives by key players like Google Cloud and IBM will further democratize access to sophisticated geospatial tools. The growing emphasis on sustainability, climate resilience, and smart city development presents substantial opportunities for growth, with geospatial intelligence playing a pivotal role in addressing global challenges. The market is set to witness a sustained period of robust growth, offering significant strategic opportunities for stakeholders who can leverage these powerful trends.
Geospatial Services Segmentation
-
1. Application
- 1.1. Agriculture
- 1.2. Geography
- 1.3. Research
- 1.4. Others
-
2. Types
- 2.1. Data Collection
- 2.2. Analysis
Geospatial Services Segmentation By Geography
-
1. North America
- 1.1. United States
- 1.2. Canada
- 1.3. Mexico
-
2. South America
- 2.1. Brazil
- 2.2. Argentina
- 2.3. Rest of South America
-
3. Europe
- 3.1. United Kingdom
- 3.2. Germany
- 3.3. France
- 3.4. Italy
- 3.5. Spain
- 3.6. Russia
- 3.7. Benelux
- 3.8. Nordics
- 3.9. Rest of Europe
-
4. Middle East & Africa
- 4.1. Turkey
- 4.2. Israel
- 4.3. GCC
- 4.4. North Africa
- 4.5. South Africa
- 4.6. Rest of Middle East & Africa
-
5. Asia Pacific
- 5.1. China
- 5.2. India
- 5.3. Japan
- 5.4. South Korea
- 5.5. ASEAN
- 5.6. Oceania
- 5.7. Rest of Asia Pacific
Geospatial Services REPORT HIGHLIGHTS
| Aspects | Details |
|---|---|
| Study Period | 2019-2033 |
| Base Year | 2024 |
| Estimated Year | 2025 |
| Forecast Period | 2025-2033 |
| Historical Period | 2019-2024 |
| Growth Rate | CAGR of XX% from 2019-2033 |
| Segmentation |
|
Table of Contents
- 1. Introduction
- 1.1. Research Scope
- 1.2. Market Segmentation
- 1.3. Research Methodology
- 1.4. Definitions and Assumptions
- 2. Executive Summary
- 2.1. Introduction
- 3. Market Dynamics
- 3.1. Introduction
- 3.2. Market Drivers
- 3.3. Market Restrains
- 3.4. Market Trends
- 4. Market Factor Analysis
- 4.1. Porters Five Forces
- 4.2. Supply/Value Chain
- 4.3. PESTEL analysis
- 4.4. Market Entropy
- 4.5. Patent/Trademark Analysis
- 5. Global Geospatial Services Analysis, Insights and Forecast, 2019-2031
- 5.1. Market Analysis, Insights and Forecast - by Application
- 5.1.1. Agriculture
- 5.1.2. Geography
- 5.1.3. Research
- 5.1.4. Others
- 5.2. Market Analysis, Insights and Forecast - by Types
- 5.2.1. Data Collection
- 5.2.2. Analysis
- 5.3. Market Analysis, Insights and Forecast - by Region
- 5.3.1. North America
- 5.3.2. South America
- 5.3.3. Europe
- 5.3.4. Middle East & Africa
- 5.3.5. Asia Pacific
- 5.1. Market Analysis, Insights and Forecast - by Application
- 6. North America Geospatial Services Analysis, Insights and Forecast, 2019-2031
- 6.1. Market Analysis, Insights and Forecast - by Application
- 6.1.1. Agriculture
- 6.1.2. Geography
- 6.1.3. Research
- 6.1.4. Others
- 6.2. Market Analysis, Insights and Forecast - by Types
- 6.2.1. Data Collection
- 6.2.2. Analysis
- 6.1. Market Analysis, Insights and Forecast - by Application
- 7. South America Geospatial Services Analysis, Insights and Forecast, 2019-2031
- 7.1. Market Analysis, Insights and Forecast - by Application
- 7.1.1. Agriculture
- 7.1.2. Geography
- 7.1.3. Research
- 7.1.4. Others
- 7.2. Market Analysis, Insights and Forecast - by Types
- 7.2.1. Data Collection
- 7.2.2. Analysis
- 7.1. Market Analysis, Insights and Forecast - by Application
- 8. Europe Geospatial Services Analysis, Insights and Forecast, 2019-2031
- 8.1. Market Analysis, Insights and Forecast - by Application
- 8.1.1. Agriculture
- 8.1.2. Geography
- 8.1.3. Research
- 8.1.4. Others
- 8.2. Market Analysis, Insights and Forecast - by Types
- 8.2.1. Data Collection
- 8.2.2. Analysis
- 8.1. Market Analysis, Insights and Forecast - by Application
- 9. Middle East & Africa Geospatial Services Analysis, Insights and Forecast, 2019-2031
- 9.1. Market Analysis, Insights and Forecast - by Application
- 9.1.1. Agriculture
- 9.1.2. Geography
- 9.1.3. Research
- 9.1.4. Others
- 9.2. Market Analysis, Insights and Forecast - by Types
- 9.2.1. Data Collection
- 9.2.2. Analysis
- 9.1. Market Analysis, Insights and Forecast - by Application
- 10. Asia Pacific Geospatial Services Analysis, Insights and Forecast, 2019-2031
- 10.1. Market Analysis, Insights and Forecast - by Application
- 10.1.1. Agriculture
- 10.1.2. Geography
- 10.1.3. Research
- 10.1.4. Others
- 10.2. Market Analysis, Insights and Forecast - by Types
- 10.2.1. Data Collection
- 10.2.2. Analysis
- 10.1. Market Analysis, Insights and Forecast - by Application
- 11. Competitive Analysis
- 11.1. Global Market Share Analysis 2024
- 11.2. Company Profiles
- 11.2.1 Alteryx
- 11.2.1.1. Overview
- 11.2.1.2. Products
- 11.2.1.3. SWOT Analysis
- 11.2.1.4. Recent Developments
- 11.2.1.5. Financials (Based on Availability)
- 11.2.2 Deloitte
- 11.2.2.1. Overview
- 11.2.2.2. Products
- 11.2.2.3. SWOT Analysis
- 11.2.2.4. Recent Developments
- 11.2.2.5. Financials (Based on Availability)
- 11.2.3 Oracle
- 11.2.3.1. Overview
- 11.2.3.2. Products
- 11.2.3.3. SWOT Analysis
- 11.2.3.4. Recent Developments
- 11.2.3.5. Financials (Based on Availability)
- 11.2.4 GE Digital
- 11.2.4.1. Overview
- 11.2.4.2. Products
- 11.2.4.3. SWOT Analysis
- 11.2.4.4. Recent Developments
- 11.2.4.5. Financials (Based on Availability)
- 11.2.5 Economic and Social Research Institute
- 11.2.5.1. Overview
- 11.2.5.2. Products
- 11.2.5.3. SWOT Analysis
- 11.2.5.4. Recent Developments
- 11.2.5.5. Financials (Based on Availability)
- 11.2.6 Fugro
- 11.2.6.1. Overview
- 11.2.6.2. Products
- 11.2.6.3. SWOT Analysis
- 11.2.6.4. Recent Developments
- 11.2.6.5. Financials (Based on Availability)
- 11.2.7 AECOM
- 11.2.7.1. Overview
- 11.2.7.2. Products
- 11.2.7.3. SWOT Analysis
- 11.2.7.4. Recent Developments
- 11.2.7.5. Financials (Based on Availability)
- 11.2.8 IBM
- 11.2.8.1. Overview
- 11.2.8.2. Products
- 11.2.8.3. SWOT Analysis
- 11.2.8.4. Recent Developments
- 11.2.8.5. Financials (Based on Availability)
- 11.2.9 CGI
- 11.2.9.1. Overview
- 11.2.9.2. Products
- 11.2.9.3. SWOT Analysis
- 11.2.9.4. Recent Developments
- 11.2.9.5. Financials (Based on Availability)
- 11.2.10 Analytics8
- 11.2.10.1. Overview
- 11.2.10.2. Products
- 11.2.10.3. SWOT Analysis
- 11.2.10.4. Recent Developments
- 11.2.10.5. Financials (Based on Availability)
- 11.2.11 Merrick
- 11.2.11.1. Overview
- 11.2.11.2. Products
- 11.2.11.3. SWOT Analysis
- 11.2.11.4. Recent Developments
- 11.2.11.5. Financials (Based on Availability)
- 11.2.12 Google Cloud
- 11.2.12.1. Overview
- 11.2.12.2. Products
- 11.2.12.3. SWOT Analysis
- 11.2.12.4. Recent Developments
- 11.2.12.5. Financials (Based on Availability)
- 11.2.13 INCATech
- 11.2.13.1. Overview
- 11.2.13.2. Products
- 11.2.13.3. SWOT Analysis
- 11.2.13.4. Recent Developments
- 11.2.13.5. Financials (Based on Availability)
- 11.2.14 SAM
- 11.2.14.1. Overview
- 11.2.14.2. Products
- 11.2.14.3. SWOT Analysis
- 11.2.14.4. Recent Developments
- 11.2.14.5. Financials (Based on Availability)
- 11.2.15 Fish & Wildlife Service
- 11.2.15.1. Overview
- 11.2.15.2. Products
- 11.2.15.3. SWOT Analysis
- 11.2.15.4. Recent Developments
- 11.2.15.5. Financials (Based on Availability)
- 11.2.16 Polaris
- 11.2.16.1. Overview
- 11.2.16.2. Products
- 11.2.16.3. SWOT Analysis
- 11.2.16.4. Recent Developments
- 11.2.16.5. Financials (Based on Availability)
- 11.2.17 Cumberland County
- 11.2.17.1. Overview
- 11.2.17.2. Products
- 11.2.17.3. SWOT Analysis
- 11.2.17.4. Recent Developments
- 11.2.17.5. Financials (Based on Availability)
- 11.2.18 Kimley-Horn
- 11.2.18.1. Overview
- 11.2.18.2. Products
- 11.2.18.3. SWOT Analysis
- 11.2.18.4. Recent Developments
- 11.2.18.5. Financials (Based on Availability)
- 11.2.19 Sewall
- 11.2.19.1. Overview
- 11.2.19.2. Products
- 11.2.19.3. SWOT Analysis
- 11.2.19.4. Recent Developments
- 11.2.19.5. Financials (Based on Availability)
- 11.2.1 Alteryx
List of Figures
- Figure 1: Global Geospatial Services Revenue Breakdown (million, %) by Region 2024 & 2032
- Figure 2: North America Geospatial Services Revenue (million), by Application 2024 & 2032
- Figure 3: North America Geospatial Services Revenue Share (%), by Application 2024 & 2032
- Figure 4: North America Geospatial Services Revenue (million), by Types 2024 & 2032
- Figure 5: North America Geospatial Services Revenue Share (%), by Types 2024 & 2032
- Figure 6: North America Geospatial Services Revenue (million), by Country 2024 & 2032
- Figure 7: North America Geospatial Services Revenue Share (%), by Country 2024 & 2032
- Figure 8: South America Geospatial Services Revenue (million), by Application 2024 & 2032
- Figure 9: South America Geospatial Services Revenue Share (%), by Application 2024 & 2032
- Figure 10: South America Geospatial Services Revenue (million), by Types 2024 & 2032
- Figure 11: South America Geospatial Services Revenue Share (%), by Types 2024 & 2032
- Figure 12: South America Geospatial Services Revenue (million), by Country 2024 & 2032
- Figure 13: South America Geospatial Services Revenue Share (%), by Country 2024 & 2032
- Figure 14: Europe Geospatial Services Revenue (million), by Application 2024 & 2032
- Figure 15: Europe Geospatial Services Revenue Share (%), by Application 2024 & 2032
- Figure 16: Europe Geospatial Services Revenue (million), by Types 2024 & 2032
- Figure 17: Europe Geospatial Services Revenue Share (%), by Types 2024 & 2032
- Figure 18: Europe Geospatial Services Revenue (million), by Country 2024 & 2032
- Figure 19: Europe Geospatial Services Revenue Share (%), by Country 2024 & 2032
- Figure 20: Middle East & Africa Geospatial Services Revenue (million), by Application 2024 & 2032
- Figure 21: Middle East & Africa Geospatial Services Revenue Share (%), by Application 2024 & 2032
- Figure 22: Middle East & Africa Geospatial Services Revenue (million), by Types 2024 & 2032
- Figure 23: Middle East & Africa Geospatial Services Revenue Share (%), by Types 2024 & 2032
- Figure 24: Middle East & Africa Geospatial Services Revenue (million), by Country 2024 & 2032
- Figure 25: Middle East & Africa Geospatial Services Revenue Share (%), by Country 2024 & 2032
- Figure 26: Asia Pacific Geospatial Services Revenue (million), by Application 2024 & 2032
- Figure 27: Asia Pacific Geospatial Services Revenue Share (%), by Application 2024 & 2032
- Figure 28: Asia Pacific Geospatial Services Revenue (million), by Types 2024 & 2032
- Figure 29: Asia Pacific Geospatial Services Revenue Share (%), by Types 2024 & 2032
- Figure 30: Asia Pacific Geospatial Services Revenue (million), by Country 2024 & 2032
- Figure 31: Asia Pacific Geospatial Services Revenue Share (%), by Country 2024 & 2032
List of Tables
- Table 1: Global Geospatial Services Revenue million Forecast, by Region 2019 & 2032
- Table 2: Global Geospatial Services Revenue million Forecast, by Application 2019 & 2032
- Table 3: Global Geospatial Services Revenue million Forecast, by Types 2019 & 2032
- Table 4: Global Geospatial Services Revenue million Forecast, by Region 2019 & 2032
- Table 5: Global Geospatial Services Revenue million Forecast, by Application 2019 & 2032
- Table 6: Global Geospatial Services Revenue million Forecast, by Types 2019 & 2032
- Table 7: Global Geospatial Services Revenue million Forecast, by Country 2019 & 2032
- Table 8: United States Geospatial Services Revenue (million) Forecast, by Application 2019 & 2032
- Table 9: Canada Geospatial Services Revenue (million) Forecast, by Application 2019 & 2032
- Table 10: Mexico Geospatial Services Revenue (million) Forecast, by Application 2019 & 2032
- Table 11: Global Geospatial Services Revenue million Forecast, by Application 2019 & 2032
- Table 12: Global Geospatial Services Revenue million Forecast, by Types 2019 & 2032
- Table 13: Global Geospatial Services Revenue million Forecast, by Country 2019 & 2032
- Table 14: Brazil Geospatial Services Revenue (million) Forecast, by Application 2019 & 2032
- Table 15: Argentina Geospatial Services Revenue (million) Forecast, by Application 2019 & 2032
- Table 16: Rest of South America Geospatial Services Revenue (million) Forecast, by Application 2019 & 2032
- Table 17: Global Geospatial Services Revenue million Forecast, by Application 2019 & 2032
- Table 18: Global Geospatial Services Revenue million Forecast, by Types 2019 & 2032
- Table 19: Global Geospatial Services Revenue million Forecast, by Country 2019 & 2032
- Table 20: United Kingdom Geospatial Services Revenue (million) Forecast, by Application 2019 & 2032
- Table 21: Germany Geospatial Services Revenue (million) Forecast, by Application 2019 & 2032
- Table 22: France Geospatial Services Revenue (million) Forecast, by Application 2019 & 2032
- Table 23: Italy Geospatial Services Revenue (million) Forecast, by Application 2019 & 2032
- Table 24: Spain Geospatial Services Revenue (million) Forecast, by Application 2019 & 2032
- Table 25: Russia Geospatial Services Revenue (million) Forecast, by Application 2019 & 2032
- Table 26: Benelux Geospatial Services Revenue (million) Forecast, by Application 2019 & 2032
- Table 27: Nordics Geospatial Services Revenue (million) Forecast, by Application 2019 & 2032
- Table 28: Rest of Europe Geospatial Services Revenue (million) Forecast, by Application 2019 & 2032
- Table 29: Global Geospatial Services Revenue million Forecast, by Application 2019 & 2032
- Table 30: Global Geospatial Services Revenue million Forecast, by Types 2019 & 2032
- Table 31: Global Geospatial Services Revenue million Forecast, by Country 2019 & 2032
- Table 32: Turkey Geospatial Services Revenue (million) Forecast, by Application 2019 & 2032
- Table 33: Israel Geospatial Services Revenue (million) Forecast, by Application 2019 & 2032
- Table 34: GCC Geospatial Services Revenue (million) Forecast, by Application 2019 & 2032
- Table 35: North Africa Geospatial Services Revenue (million) Forecast, by Application 2019 & 2032
- Table 36: South Africa Geospatial Services Revenue (million) Forecast, by Application 2019 & 2032
- Table 37: Rest of Middle East & Africa Geospatial Services Revenue (million) Forecast, by Application 2019 & 2032
- Table 38: Global Geospatial Services Revenue million Forecast, by Application 2019 & 2032
- Table 39: Global Geospatial Services Revenue million Forecast, by Types 2019 & 2032
- Table 40: Global Geospatial Services Revenue million Forecast, by Country 2019 & 2032
- Table 41: China Geospatial Services Revenue (million) Forecast, by Application 2019 & 2032
- Table 42: India Geospatial Services Revenue (million) Forecast, by Application 2019 & 2032
- Table 43: Japan Geospatial Services Revenue (million) Forecast, by Application 2019 & 2032
- Table 44: South Korea Geospatial Services Revenue (million) Forecast, by Application 2019 & 2032
- Table 45: ASEAN Geospatial Services Revenue (million) Forecast, by Application 2019 & 2032
- Table 46: Oceania Geospatial Services Revenue (million) Forecast, by Application 2019 & 2032
- Table 47: Rest of Asia Pacific Geospatial Services Revenue (million) Forecast, by Application 2019 & 2032
Frequently Asked Questions
1. What is the projected Compound Annual Growth Rate (CAGR) of the Geospatial Services?
The projected CAGR is approximately XX%.
2. Which companies are prominent players in the Geospatial Services?
Key companies in the market include Alteryx, Deloitte, Oracle, GE Digital, Economic and Social Research Institute, Fugro, AECOM, IBM, CGI, Analytics8, Merrick, Google Cloud, INCATech, SAM, Fish & Wildlife Service, Polaris, Cumberland County, Kimley-Horn, Sewall.
3. What are the main segments of the Geospatial Services?
The market segments include Application, Types.
4. Can you provide details about the market size?
The market size is estimated to be USD XXX million as of 2022.
5. What are some drivers contributing to market growth?
N/A
6. What are the notable trends driving market growth?
N/A
7. Are there any restraints impacting market growth?
N/A
8. Can you provide examples of recent developments in the market?
N/A
9. What pricing options are available for accessing the report?
Pricing options include single-user, multi-user, and enterprise licenses priced at USD 4900.00, USD 7350.00, and USD 9800.00 respectively.
10. Is the market size provided in terms of value or volume?
The market size is provided in terms of value, measured in million.
11. Are there any specific market keywords associated with the report?
Yes, the market keyword associated with the report is "Geospatial Services," which aids in identifying and referencing the specific market segment covered.
12. How do I determine which pricing option suits my needs best?
The pricing options vary based on user requirements and access needs. Individual users may opt for single-user licenses, while businesses requiring broader access may choose multi-user or enterprise licenses for cost-effective access to the report.
13. Are there any additional resources or data provided in the Geospatial Services report?
While the report offers comprehensive insights, it's advisable to review the specific contents or supplementary materials provided to ascertain if additional resources or data are available.
14. How can I stay updated on further developments or reports in the Geospatial Services?
To stay informed about further developments, trends, and reports in the Geospatial Services, consider subscribing to industry newsletters, following relevant companies and organizations, or regularly checking reputable industry news sources and publications.
Methodology
Step 1 - Identification of Relevant Samples Size from Population Database


Step 2 - Approaches for Defining Global Market Size (Value, Volume* & Price*)

Note*: In applicable scenarios
Step 3 - Data Sources
Primary Research
- Web Analytics
- Survey Reports
- Research Institute
- Latest Research Reports
- Opinion Leaders
Secondary Research
- Annual Reports
- White Paper
- Latest Press Release
- Industry Association
- Paid Database
- Investor Presentations

Step 4 - Data Triangulation
Involves using different sources of information in order to increase the validity of a study
These sources are likely to be stakeholders in a program - participants, other researchers, program staff, other community members, and so on.
Then we put all data in single framework & apply various statistical tools to find out the dynamic on the market.
During the analysis stage, feedback from the stakeholder groups would be compared to determine areas of agreement as well as areas of divergence
