

Key Insights
The Global Automated Ophthalmic Perimeters Market is projected to reach 321.98 million by 2025, exhibiting a Compound Annual Growth Rate (CAGR) of 4.5% through 2033. This growth is driven by the increasing incidence of eye conditions such as glaucoma and age-related macular degeneration, necessitating advanced diagnostic solutions. The widespread adoption of automated perimetry systems in healthcare facilities, attributed to their accuracy, efficiency, and objective data generation, further fuels market demand. Innovations in AI-driven analysis and cloud-based data management are enhancing diagnostic precision and workflow integration. The market is segmented into static and kinetic perimetry; static perimetry leads due to its routine use in glaucoma screening. Hospitals constitute the largest end-user segment, followed by specialized ophthalmic clinics.
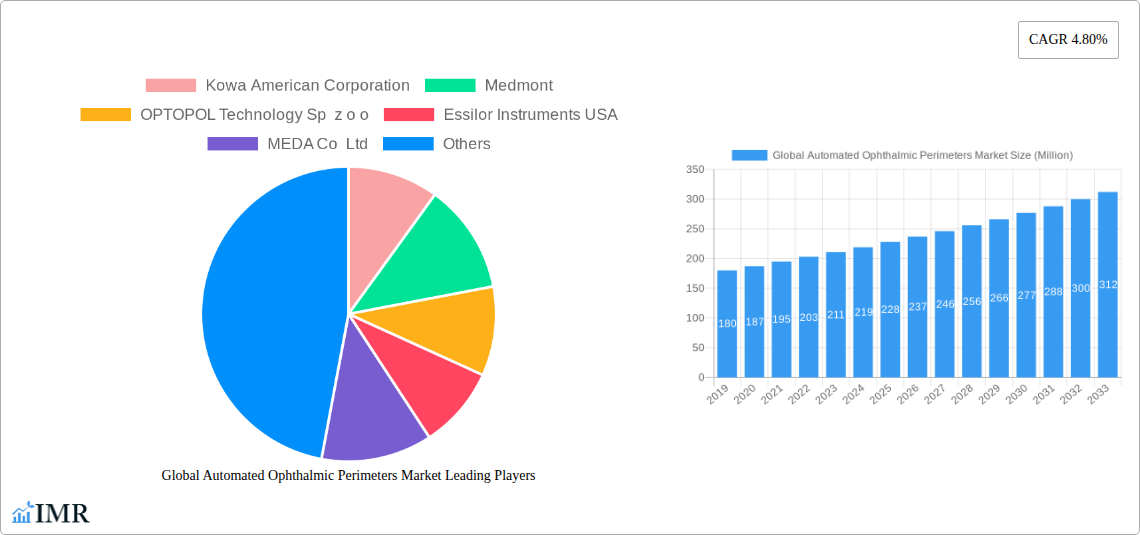
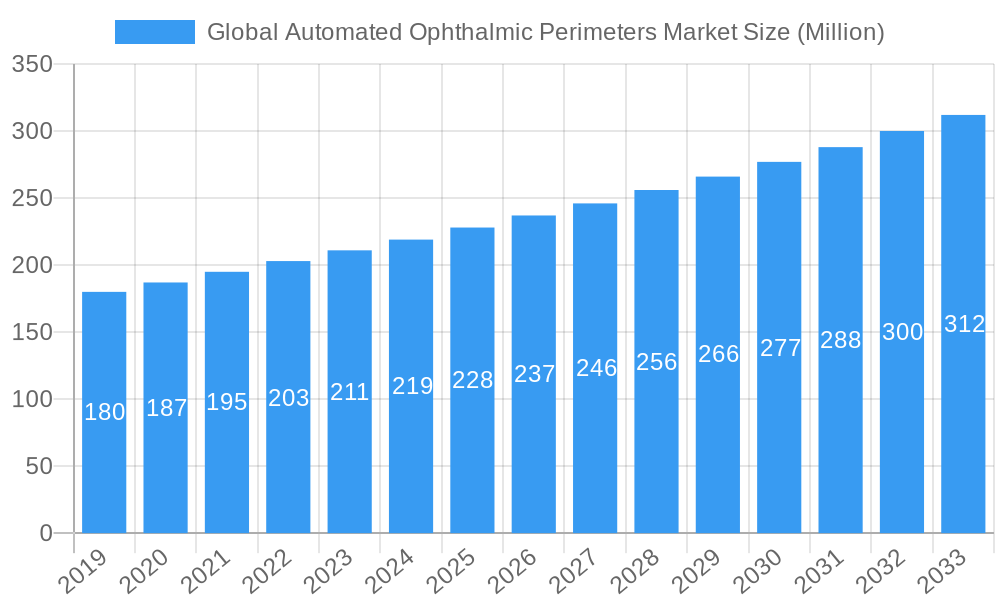
Global Automated Ophthalmic Perimeters Market Market Size (In Million)
Expanding healthcare investments and heightened awareness of early visual field defect detection and management contribute to market expansion. Emerging economies, particularly in the Asia Pacific, offer significant opportunities due to improving healthcare infrastructure and a growing number of ophthalmologists. Challenges include the high initial cost of advanced systems and the availability of alternative diagnostic methods. Leading companies such as ZEISS International, HAAG-STREIT GROUP, and NIDEK CO LTD are actively investing in R&D to introduce innovative solutions and broaden their market presence. The growing demand for point-of-care diagnostics and the development of portable perimeter devices are anticipated to shape future market trends.
Global Automated Ophthalmic Perimeters Market Company Market Share
This comprehensive report analyzes the Global Automated Ophthalmic Perimeters Market, a key segment within the Ophthalmic Diagnostic Devices Market. It delves into the Static Perimetry Market and Kinetic Perimetry Market, and end-user adoption across Hospitals, Ophthalmic Clinics, and Others, offering detailed insights into market dynamics, growth forecasts, and competitive landscapes. Focusing on vision screening devices, glaucoma diagnosis tools, and visual field testing equipment, this report serves as an essential resource for industry stakeholders.
Global Automated Ophthalmic Perimeters Market Dynamics & Structure
The Global Automated Ophthalmic Perimeters Market is characterized by a moderately concentrated structure, with key players like ZEISS International, NIDEK CO LTD, and HAAG-STREIT GROUP holding significant market shares. Technological innovation remains a primary driver, fueled by advancements in AI-powered diagnostic algorithms and the development of portable, user-friendly perimetry devices. Regulatory frameworks, primarily governed by bodies like the FDA and EMA, ensure product safety and efficacy, indirectly shaping market entry and product development strategies. Competitive product substitutes include manual perimetry and other visual field assessment methods, though the efficiency and accuracy of automated systems are increasingly displacing them. End-user demographics are shifting towards an aging global population, with a growing prevalence of age-related eye conditions like glaucoma and macular degeneration, thereby increasing demand for sophisticated diagnostic tools. Mergers and acquisitions (M&A) trends are observed as companies seek to expand their product portfolios and geographical reach. For instance, the last five years have seen an estimated volume of 5-7 M&A deals, with an average deal value in the range of $50-$150 Million, aimed at consolidating market presence and acquiring innovative technologies. Barriers to innovation include the high cost of R&D, stringent regulatory approval processes, and the need for extensive clinical validation.
Global Automated Ophthalmic Perimeters Market Growth Trends & Insights
The Global Automated Ophthalmic Perimeters Market is projected to experience robust growth over the forecast period, driven by an escalating incidence of visual impairments and a heightened awareness of the importance of early disease detection. The market size, valued at approximately $750 Million in 2024, is anticipated to reach $1,250 Million by 2033, exhibiting a Compound Annual Growth Rate (CAGR) of approximately 6.2%. Adoption rates of automated perimetry systems are steadily increasing, propelled by their superior accuracy, objectivity, and efficiency compared to traditional manual methods. Technological disruptions, such as the integration of cloud-based data management for easier patient record access and the development of advanced imaging techniques that complement visual field data, are further enhancing the utility of these devices. Consumer behavior shifts are evident, with healthcare providers increasingly prioritizing investments in advanced diagnostic equipment to improve patient outcomes and optimize workflow efficiency. The penetration of automated perimetry in emerging economies is also expected to rise significantly as healthcare infrastructure improves and access to specialized eye care expands. Early detection of conditions like glaucoma, often asymptomatic in its initial stages, is a key factor driving demand, as timely intervention can prevent irreversible vision loss. The increasing demand for tele-ophthalmology solutions also presents a significant opportunity for remote visual field testing capabilities.
Dominant Regions, Countries, or Segments in Global Automated Ophthalmic Perimeters Market
North America currently dominates the Global Automated Ophthalmic Perimeters Market, with the United States leading in market share due to its advanced healthcare infrastructure, high disposable income, and a large aging population susceptible to eye diseases. The Static Perimetry Market within North America is particularly strong, driven by the high prevalence of glaucoma and diabetic retinopathy. Key drivers for this dominance include robust reimbursement policies for diagnostic procedures, substantial investment in R&D by leading ophthalmic device manufacturers, and a well-established network of specialized ophthalmic clinics and hospitals equipped with the latest technology. The market in North America is estimated to hold approximately 35% of the global market share in 2025.
Asia Pacific is emerging as the fastest-growing region, with countries like China and India exhibiting significant growth potential. This growth is attributed to a burgeoning population, increasing healthcare expenditure, a rising prevalence of chronic diseases, and government initiatives aimed at improving eye care services. The Hospital segment is the largest end-user in this region, owing to the increasing number of eye care centers within hospitals and the growing adoption of advanced diagnostic tools in these facilities. The region's market share is projected to reach 28% by 2033.
In terms of product segments, Static Perimetry is anticipated to remain the dominant segment due to its widespread use in the diagnosis and management of various retinal and neurological disorders, particularly glaucoma. The Ophthalmic Clinics segment is also a significant contributor to market growth globally, as these specialized centers are increasingly investing in automated perimeters to offer comprehensive eye care services.
Global Automated Ophthalmic Perimeters Market Product Landscape
The Global Automated Ophthalmic Perimeters Market is characterized by continuous product innovation, focusing on enhancing diagnostic accuracy, patient comfort, and workflow efficiency. Products range from sophisticated, multi-modal systems offering advanced visual field analysis to more compact, portable devices designed for broader accessibility. Innovations include enhanced visual field testing software with AI-driven pattern recognition for earlier detection of subtle visual field defects, real-time adaptive testing algorithms to reduce examination time, and integration with electronic health records (EHRs) for seamless data management. Performance metrics are constantly being refined, with a focus on improving sensitivity and specificity in detecting early-stage visual field loss, crucial for conditions like glaucoma. Unique selling propositions often revolve around ease of use, advanced data visualization, and the ability to perform a comprehensive range of perimetric tests.
Key Drivers, Barriers & Challenges in Global Automated Ophthalmic Perimeters Market
Key Drivers:
- Rising prevalence of eye diseases: Increasing incidence of glaucoma, diabetic retinopathy, and age-related macular degeneration globally fuels demand for early and accurate diagnosis.
- Technological advancements: Innovations in AI, automation, and digital integration enhance diagnostic capabilities and user experience.
- Growing healthcare expenditure: Increased investment in healthcare infrastructure and advanced medical devices, especially in emerging economies.
- Awareness and early detection initiatives: Public and professional emphasis on timely visual field testing for preventative eye care.
Barriers & Challenges:
- High initial cost of equipment: The significant capital investment required for advanced automated perimeters can be a barrier for smaller clinics and hospitals.
- Regulatory hurdles: Stringent approval processes for medical devices can prolong market entry and increase development costs.
- Technical expertise requirement: Operating and interpreting data from complex perimetry systems necessitates trained personnel.
- Reimbursement policies: Inconsistent or inadequate reimbursement rates for perimetry tests in certain regions can hinder adoption.
- Competition from alternative diagnostic methods: While declining, some traditional or simpler visual field assessment tools still exist.
Emerging Opportunities in Global Automated Ophthalmic Perimeters Market
Emerging opportunities in the Global Automated Ophthalmic Perimeters Market lie in the development of more portable and cost-effective perimetry solutions for remote and underserved areas. The integration of artificial intelligence for predictive analytics, enabling earlier identification of patients at risk for rapid visual field deterioration, presents a significant avenue. Furthermore, the expansion of tele-ophthalmology services globally creates a demand for robust, remote visual field testing capabilities. The growing focus on personalized medicine also opens doors for perimeters that can provide highly tailored visual field assessments based on individual patient needs and disease profiles.
Growth Accelerators in the Global Automated Ophthalmic Perimeters Market Industry
Catalysts driving long-term growth in the Global Automated Ophthalmic Perimeters Market include breakthroughs in miniaturization, leading to more compact and affordable devices that can be deployed more widely. Strategic partnerships between technology developers and ophthalmic device manufacturers are accelerating the integration of cutting-edge AI and machine learning algorithms into perimetry systems, enhancing diagnostic precision. Market expansion strategies targeting developing nations, coupled with increasing government support for eye care programs, will further propel adoption. The development of standardized protocols for visual field testing across different platforms and regions will also foster market growth by ensuring consistency and comparability of data.
Key Players Shaping the Global Automated Ophthalmic Perimeters Market Market
- Kowa American Corporation
- Medmont
- OPTOPOL Technology Sp z o o
- Essilor Instruments USA
- MEDA Co Ltd
- ZEISS International
- NIDEK CO LTD
- Metrovision
- HAAG-STREIT GROUP
- OCULUS Inc
Notable Milestones in Global Automated Ophthalmic Perimeters Market Sector
- 2022: Launch of AI-powered diagnostic software by ZEISS International, enhancing glaucoma detection accuracy.
- 2021: Medmont introduces a new generation of kinetic perimeters with improved patient comfort and faster testing times.
- 2020: Essilor Instruments USA expands its portfolio with the acquisition of a leading perimetry technology developer.
- 2019: NIDEK CO LTD releases a cloud-based data management solution for its visual field analyzers.
- 2023: HAAG-STREIT GROUP receives FDA clearance for a new high-resolution automated perimeter.
In-Depth Global Automated Ophthalmic Perimeters Market Market Outlook
The future outlook for the Global Automated Ophthalmic Perimeters Market is exceptionally promising, driven by sustained demand for advanced diagnostic tools to combat the rising tide of visual impairments. Growth accelerators such as further AI integration for predictive diagnostics, miniaturization of devices for enhanced portability, and strategic expansion into emerging markets will continue to shape the industry. The increasing focus on preventative eye care and early intervention will solidify the indispensable role of automated perimetry in ophthalmic practice. Opportunities abound for companies that can deliver innovative, cost-effective, and user-friendly solutions, particularly those that facilitate tele-ophthalmology and personalized patient care, ensuring continued market expansion and technological evolution.
Global Automated Ophthalmic Perimeters Market Segmentation
-
1. Product
- 1.1. Static
- 1.2. Kinetic
-
2. End User
- 2.1. Hospital
- 2.2. Ophthalmic Clinics
- 2.3. Others
Global Automated Ophthalmic Perimeters Market Segmentation By Geography
- 1. North America
- 2. Europe
- 3. Asia Pacific
- 4. Middle East and Africa
- 5. South America
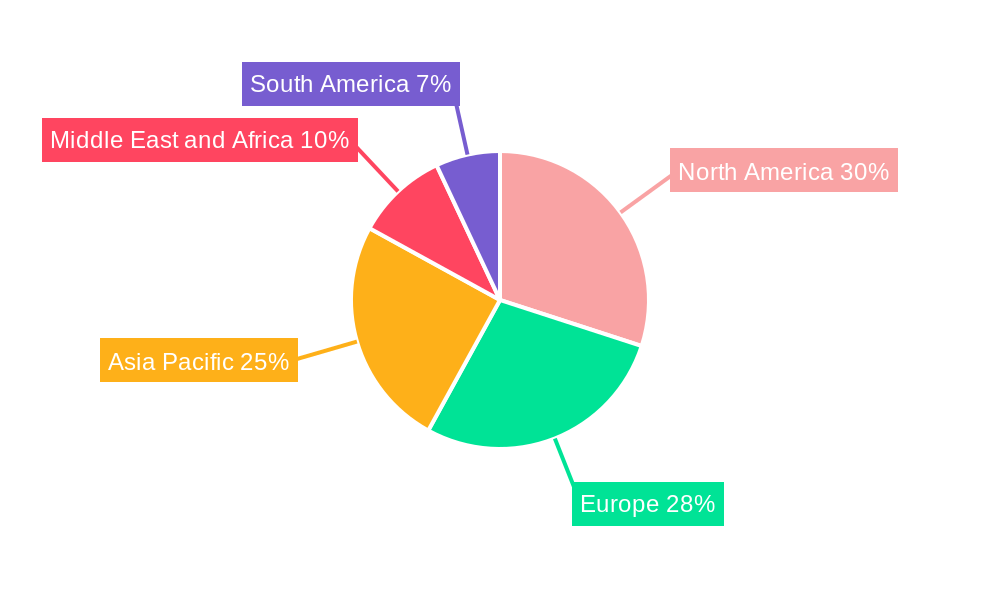
Global Automated Ophthalmic Perimeters Market Regional Market Share
Geographic Coverage of Global Automated Ophthalmic Perimeters Market
Global Automated Ophthalmic Perimeters Market REPORT HIGHLIGHTS
| Aspects | Details |
|---|---|
| Study Period | 2020-2034 |
| Base Year | 2025 |
| Estimated Year | 2026 |
| Forecast Period | 2026-2034 |
| Historical Period | 2020-2025 |
| Growth Rate | CAGR of 4.5% from 2020-2034 |
| Segmentation |
|
Table of Contents
- 1. Introduction
- 1.1. Research Scope
- 1.2. Market Segmentation
- 1.3. Research Methodology
- 1.4. Definitions and Assumptions
- 2. Executive Summary
- 2.1. Introduction
- 3. Market Dynamics
- 3.1. Introduction
- 3.2. Market Drivers
- 3.2.1. Rise in the Prevalence of Ocular Disorders and Increase in Geriatric Population; Technological Advancement
- 3.3. Market Restrains
- 3.3.1. High Cost of Products
- 3.4. Market Trends
- 3.4.1. Static segment is Expected to Hold a Significant Share Over the Forecast Period
- 4. Market Factor Analysis
- 4.1. Porters Five Forces
- 4.2. Supply/Value Chain
- 4.3. PESTEL analysis
- 4.4. Market Entropy
- 4.5. Patent/Trademark Analysis
- 5. Global Automated Ophthalmic Perimeters Market Analysis, Insights and Forecast, 2020-2032
- 5.1. Market Analysis, Insights and Forecast - by Product
- 5.1.1. Static
- 5.1.2. Kinetic
- 5.2. Market Analysis, Insights and Forecast - by End User
- 5.2.1. Hospital
- 5.2.2. Ophthalmic Clinics
- 5.2.3. Others
- 5.3. Market Analysis, Insights and Forecast - by Region
- 5.3.1. North America
- 5.3.2. Europe
- 5.3.3. Asia Pacific
- 5.3.4. Middle East and Africa
- 5.3.5. South America
- 5.1. Market Analysis, Insights and Forecast - by Product
- 6. North America Global Automated Ophthalmic Perimeters Market Analysis, Insights and Forecast, 2020-2032
- 6.1. Market Analysis, Insights and Forecast - by Product
- 6.1.1. Static
- 6.1.2. Kinetic
- 6.2. Market Analysis, Insights and Forecast - by End User
- 6.2.1. Hospital
- 6.2.2. Ophthalmic Clinics
- 6.2.3. Others
- 6.1. Market Analysis, Insights and Forecast - by Product
- 7. Europe Global Automated Ophthalmic Perimeters Market Analysis, Insights and Forecast, 2020-2032
- 7.1. Market Analysis, Insights and Forecast - by Product
- 7.1.1. Static
- 7.1.2. Kinetic
- 7.2. Market Analysis, Insights and Forecast - by End User
- 7.2.1. Hospital
- 7.2.2. Ophthalmic Clinics
- 7.2.3. Others
- 7.1. Market Analysis, Insights and Forecast - by Product
- 8. Asia Pacific Global Automated Ophthalmic Perimeters Market Analysis, Insights and Forecast, 2020-2032
- 8.1. Market Analysis, Insights and Forecast - by Product
- 8.1.1. Static
- 8.1.2. Kinetic
- 8.2. Market Analysis, Insights and Forecast - by End User
- 8.2.1. Hospital
- 8.2.2. Ophthalmic Clinics
- 8.2.3. Others
- 8.1. Market Analysis, Insights and Forecast - by Product
- 9. Middle East and Africa Global Automated Ophthalmic Perimeters Market Analysis, Insights and Forecast, 2020-2032
- 9.1. Market Analysis, Insights and Forecast - by Product
- 9.1.1. Static
- 9.1.2. Kinetic
- 9.2. Market Analysis, Insights and Forecast - by End User
- 9.2.1. Hospital
- 9.2.2. Ophthalmic Clinics
- 9.2.3. Others
- 9.1. Market Analysis, Insights and Forecast - by Product
- 10. South America Global Automated Ophthalmic Perimeters Market Analysis, Insights and Forecast, 2020-2032
- 10.1. Market Analysis, Insights and Forecast - by Product
- 10.1.1. Static
- 10.1.2. Kinetic
- 10.2. Market Analysis, Insights and Forecast - by End User
- 10.2.1. Hospital
- 10.2.2. Ophthalmic Clinics
- 10.2.3. Others
- 10.1. Market Analysis, Insights and Forecast - by Product
- 11. Competitive Analysis
- 11.1. Market Share Analysis 2025
- 11.2. Company Profiles
- 11.2.1 Kowa American Corporation
- 11.2.1.1. Overview
- 11.2.1.2. Products
- 11.2.1.3. SWOT Analysis
- 11.2.1.4. Recent Developments
- 11.2.1.5. Financials (Based on Availability)
- 11.2.2 Medmont
- 11.2.2.1. Overview
- 11.2.2.2. Products
- 11.2.2.3. SWOT Analysis
- 11.2.2.4. Recent Developments
- 11.2.2.5. Financials (Based on Availability)
- 11.2.3 OPTOPOL Technology Sp z o o
- 11.2.3.1. Overview
- 11.2.3.2. Products
- 11.2.3.3. SWOT Analysis
- 11.2.3.4. Recent Developments
- 11.2.3.5. Financials (Based on Availability)
- 11.2.4 Essilor Instruments USA
- 11.2.4.1. Overview
- 11.2.4.2. Products
- 11.2.4.3. SWOT Analysis
- 11.2.4.4. Recent Developments
- 11.2.4.5. Financials (Based on Availability)
- 11.2.5 MEDA Co Ltd
- 11.2.5.1. Overview
- 11.2.5.2. Products
- 11.2.5.3. SWOT Analysis
- 11.2.5.4. Recent Developments
- 11.2.5.5. Financials (Based on Availability)
- 11.2.6 ZEISS International
- 11.2.6.1. Overview
- 11.2.6.2. Products
- 11.2.6.3. SWOT Analysis
- 11.2.6.4. Recent Developments
- 11.2.6.5. Financials (Based on Availability)
- 11.2.7 NIDEK CO LTD
- 11.2.7.1. Overview
- 11.2.7.2. Products
- 11.2.7.3. SWOT Analysis
- 11.2.7.4. Recent Developments
- 11.2.7.5. Financials (Based on Availability)
- 11.2.8 Metrovision
- 11.2.8.1. Overview
- 11.2.8.2. Products
- 11.2.8.3. SWOT Analysis
- 11.2.8.4. Recent Developments
- 11.2.8.5. Financials (Based on Availability)
- 11.2.9 HAAG-STREIT GROUP
- 11.2.9.1. Overview
- 11.2.9.2. Products
- 11.2.9.3. SWOT Analysis
- 11.2.9.4. Recent Developments
- 11.2.9.5. Financials (Based on Availability)
- 11.2.10 OCULUS Inc
- 11.2.10.1. Overview
- 11.2.10.2. Products
- 11.2.10.3. SWOT Analysis
- 11.2.10.4. Recent Developments
- 11.2.10.5. Financials (Based on Availability)
- 11.2.1 Kowa American Corporation
List of Figures
- Figure 1: Global Global Automated Ophthalmic Perimeters Market Revenue Breakdown (million, %) by Region 2025 & 2033
- Figure 2: North America Global Automated Ophthalmic Perimeters Market Revenue (million), by Product 2025 & 2033
- Figure 3: North America Global Automated Ophthalmic Perimeters Market Revenue Share (%), by Product 2025 & 2033
- Figure 4: North America Global Automated Ophthalmic Perimeters Market Revenue (million), by End User 2025 & 2033
- Figure 5: North America Global Automated Ophthalmic Perimeters Market Revenue Share (%), by End User 2025 & 2033
- Figure 6: North America Global Automated Ophthalmic Perimeters Market Revenue (million), by Country 2025 & 2033
- Figure 7: North America Global Automated Ophthalmic Perimeters Market Revenue Share (%), by Country 2025 & 2033
- Figure 8: Europe Global Automated Ophthalmic Perimeters Market Revenue (million), by Product 2025 & 2033
- Figure 9: Europe Global Automated Ophthalmic Perimeters Market Revenue Share (%), by Product 2025 & 2033
- Figure 10: Europe Global Automated Ophthalmic Perimeters Market Revenue (million), by End User 2025 & 2033
- Figure 11: Europe Global Automated Ophthalmic Perimeters Market Revenue Share (%), by End User 2025 & 2033
- Figure 12: Europe Global Automated Ophthalmic Perimeters Market Revenue (million), by Country 2025 & 2033
- Figure 13: Europe Global Automated Ophthalmic Perimeters Market Revenue Share (%), by Country 2025 & 2033
- Figure 14: Asia Pacific Global Automated Ophthalmic Perimeters Market Revenue (million), by Product 2025 & 2033
- Figure 15: Asia Pacific Global Automated Ophthalmic Perimeters Market Revenue Share (%), by Product 2025 & 2033
- Figure 16: Asia Pacific Global Automated Ophthalmic Perimeters Market Revenue (million), by End User 2025 & 2033
- Figure 17: Asia Pacific Global Automated Ophthalmic Perimeters Market Revenue Share (%), by End User 2025 & 2033
- Figure 18: Asia Pacific Global Automated Ophthalmic Perimeters Market Revenue (million), by Country 2025 & 2033
- Figure 19: Asia Pacific Global Automated Ophthalmic Perimeters Market Revenue Share (%), by Country 2025 & 2033
- Figure 20: Middle East and Africa Global Automated Ophthalmic Perimeters Market Revenue (million), by Product 2025 & 2033
- Figure 21: Middle East and Africa Global Automated Ophthalmic Perimeters Market Revenue Share (%), by Product 2025 & 2033
- Figure 22: Middle East and Africa Global Automated Ophthalmic Perimeters Market Revenue (million), by End User 2025 & 2033
- Figure 23: Middle East and Africa Global Automated Ophthalmic Perimeters Market Revenue Share (%), by End User 2025 & 2033
- Figure 24: Middle East and Africa Global Automated Ophthalmic Perimeters Market Revenue (million), by Country 2025 & 2033
- Figure 25: Middle East and Africa Global Automated Ophthalmic Perimeters Market Revenue Share (%), by Country 2025 & 2033
- Figure 26: South America Global Automated Ophthalmic Perimeters Market Revenue (million), by Product 2025 & 2033
- Figure 27: South America Global Automated Ophthalmic Perimeters Market Revenue Share (%), by Product 2025 & 2033
- Figure 28: South America Global Automated Ophthalmic Perimeters Market Revenue (million), by End User 2025 & 2033
- Figure 29: South America Global Automated Ophthalmic Perimeters Market Revenue Share (%), by End User 2025 & 2033
- Figure 30: South America Global Automated Ophthalmic Perimeters Market Revenue (million), by Country 2025 & 2033
- Figure 31: South America Global Automated Ophthalmic Perimeters Market Revenue Share (%), by Country 2025 & 2033
List of Tables
- Table 1: Global Automated Ophthalmic Perimeters Market Revenue million Forecast, by Product 2020 & 2033
- Table 2: Global Automated Ophthalmic Perimeters Market Revenue million Forecast, by End User 2020 & 2033
- Table 3: Global Automated Ophthalmic Perimeters Market Revenue million Forecast, by Region 2020 & 2033
- Table 4: Global Automated Ophthalmic Perimeters Market Revenue million Forecast, by Product 2020 & 2033
- Table 5: Global Automated Ophthalmic Perimeters Market Revenue million Forecast, by End User 2020 & 2033
- Table 6: Global Automated Ophthalmic Perimeters Market Revenue million Forecast, by Country 2020 & 2033
- Table 7: Global Automated Ophthalmic Perimeters Market Revenue million Forecast, by Product 2020 & 2033
- Table 8: Global Automated Ophthalmic Perimeters Market Revenue million Forecast, by End User 2020 & 2033
- Table 9: Global Automated Ophthalmic Perimeters Market Revenue million Forecast, by Country 2020 & 2033
- Table 10: Global Automated Ophthalmic Perimeters Market Revenue million Forecast, by Product 2020 & 2033
- Table 11: Global Automated Ophthalmic Perimeters Market Revenue million Forecast, by End User 2020 & 2033
- Table 12: Global Automated Ophthalmic Perimeters Market Revenue million Forecast, by Country 2020 & 2033
- Table 13: Global Automated Ophthalmic Perimeters Market Revenue million Forecast, by Product 2020 & 2033
- Table 14: Global Automated Ophthalmic Perimeters Market Revenue million Forecast, by End User 2020 & 2033
- Table 15: Global Automated Ophthalmic Perimeters Market Revenue million Forecast, by Country 2020 & 2033
- Table 16: Global Automated Ophthalmic Perimeters Market Revenue million Forecast, by Product 2020 & 2033
- Table 17: Global Automated Ophthalmic Perimeters Market Revenue million Forecast, by End User 2020 & 2033
- Table 18: Global Automated Ophthalmic Perimeters Market Revenue million Forecast, by Country 2020 & 2033
Frequently Asked Questions
1. What is the projected Compound Annual Growth Rate (CAGR) of the Global Automated Ophthalmic Perimeters Market?
The projected CAGR is approximately 4.5%.
2. Which companies are prominent players in the Global Automated Ophthalmic Perimeters Market?
Key companies in the market include Kowa American Corporation, Medmont, OPTOPOL Technology Sp z o o, Essilor Instruments USA, MEDA Co Ltd, ZEISS International, NIDEK CO LTD, Metrovision, HAAG-STREIT GROUP, OCULUS Inc.
3. What are the main segments of the Global Automated Ophthalmic Perimeters Market?
The market segments include Product, End User.
4. Can you provide details about the market size?
The market size is estimated to be USD 321.98 million as of 2022.
5. What are some drivers contributing to market growth?
Rise in the Prevalence of Ocular Disorders and Increase in Geriatric Population; Technological Advancement.
6. What are the notable trends driving market growth?
Static segment is Expected to Hold a Significant Share Over the Forecast Period.
7. Are there any restraints impacting market growth?
High Cost of Products.
8. Can you provide examples of recent developments in the market?
N/A
9. What pricing options are available for accessing the report?
Pricing options include single-user, multi-user, and enterprise licenses priced at USD 4750, USD 5250, and USD 8750 respectively.
10. Is the market size provided in terms of value or volume?
The market size is provided in terms of value, measured in million.
11. Are there any specific market keywords associated with the report?
Yes, the market keyword associated with the report is "Global Automated Ophthalmic Perimeters Market," which aids in identifying and referencing the specific market segment covered.
12. How do I determine which pricing option suits my needs best?
The pricing options vary based on user requirements and access needs. Individual users may opt for single-user licenses, while businesses requiring broader access may choose multi-user or enterprise licenses for cost-effective access to the report.
13. Are there any additional resources or data provided in the Global Automated Ophthalmic Perimeters Market report?
While the report offers comprehensive insights, it's advisable to review the specific contents or supplementary materials provided to ascertain if additional resources or data are available.
14. How can I stay updated on further developments or reports in the Global Automated Ophthalmic Perimeters Market?
To stay informed about further developments, trends, and reports in the Global Automated Ophthalmic Perimeters Market, consider subscribing to industry newsletters, following relevant companies and organizations, or regularly checking reputable industry news sources and publications.
Methodology
Step 1 - Identification of Relevant Samples Size from Population Database


Step 2 - Approaches for Defining Global Market Size (Value, Volume* & Price*)

Note*: In applicable scenarios
Step 3 - Data Sources
Primary Research
- Web Analytics
- Survey Reports
- Research Institute
- Latest Research Reports
- Opinion Leaders
Secondary Research
- Annual Reports
- White Paper
- Latest Press Release
- Industry Association
- Paid Database
- Investor Presentations

Step 4 - Data Triangulation
Involves using different sources of information in order to increase the validity of a study
These sources are likely to be stakeholders in a program - participants, other researchers, program staff, other community members, and so on.
Then we put all data in single framework & apply various statistical tools to find out the dynamic on the market.
During the analysis stage, feedback from the stakeholder groups would be compared to determine areas of agreement as well as areas of divergence