

Key Insights
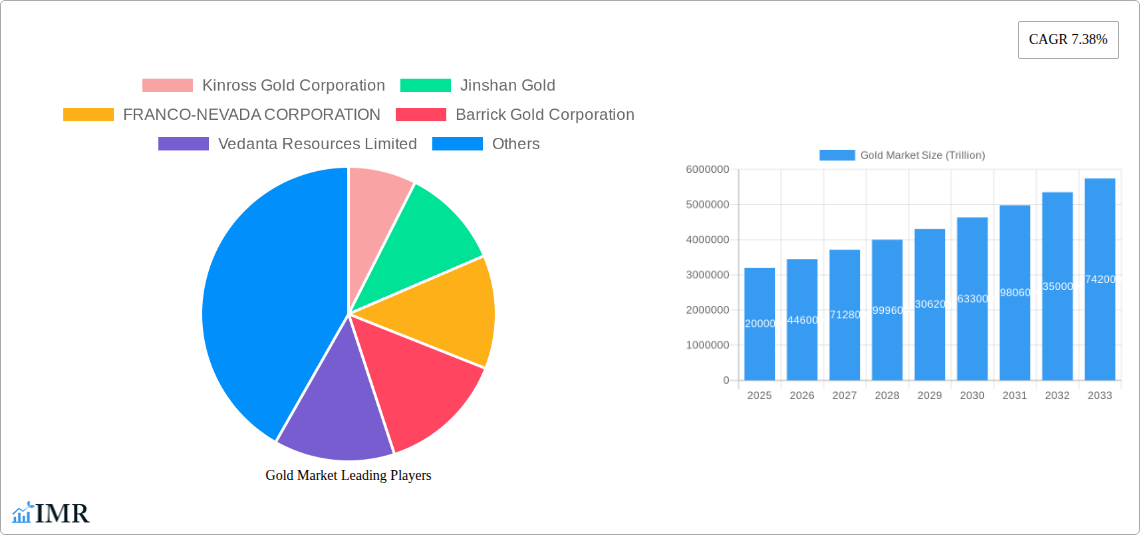
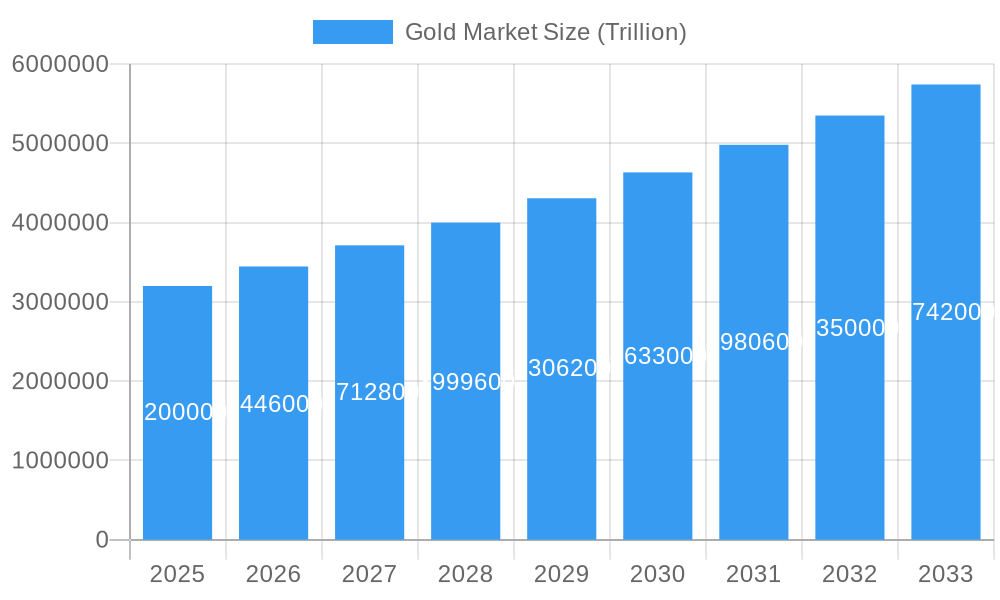
The global gold market, projected to reach $4000 billion by 2025, is forecast to expand at a Compound Annual Growth Rate (CAGR) of 7.38% through 2033. This significant growth is underpinned by robust investment demand, driven by economic uncertainty and inflation hedging. The jewelry sector remains a primary driver, with consistent demand across established and emerging markets, particularly in the Asia-Pacific region. Technological advancements, increasing gold’s utility in electronics and other high-tech applications, further contribute to market expansion. The intrinsic value of gold as a symbol of status and its critical role in specialized industries such as dentistry and aerospace also support sustained market growth. Key challenges include price volatility influenced by global economic and geopolitical factors. The market is segmented by type (alloyed, layered gold) and application (jewelry, electronics, awards, industrial). Leading companies like Barrick Gold Corporation, Newmont Corporation, and Zijin Mining Group are actively shaping the market through strategic initiatives and operational advancements.
Gold Market Market Size (In Million)
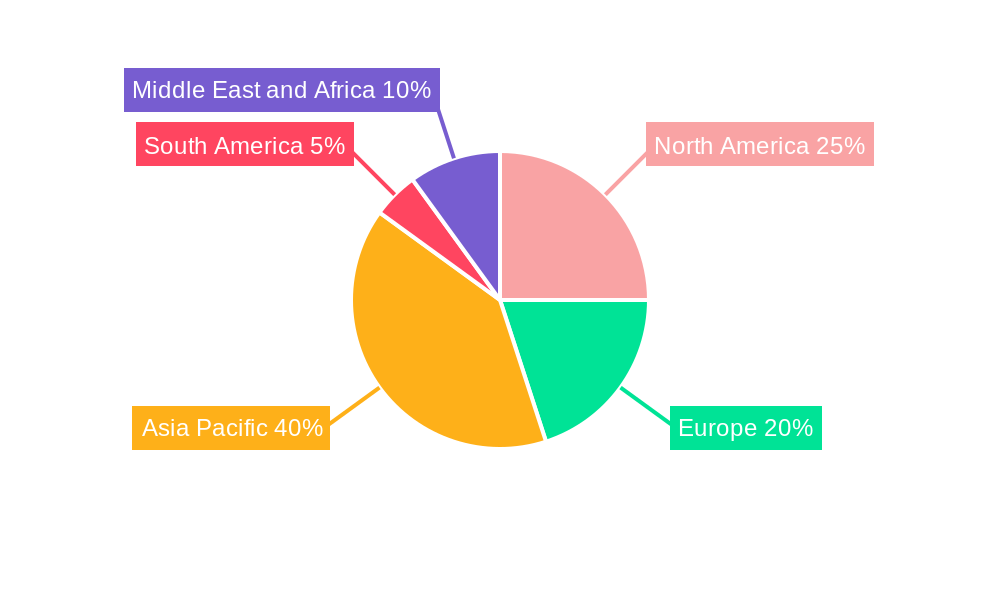
Geographically, the Asia-Pacific region leads the gold market, primarily due to strong consumer demand in India and China. North America and Europe represent substantial markets with steady growth, while South America and the Middle East & Africa offer emerging opportunities. The forecast period (2025-2033) anticipates a continuous increase in market value, propelled by consistent demand across diverse sectors and regions. Sustainable growth will depend on effective management of price fluctuations, responsible mining practices, and continued technological innovation. The competitive environment features a mix of major multinational corporations and niche players, fostering innovation and market dynamism.
Gold Market Company Market Share
Gold Market: A Comprehensive Market Report (2019-2033)
This in-depth report provides a comprehensive analysis of the global gold market, encompassing market dynamics, growth trends, regional dominance, product landscape, key players, and future outlook. The study period covers 2019-2033, with a base year of 2025 and a forecast period of 2025-2033. The report offers invaluable insights for industry professionals, investors, and anyone seeking to understand this dynamic market valued at several trillion USD.
Gold Market Dynamics & Structure
The global gold market, a multi-trillion-dollar industry, exhibits a complex interplay of factors driving its growth and evolution. Market concentration is relatively high, with a few major players controlling significant market share. However, a large number of smaller miners and refiners also contribute significantly. Technological advancements, primarily in exploration, extraction, and refining techniques, continuously enhance efficiency and reduce production costs. Stringent regulatory frameworks, varying across regions, influence production, trade, and environmental sustainability practices. The market also faces competition from substitute materials in specific applications, such as platinum or palladium in electronics. End-user demographics show a diverse range, including jewelry manufacturers, electronics companies, central banks, and investors, with shifting preferences impacting demand. Mergers and acquisitions (M&A) activity plays a crucial role in shaping the market landscape, with significant deals reshaping market shares and geographical reach.
- Market Concentration: Highly concentrated, with top 10 players controlling approximately xx% of global production.
- Technological Innovation: Focus on automation, improved extraction methods, and sustainable practices.
- Regulatory Frameworks: Vary significantly across jurisdictions, impacting production costs and environmental standards.
- Substitute Materials: Platinum, palladium, and other precious metals pose competitive challenges in specific segments.
- End-User Demographics: Jewelry, electronics, investment, and industrial applications drive demand, influenced by economic factors and consumer trends.
- M&A Activity: Significant M&A activity observed in recent years, leading to consolidation and expansion of major players. Deal volume totaled approximately xx trillion USD in the historical period (2019-2024).
Gold Market Growth Trends & Insights
The global gold market is projected to experience substantial growth over the forecast period (2025-2033). Driven by factors such as increasing industrial demand, jewelry consumption in developing economies, and investor interest as a safe-haven asset, the market exhibits a robust growth trajectory. Adoption rates in various end-use sectors vary significantly, with jewelry consistently remaining a dominant application. Technological disruptions, like advancements in recycling and 3D printing, influence both supply and demand dynamics. Consumer behavior shifts, influenced by economic conditions and changing preferences, impact demand patterns. Quantitative analysis indicates a Compound Annual Growth Rate (CAGR) of xx% during the forecast period, with market penetration expanding across various segments. Key indicators of market size evolution are analyzed, including total market value and per capita consumption.
Dominant Regions, Countries, or Segments in Gold Market
The global gold market demonstrates regional variations in growth drivers and market dominance. While China and India remain leading consumers in the jewelry segment, other regions are witnessing increased demand from various applications. Within the "By Type" segment, Alloyed Gold generally dominates due to its widespread use across applications. The "Jewellery" application segment consistently holds the largest market share, largely driven by cultural and investment preferences. Key drivers for regional dominance include economic growth, industrial development, and governmental policies supporting the mining industry.
- Leading Regions: China, India, North America, and parts of Africa demonstrate the highest consumption and production.
- Dominant Segment (By Type): Alloyed gold holds the largest market share due to its versatility in different applications.
- Dominant Segment (By Application): Jewellery consistently maintains the largest market share, followed by electronics.
- Growth Drivers: Robust economic growth in emerging markets, increasing disposable incomes, and rising demand for gold as an investment asset.
- Market Share: xx% of global gold production and consumption concentrated in top three regions (estimated).
- Growth Potential: Significant growth potential remains in developing economies and emerging applications.
Gold Market Product Landscape
The gold market encompasses a range of products, primarily categorized by purity, alloy composition, and form (bars, coins, jewelry, etc.). Recent innovations focus on enhancing the efficiency and sustainability of extraction and refining processes. Technological advancements lead to higher purity levels and improved product consistency. Product differentiation is largely based on purity, origin, and branding. Unique selling propositions frequently revolve around ethical sourcing, sustainability certifications, and unique design elements in jewellery.
Key Drivers, Barriers & Challenges in Gold Market
Key Drivers:
- Growing Investment Demand: Gold’s role as a safe-haven asset continues to drive investment, particularly during periods of economic uncertainty.
- Industrial Applications: The use of gold in electronics, medical devices, and other industries remains robust and is expected to grow.
- Jewelry Demand in Emerging Markets: Rising disposable incomes and changing consumer preferences in emerging markets fuel growth.
Key Barriers and Challenges:
- Geopolitical Risks: Political instability in key gold-producing regions can disrupt supply chains and impact prices.
- Environmental Regulations: Stricter environmental regulations can increase production costs and limit mining operations.
- Price Volatility: Fluctuations in gold prices can impact profitability for producers and investors.
- Supply Chain Disruptions: Logistics challenges and geopolitical tensions can lead to disruptions in the supply chain.
Emerging Opportunities in Gold Market
- Investment in Sustainable Mining Practices: Growing investor interest in ESG (environmental, social, and governance) factors presents opportunities for companies adopting sustainable mining methods.
- Technological Advancements in Recycling: Innovations in gold recycling technology can improve resource efficiency and reduce environmental impact.
- Expansion into New Applications: Exploration of gold in novel applications, such as nanotechnology, offers potential for future market expansion.
Growth Accelerators in the Gold Market Industry
Technological breakthroughs in exploration and extraction, coupled with strategic partnerships to secure supply chains, are key growth catalysts. Expansion strategies targeting emerging markets, especially in Asia and Africa, hold immense potential. Moreover, the increasing focus on sustainable mining practices and responsible sourcing aligns with growing consumer and investor preferences, further accelerating market growth.
Key Players Shaping the Gold Market Market
- Kinross Gold Corporation
- Jinshan Gold
- FRANCO-NEVADA CORPORATION
- Barrick Gold Corporation
- Vedanta Resources Limited
- PJSC Polyus
- Gabriel Resources Ltd
- Tertiary Minerals
- FURUKAWA CO LTD
- Johnson Matthey
- Agnico Eagle Mines Limited
- Zijin Mining Group
- New Gold Inc
- Harmony Gold Mining Company Limited
- Newmont Corporation
Notable Milestones in Gold Market Sector
- February 2023: Barrick Gold announced a 10% increase in attributable proved and probable gold mineral reserves.
- March 2023: Pan American Silver Corporation acquired Yamana Gold Inc., expanding its Latin American operations.
In-Depth Gold Market Market Outlook
The future of the gold market appears bright, driven by sustained demand from various sectors and continued technological advancements. Strategic opportunities lie in sustainable mining practices, exploring new applications, and catering to the evolving preferences of investors and consumers. The market is poised for significant growth, promising substantial returns for companies that adapt to the changing landscape and embrace innovation.
Gold Market Segmentation
-
1. Type
- 1.1. Alloyed Gold
- 1.2. Layered Gold
-
2. Application
- 2.1. Jewellery
- 2.2. Electronics
- 2.3. Awards and Status Symbols
- 2.4. Other Applications (Dentistry, Aerospace, etc.)
Gold Market Segmentation By Geography
-
1. Asia Pacific
- 1.1. China
- 1.2. India
- 1.3. Japan
- 1.4. South Korea
- 1.5. Rest of Asia Pacific
-
2. North America
- 2.1. United States
- 2.2. Canada
- 2.3. Mexico
-
3. Europe
- 3.1. Germany
- 3.2. United Kingdom
- 3.3. Italy
- 3.4. France
- 3.5. Rest of Europe
-
4. South America
- 4.1. Brazil
- 4.2. Argentina
- 4.3. Rest of South America
-
5. Middle East and Africa
- 5.1. Saudi Arabia
- 5.2. South Africa
- 5.3. Rest of Middle East and Africa
Gold Market Regional Market Share
Geographic Coverage of Gold Market
Gold Market REPORT HIGHLIGHTS
| Aspects | Details |
|---|---|
| Study Period | 2020-2034 |
| Base Year | 2025 |
| Estimated Year | 2026 |
| Forecast Period | 2026-2034 |
| Historical Period | 2020-2025 |
| Growth Rate | CAGR of 7.38% from 2020-2034 |
| Segmentation |
|
Table of Contents
- 1. Introduction
- 1.1. Research Scope
- 1.2. Market Segmentation
- 1.3. Research Objective
- 1.4. Definitions and Assumptions
- 2. Executive Summary
- 2.1. Market Snapshot
- 3. Market Dynamics
- 3.1. Market Drivers
- 3.2. Market Restrains
- 3.3. Market Trends
- 3.4. Market Opportunities
- 4. Market Factor Analysis
- 4.1. Porters Five Forces
- 4.1.1. Bargaining Power of Suppliers
- 4.1.2. Bargaining Power of Buyers
- 4.1.3. Threat of New Entrants
- 4.1.4. Threat of Substitutes
- 4.1.5. Competitive Rivalry
- 4.2. PESTEL analysis
- 4.3. BCG Analysis
- 4.3.1. Stars (High Growth, High Market Share)
- 4.3.2. Cash Cows (Low Growth, High Market Share)
- 4.3.3. Question Mark (High Growth, Low Market Share)
- 4.3.4. Dogs (Low Growth, Low Market Share)
- 4.4. Ansoff Matrix Analysis
- 4.5. Supply Chain Analysis
- 4.6. Regulatory Landscape
- 4.7. Current Market Potential and Opportunity Assessment (TAM–SAM–SOM Framework)
- 4.8. IMR Analyst Note
- 4.1. Porters Five Forces
- 5. Market Analysis, Insights and Forecast 2021-2033
- 5.1. Market Analysis, Insights and Forecast - by Type
- 5.1.1. Alloyed Gold
- 5.1.2. Layered Gold
- 5.2. Market Analysis, Insights and Forecast - by Application
- 5.2.1. Jewellery
- 5.2.2. Electronics
- 5.2.3. Awards and Status Symbols
- 5.2.4. Other Applications (Dentistry, Aerospace, etc.)
- 5.3. Market Analysis, Insights and Forecast - by Region
- 5.3.1. Asia Pacific
- 5.3.2. North America
- 5.3.3. Europe
- 5.3.4. South America
- 5.3.5. Middle East and Africa
- 5.1. Market Analysis, Insights and Forecast - by Type
- 6. Global Gold Market Analysis, Insights and Forecast, 2021-2033
- 6.1. Market Analysis, Insights and Forecast - by Type
- 6.1.1. Alloyed Gold
- 6.1.2. Layered Gold
- 6.2. Market Analysis, Insights and Forecast - by Application
- 6.2.1. Jewellery
- 6.2.2. Electronics
- 6.2.3. Awards and Status Symbols
- 6.2.4. Other Applications (Dentistry, Aerospace, etc.)
- 6.1. Market Analysis, Insights and Forecast - by Type
- 7. Asia Pacific Gold Market Analysis, Insights and Forecast, 2020-2032
- 7.1. Market Analysis, Insights and Forecast - by Type
- 7.1.1. Alloyed Gold
- 7.1.2. Layered Gold
- 7.2. Market Analysis, Insights and Forecast - by Application
- 7.2.1. Jewellery
- 7.2.2. Electronics
- 7.2.3. Awards and Status Symbols
- 7.2.4. Other Applications (Dentistry, Aerospace, etc.)
- 7.1. Market Analysis, Insights and Forecast - by Type
- 8. North America Gold Market Analysis, Insights and Forecast, 2020-2032
- 8.1. Market Analysis, Insights and Forecast - by Type
- 8.1.1. Alloyed Gold
- 8.1.2. Layered Gold
- 8.2. Market Analysis, Insights and Forecast - by Application
- 8.2.1. Jewellery
- 8.2.2. Electronics
- 8.2.3. Awards and Status Symbols
- 8.2.4. Other Applications (Dentistry, Aerospace, etc.)
- 8.1. Market Analysis, Insights and Forecast - by Type
- 9. Europe Gold Market Analysis, Insights and Forecast, 2020-2032
- 9.1. Market Analysis, Insights and Forecast - by Type
- 9.1.1. Alloyed Gold
- 9.1.2. Layered Gold
- 9.2. Market Analysis, Insights and Forecast - by Application
- 9.2.1. Jewellery
- 9.2.2. Electronics
- 9.2.3. Awards and Status Symbols
- 9.2.4. Other Applications (Dentistry, Aerospace, etc.)
- 9.1. Market Analysis, Insights and Forecast - by Type
- 10. South America Gold Market Analysis, Insights and Forecast, 2020-2032
- 10.1. Market Analysis, Insights and Forecast - by Type
- 10.1.1. Alloyed Gold
- 10.1.2. Layered Gold
- 10.2. Market Analysis, Insights and Forecast - by Application
- 10.2.1. Jewellery
- 10.2.2. Electronics
- 10.2.3. Awards and Status Symbols
- 10.2.4. Other Applications (Dentistry, Aerospace, etc.)
- 10.1. Market Analysis, Insights and Forecast - by Type
- 11. Middle East and Africa Gold Market Analysis, Insights and Forecast, 2020-2032
- 11.1. Market Analysis, Insights and Forecast - by Type
- 11.1.1. Alloyed Gold
- 11.1.2. Layered Gold
- 11.2. Market Analysis, Insights and Forecast - by Application
- 11.2.1. Jewellery
- 11.2.2. Electronics
- 11.2.3. Awards and Status Symbols
- 11.2.4. Other Applications (Dentistry, Aerospace, etc.)
- 11.1. Market Analysis, Insights and Forecast - by Type
- 12. Competitive Analysis
- 12.1. Company Profiles
- 12.1.1 Kinross Gold Corporation
- 12.1.1.1. Company Overview
- 12.1.1.2. Products
- 12.1.1.3. Company Financials
- 12.1.1.4. SWOT Analysis
- 12.1.2 Jinshan Gold
- 12.1.2.1. Company Overview
- 12.1.2.2. Products
- 12.1.2.3. Company Financials
- 12.1.2.4. SWOT Analysis
- 12.1.3 FRANCO-NEVADA CORPORATION
- 12.1.3.1. Company Overview
- 12.1.3.2. Products
- 12.1.3.3. Company Financials
- 12.1.3.4. SWOT Analysis
- 12.1.4 Barrick Gold Corporation
- 12.1.4.1. Company Overview
- 12.1.4.2. Products
- 12.1.4.3. Company Financials
- 12.1.4.4. SWOT Analysis
- 12.1.5 Vedanta Resources Limited
- 12.1.5.1. Company Overview
- 12.1.5.2. Products
- 12.1.5.3. Company Financials
- 12.1.5.4. SWOT Analysis
- 12.1.6 PJSC Polyus
- 12.1.6.1. Company Overview
- 12.1.6.2. Products
- 12.1.6.3. Company Financials
- 12.1.6.4. SWOT Analysis
- 12.1.7 Gabriel Resources Ltd
- 12.1.7.1. Company Overview
- 12.1.7.2. Products
- 12.1.7.3. Company Financials
- 12.1.7.4. SWOT Analysis
- 12.1.8 Tertiary Minerals
- 12.1.8.1. Company Overview
- 12.1.8.2. Products
- 12.1.8.3. Company Financials
- 12.1.8.4. SWOT Analysis
- 12.1.9 FURUKAWA CO LTD
- 12.1.9.1. Company Overview
- 12.1.9.2. Products
- 12.1.9.3. Company Financials
- 12.1.9.4. SWOT Analysis
- 12.1.10 Johnson Matthey
- 12.1.10.1. Company Overview
- 12.1.10.2. Products
- 12.1.10.3. Company Financials
- 12.1.10.4. SWOT Analysis
- 12.1.11 Agnico Eagle Mines Limited
- 12.1.11.1. Company Overview
- 12.1.11.2. Products
- 12.1.11.3. Company Financials
- 12.1.11.4. SWOT Analysis
- 12.1.12 Zijin Mining Group*List Not Exhaustive
- 12.1.12.1. Company Overview
- 12.1.12.2. Products
- 12.1.12.3. Company Financials
- 12.1.12.4. SWOT Analysis
- 12.1.13 New Gold Inc
- 12.1.13.1. Company Overview
- 12.1.13.2. Products
- 12.1.13.3. Company Financials
- 12.1.13.4. SWOT Analysis
- 12.1.14 Harmony Gold Mining Company Limited
- 12.1.14.1. Company Overview
- 12.1.14.2. Products
- 12.1.14.3. Company Financials
- 12.1.14.4. SWOT Analysis
- 12.1.15 Newmont Corporation
- 12.1.15.1. Company Overview
- 12.1.15.2. Products
- 12.1.15.3. Company Financials
- 12.1.15.4. SWOT Analysis
- 12.1.1 Kinross Gold Corporation
- 12.2. Market Entropy
- 12.2.1 Company's Key Areas Served
- 12.2.2 Recent Developments
- 12.3. Company Market Share Analysis 2025
- 12.3.1 Top 5 Companies Market Share Analysis
- 12.3.2 Top 3 Companies Market Share Analysis
- 12.4. List of Potential Customers
- 13. Research Methodology
List of Figures
- Figure 1: Global Gold Market Revenue Breakdown (billion, %) by Region 2025 & 2033
- Figure 2: Global Gold Market Volume Breakdown (kilotons, %) by Region 2025 & 2033
- Figure 3: Asia Pacific Gold Market Revenue (billion), by Type 2025 & 2033
- Figure 4: Asia Pacific Gold Market Volume (kilotons), by Type 2025 & 2033
- Figure 5: Asia Pacific Gold Market Revenue Share (%), by Type 2025 & 2033
- Figure 6: Asia Pacific Gold Market Volume Share (%), by Type 2025 & 2033
- Figure 7: Asia Pacific Gold Market Revenue (billion), by Application 2025 & 2033
- Figure 8: Asia Pacific Gold Market Volume (kilotons), by Application 2025 & 2033
- Figure 9: Asia Pacific Gold Market Revenue Share (%), by Application 2025 & 2033
- Figure 10: Asia Pacific Gold Market Volume Share (%), by Application 2025 & 2033
- Figure 11: Asia Pacific Gold Market Revenue (billion), by Country 2025 & 2033
- Figure 12: Asia Pacific Gold Market Volume (kilotons), by Country 2025 & 2033
- Figure 13: Asia Pacific Gold Market Revenue Share (%), by Country 2025 & 2033
- Figure 14: Asia Pacific Gold Market Volume Share (%), by Country 2025 & 2033
- Figure 15: North America Gold Market Revenue (billion), by Type 2025 & 2033
- Figure 16: North America Gold Market Volume (kilotons), by Type 2025 & 2033
- Figure 17: North America Gold Market Revenue Share (%), by Type 2025 & 2033
- Figure 18: North America Gold Market Volume Share (%), by Type 2025 & 2033
- Figure 19: North America Gold Market Revenue (billion), by Application 2025 & 2033
- Figure 20: North America Gold Market Volume (kilotons), by Application 2025 & 2033
- Figure 21: North America Gold Market Revenue Share (%), by Application 2025 & 2033
- Figure 22: North America Gold Market Volume Share (%), by Application 2025 & 2033
- Figure 23: North America Gold Market Revenue (billion), by Country 2025 & 2033
- Figure 24: North America Gold Market Volume (kilotons), by Country 2025 & 2033
- Figure 25: North America Gold Market Revenue Share (%), by Country 2025 & 2033
- Figure 26: North America Gold Market Volume Share (%), by Country 2025 & 2033
- Figure 27: Europe Gold Market Revenue (billion), by Type 2025 & 2033
- Figure 28: Europe Gold Market Volume (kilotons), by Type 2025 & 2033
- Figure 29: Europe Gold Market Revenue Share (%), by Type 2025 & 2033
- Figure 30: Europe Gold Market Volume Share (%), by Type 2025 & 2033
- Figure 31: Europe Gold Market Revenue (billion), by Application 2025 & 2033
- Figure 32: Europe Gold Market Volume (kilotons), by Application 2025 & 2033
- Figure 33: Europe Gold Market Revenue Share (%), by Application 2025 & 2033
- Figure 34: Europe Gold Market Volume Share (%), by Application 2025 & 2033
- Figure 35: Europe Gold Market Revenue (billion), by Country 2025 & 2033
- Figure 36: Europe Gold Market Volume (kilotons), by Country 2025 & 2033
- Figure 37: Europe Gold Market Revenue Share (%), by Country 2025 & 2033
- Figure 38: Europe Gold Market Volume Share (%), by Country 2025 & 2033
- Figure 39: South America Gold Market Revenue (billion), by Type 2025 & 2033
- Figure 40: South America Gold Market Volume (kilotons), by Type 2025 & 2033
- Figure 41: South America Gold Market Revenue Share (%), by Type 2025 & 2033
- Figure 42: South America Gold Market Volume Share (%), by Type 2025 & 2033
- Figure 43: South America Gold Market Revenue (billion), by Application 2025 & 2033
- Figure 44: South America Gold Market Volume (kilotons), by Application 2025 & 2033
- Figure 45: South America Gold Market Revenue Share (%), by Application 2025 & 2033
- Figure 46: South America Gold Market Volume Share (%), by Application 2025 & 2033
- Figure 47: South America Gold Market Revenue (billion), by Country 2025 & 2033
- Figure 48: South America Gold Market Volume (kilotons), by Country 2025 & 2033
- Figure 49: South America Gold Market Revenue Share (%), by Country 2025 & 2033
- Figure 50: South America Gold Market Volume Share (%), by Country 2025 & 2033
- Figure 51: Middle East and Africa Gold Market Revenue (billion), by Type 2025 & 2033
- Figure 52: Middle East and Africa Gold Market Volume (kilotons), by Type 2025 & 2033
- Figure 53: Middle East and Africa Gold Market Revenue Share (%), by Type 2025 & 2033
- Figure 54: Middle East and Africa Gold Market Volume Share (%), by Type 2025 & 2033
- Figure 55: Middle East and Africa Gold Market Revenue (billion), by Application 2025 & 2033
- Figure 56: Middle East and Africa Gold Market Volume (kilotons), by Application 2025 & 2033
- Figure 57: Middle East and Africa Gold Market Revenue Share (%), by Application 2025 & 2033
- Figure 58: Middle East and Africa Gold Market Volume Share (%), by Application 2025 & 2033
- Figure 59: Middle East and Africa Gold Market Revenue (billion), by Country 2025 & 2033
- Figure 60: Middle East and Africa Gold Market Volume (kilotons), by Country 2025 & 2033
- Figure 61: Middle East and Africa Gold Market Revenue Share (%), by Country 2025 & 2033
- Figure 62: Middle East and Africa Gold Market Volume Share (%), by Country 2025 & 2033
List of Tables
- Table 1: Global Gold Market Revenue billion Forecast, by Type 2020 & 2033
- Table 2: Global Gold Market Volume kilotons Forecast, by Type 2020 & 2033
- Table 3: Global Gold Market Revenue billion Forecast, by Application 2020 & 2033
- Table 4: Global Gold Market Volume kilotons Forecast, by Application 2020 & 2033
- Table 5: Global Gold Market Revenue billion Forecast, by Region 2020 & 2033
- Table 6: Global Gold Market Volume kilotons Forecast, by Region 2020 & 2033
- Table 7: Global Gold Market Revenue billion Forecast, by Type 2020 & 2033
- Table 8: Global Gold Market Volume kilotons Forecast, by Type 2020 & 2033
- Table 9: Global Gold Market Revenue billion Forecast, by Application 2020 & 2033
- Table 10: Global Gold Market Volume kilotons Forecast, by Application 2020 & 2033
- Table 11: Global Gold Market Revenue billion Forecast, by Country 2020 & 2033
- Table 12: Global Gold Market Volume kilotons Forecast, by Country 2020 & 2033
- Table 13: China Gold Market Revenue (billion) Forecast, by Application 2020 & 2033
- Table 14: China Gold Market Volume (kilotons) Forecast, by Application 2020 & 2033
- Table 15: India Gold Market Revenue (billion) Forecast, by Application 2020 & 2033
- Table 16: India Gold Market Volume (kilotons) Forecast, by Application 2020 & 2033
- Table 17: Japan Gold Market Revenue (billion) Forecast, by Application 2020 & 2033
- Table 18: Japan Gold Market Volume (kilotons) Forecast, by Application 2020 & 2033
- Table 19: South Korea Gold Market Revenue (billion) Forecast, by Application 2020 & 2033
- Table 20: South Korea Gold Market Volume (kilotons) Forecast, by Application 2020 & 2033
- Table 21: Rest of Asia Pacific Gold Market Revenue (billion) Forecast, by Application 2020 & 2033
- Table 22: Rest of Asia Pacific Gold Market Volume (kilotons) Forecast, by Application 2020 & 2033
- Table 23: Global Gold Market Revenue billion Forecast, by Type 2020 & 2033
- Table 24: Global Gold Market Volume kilotons Forecast, by Type 2020 & 2033
- Table 25: Global Gold Market Revenue billion Forecast, by Application 2020 & 2033
- Table 26: Global Gold Market Volume kilotons Forecast, by Application 2020 & 2033
- Table 27: Global Gold Market Revenue billion Forecast, by Country 2020 & 2033
- Table 28: Global Gold Market Volume kilotons Forecast, by Country 2020 & 2033
- Table 29: United States Gold Market Revenue (billion) Forecast, by Application 2020 & 2033
- Table 30: United States Gold Market Volume (kilotons) Forecast, by Application 2020 & 2033
- Table 31: Canada Gold Market Revenue (billion) Forecast, by Application 2020 & 2033
- Table 32: Canada Gold Market Volume (kilotons) Forecast, by Application 2020 & 2033
- Table 33: Mexico Gold Market Revenue (billion) Forecast, by Application 2020 & 2033
- Table 34: Mexico Gold Market Volume (kilotons) Forecast, by Application 2020 & 2033
- Table 35: Global Gold Market Revenue billion Forecast, by Type 2020 & 2033
- Table 36: Global Gold Market Volume kilotons Forecast, by Type 2020 & 2033
- Table 37: Global Gold Market Revenue billion Forecast, by Application 2020 & 2033
- Table 38: Global Gold Market Volume kilotons Forecast, by Application 2020 & 2033
- Table 39: Global Gold Market Revenue billion Forecast, by Country 2020 & 2033
- Table 40: Global Gold Market Volume kilotons Forecast, by Country 2020 & 2033
- Table 41: Germany Gold Market Revenue (billion) Forecast, by Application 2020 & 2033
- Table 42: Germany Gold Market Volume (kilotons) Forecast, by Application 2020 & 2033
- Table 43: United Kingdom Gold Market Revenue (billion) Forecast, by Application 2020 & 2033
- Table 44: United Kingdom Gold Market Volume (kilotons) Forecast, by Application 2020 & 2033
- Table 45: Italy Gold Market Revenue (billion) Forecast, by Application 2020 & 2033
- Table 46: Italy Gold Market Volume (kilotons) Forecast, by Application 2020 & 2033
- Table 47: France Gold Market Revenue (billion) Forecast, by Application 2020 & 2033
- Table 48: France Gold Market Volume (kilotons) Forecast, by Application 2020 & 2033
- Table 49: Rest of Europe Gold Market Revenue (billion) Forecast, by Application 2020 & 2033
- Table 50: Rest of Europe Gold Market Volume (kilotons) Forecast, by Application 2020 & 2033
- Table 51: Global Gold Market Revenue billion Forecast, by Type 2020 & 2033
- Table 52: Global Gold Market Volume kilotons Forecast, by Type 2020 & 2033
- Table 53: Global Gold Market Revenue billion Forecast, by Application 2020 & 2033
- Table 54: Global Gold Market Volume kilotons Forecast, by Application 2020 & 2033
- Table 55: Global Gold Market Revenue billion Forecast, by Country 2020 & 2033
- Table 56: Global Gold Market Volume kilotons Forecast, by Country 2020 & 2033
- Table 57: Brazil Gold Market Revenue (billion) Forecast, by Application 2020 & 2033
- Table 58: Brazil Gold Market Volume (kilotons) Forecast, by Application 2020 & 2033
- Table 59: Argentina Gold Market Revenue (billion) Forecast, by Application 2020 & 2033
- Table 60: Argentina Gold Market Volume (kilotons) Forecast, by Application 2020 & 2033
- Table 61: Rest of South America Gold Market Revenue (billion) Forecast, by Application 2020 & 2033
- Table 62: Rest of South America Gold Market Volume (kilotons) Forecast, by Application 2020 & 2033
- Table 63: Global Gold Market Revenue billion Forecast, by Type 2020 & 2033
- Table 64: Global Gold Market Volume kilotons Forecast, by Type 2020 & 2033
- Table 65: Global Gold Market Revenue billion Forecast, by Application 2020 & 2033
- Table 66: Global Gold Market Volume kilotons Forecast, by Application 2020 & 2033
- Table 67: Global Gold Market Revenue billion Forecast, by Country 2020 & 2033
- Table 68: Global Gold Market Volume kilotons Forecast, by Country 2020 & 2033
- Table 69: Saudi Arabia Gold Market Revenue (billion) Forecast, by Application 2020 & 2033
- Table 70: Saudi Arabia Gold Market Volume (kilotons) Forecast, by Application 2020 & 2033
- Table 71: South Africa Gold Market Revenue (billion) Forecast, by Application 2020 & 2033
- Table 72: South Africa Gold Market Volume (kilotons) Forecast, by Application 2020 & 2033
- Table 73: Rest of Middle East and Africa Gold Market Revenue (billion) Forecast, by Application 2020 & 2033
- Table 74: Rest of Middle East and Africa Gold Market Volume (kilotons) Forecast, by Application 2020 & 2033
Frequently Asked Questions
1. What is the projected Compound Annual Growth Rate (CAGR) of the Gold Market?
The projected CAGR is approximately 7.38%.
2. Which companies are prominent players in the Gold Market?
Key companies in the market include Kinross Gold Corporation, Jinshan Gold, FRANCO-NEVADA CORPORATION, Barrick Gold Corporation, Vedanta Resources Limited, PJSC Polyus, Gabriel Resources Ltd, Tertiary Minerals, FURUKAWA CO LTD, Johnson Matthey, Agnico Eagle Mines Limited, Zijin Mining Group*List Not Exhaustive, New Gold Inc, Harmony Gold Mining Company Limited, Newmont Corporation.
3. What are the main segments of the Gold Market?
The market segments include Type, Application.
4. Can you provide details about the market size?
The market size is estimated to be USD 4000 billion as of 2022.
5. What are some drivers contributing to market growth?
Demand for Gold in the form of Jewelry and Long-term Savings; Increasing Consumption in High-End Electronics Applications; Other Drivers.
6. What are the notable trends driving market growth?
Jewelry Segment to Dominate the Demand.
7. Are there any restraints impacting market growth?
Declining Ore Grades and Other Technical Challenges; Other Restraints.
8. Can you provide examples of recent developments in the market?
March 2023: Pan American Silver Corporation acquired all the issued and outstanding common shares of Yamana Gold Inc., as part of the arrangement, which includes its mines and increased the geographical operations of the company in Latin America.
9. What pricing options are available for accessing the report?
Pricing options include single-user, multi-user, and enterprise licenses priced at USD 4750, USD 5250, and USD 8750 respectively.
10. Is the market size provided in terms of value or volume?
The market size is provided in terms of value, measured in billion and volume, measured in kilotons.
11. Are there any specific market keywords associated with the report?
Yes, the market keyword associated with the report is "Gold Market," which aids in identifying and referencing the specific market segment covered.
12. How do I determine which pricing option suits my needs best?
The pricing options vary based on user requirements and access needs. Individual users may opt for single-user licenses, while businesses requiring broader access may choose multi-user or enterprise licenses for cost-effective access to the report.
13. Are there any additional resources or data provided in the Gold Market report?
While the report offers comprehensive insights, it's advisable to review the specific contents or supplementary materials provided to ascertain if additional resources or data are available.
14. How can I stay updated on further developments or reports in the Gold Market?
To stay informed about further developments, trends, and reports in the Gold Market, consider subscribing to industry newsletters, following relevant companies and organizations, or regularly checking reputable industry news sources and publications.
Methodology
Step 1 - Identification of Relevant Samples Size from Population Database


Step 2 - Approaches for Defining Global Market Size (Value, Volume* & Price*)

Note*: In applicable scenarios
Step 3 - Data Sources
Primary Research
- Web Analytics
- Survey Reports
- Research Institute
- Latest Research Reports
- Opinion Leaders
Secondary Research
- Annual Reports
- White Paper
- Latest Press Release
- Industry Association
- Paid Database
- Investor Presentations

Step 4 - Data Triangulation
Involves using different sources of information in order to increase the validity of a study
These sources are likely to be stakeholders in a program - participants, other researchers, program staff, other community members, and so on.
Then we put all data in single framework & apply various statistical tools to find out the dynamic on the market.
During the analysis stage, feedback from the stakeholder groups would be compared to determine areas of agreement as well as areas of divergence