

Key Insights
The global Green and Bio Polyols Market is poised for significant expansion, projected to reach a market size of approximately $18,500 million by 2033, driven by a robust CAGR exceeding 5.00%. This growth is predominantly fueled by increasing environmental consciousness among consumers and regulatory pressures to adopt sustainable materials across various industries. Key drivers include the rising demand for eco-friendly alternatives to traditional petroleum-based polyols, particularly in sectors like automotive, building and construction, and furniture, where polyols are integral to the production of foams, coatings, adhesives, and sealants. The inherent benefits of bio-based polyols, such as reduced carbon footprint and biodegradability, are increasingly being recognized, positioning them as a critical component in the transition towards a circular economy.
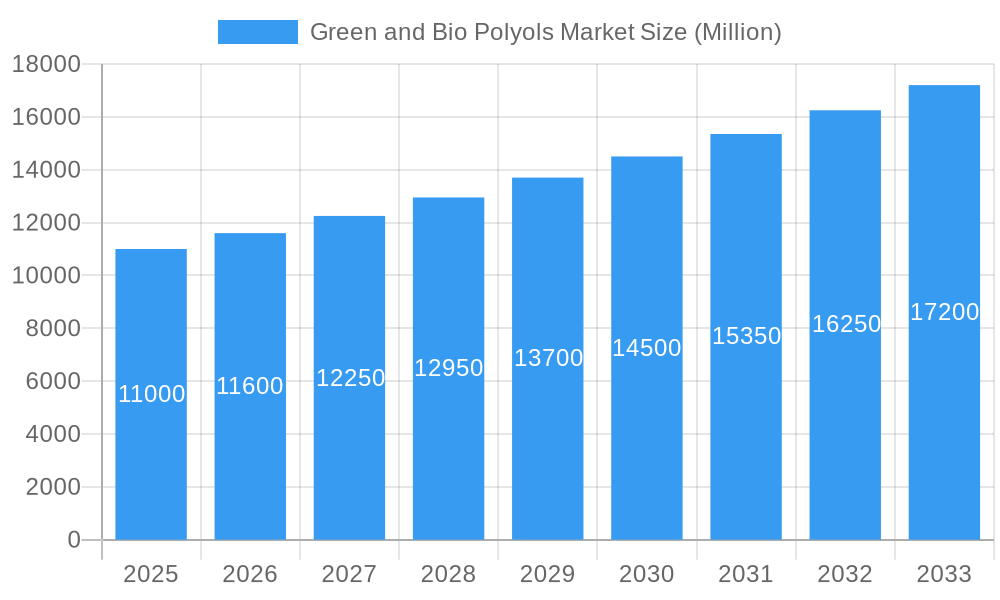
Green and Bio Polyols Market Market Size (In Billion)
Further bolstering the market's trajectory are the evolving trends in material innovation and an expanding array of applications for green and bio polyols. Advancements in processing technologies are leading to improved performance characteristics and cost-competitiveness, making these sustainable alternatives more attractive to manufacturers. The market is segmented primarily by material type, with Polyether Polyols and Polyester Polyols representing significant segments, and by end-user industries, where Automotive and Building and Construction are expected to lead demand. Despite challenges such as feedstock availability and price volatility for certain raw materials, the overarching shift towards sustainability and the proactive strategies adopted by key players like BASF SE, Huntsman International LLC, and Cargill Inc. are expected to overcome these restraints and pave the way for sustained market growth through the forecast period ending in 2033.
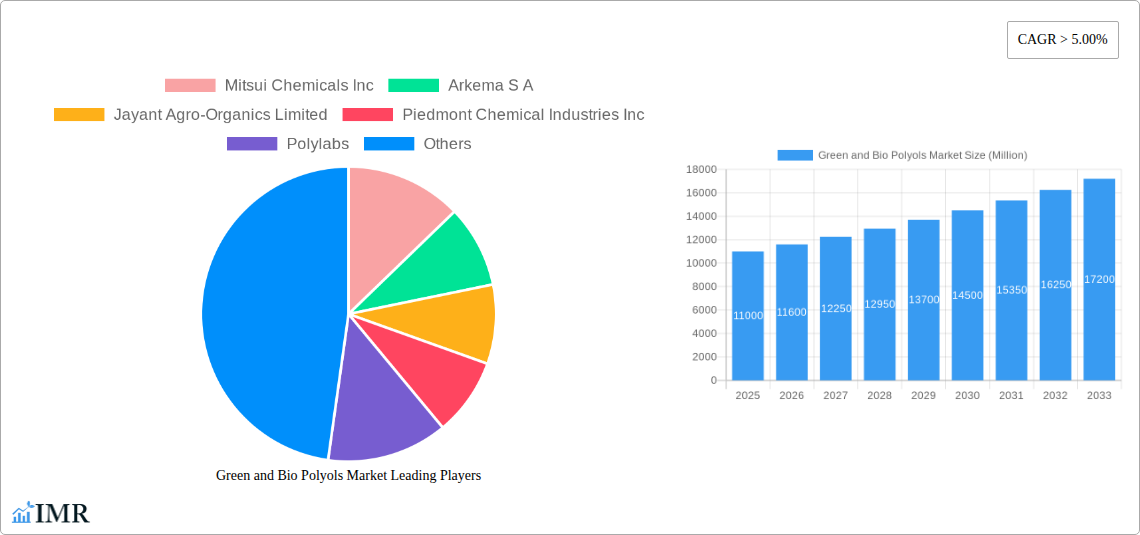
Green and Bio Polyols Market Company Market Share
Green and Bio Polyols Market: Sustainable Solutions for a Circular Economy (2019-2033)
This comprehensive report delves into the dynamic Green and Bio Polyols Market, a critical segment within the broader Polyols Market. We analyze the evolving landscape driven by increasing demand for sustainable materials, stringent environmental regulations, and advancements in bio-based chemistry. The report forecasts the market's growth trajectory from 2025 (base and estimated year) through 2033, building upon historical data from 2019–2024. Explore market size evolution, CAGR, and penetration rates, with key insights into Polyether Polyols, Polyester Polyols, and Other Types, across vital end-user industries like Automotive, Building and Construction, Furniture, and Packaging. Discover key players, notable milestones, and emerging opportunities shaping this rapidly expanding sector. All quantitative values are presented in Million Units.
Green and Bio Polyols Market Market Dynamics & Structure
The Green and Bio Polyols Market is characterized by moderate to high concentration, with a few dominant players holding significant market share, yet a growing number of smaller enterprises and startups are fostering innovation. Technological innovation is a primary driver, fueled by extensive R&D in renewable feedstock utilization, enzymatic processing, and novel bio-polymerization techniques. Regulatory frameworks, such as government mandates for recycled content, carbon footprint reduction targets, and bans on certain petrochemical-based products, are increasingly shaping market entry and product development strategies. Competitive product substitutes include conventional petrochemical-based polyols, which still hold a cost advantage in certain applications, creating a barrier for widespread adoption of bio-based alternatives. End-user demographics are shifting towards environmentally conscious consumers and corporations seeking to enhance their sustainability credentials. Mergers and acquisitions (M&A) trends are on the rise as larger chemical companies aim to secure bio-based technologies and expand their sustainable product portfolios.
- Market Concentration: Approximately 60% of the market share is held by the top 5-7 companies.
- Technological Innovation Drivers: Focus on cost-effectiveness of bio-feedstocks, improved performance characteristics, and scalability of production processes.
- Regulatory Frameworks: Government incentives for bio-based product development and increasing pressure to meet ESG (Environmental, Social, and Governance) goals.
- Competitive Product Substitutes: Traditional petroleum-based polyols remain a significant competitor due to established infrastructure and historical cost advantages.
- End-User Demographics: Growing demand from industries and consumers prioritizing sustainability and reduced environmental impact.
- M&A Trends: Strategic acquisitions and partnerships to gain access to proprietary bio-based technologies and expand product offerings.
- Innovation Barriers: High initial investment costs for bio-based production facilities and the need for consistent supply of high-quality renewable raw materials.
Green and Bio Polyols Market Growth Trends & Insights
The Green and Bio Polyols Market is poised for significant expansion, driven by a global imperative for sustainability and a tangible shift in consumer and industrial preferences towards eco-friendly materials. The market size is projected to witness robust growth, with an estimated market size of $8,500 million in 2025, escalating to $17,200 million by 2033, exhibiting a Compound Annual Growth Rate (CAGR) of approximately 9.2%. This upward trend is indicative of increasing adoption rates across various end-user industries, as businesses actively seek to decarbonize their supply chains and offer greener products. Technological disruptions are playing a pivotal role, with advancements in the extraction and processing of renewable feedstocks like plant oils, agricultural waste, and algae enabling the production of polyols with comparable or even superior performance characteristics to their petrochemical counterparts. These innovations are not only making bio-polyols more cost-competitive but also expanding their application spectrum. Consumer behavior shifts are a powerful catalyst, with a growing awareness of the environmental impact of conventional materials driving demand for sustainable alternatives in everyday products, from furniture and packaging to automotive components and building insulation. This evolving consumer consciousness translates into increased purchasing power for bio-based products, compelling manufacturers to invest heavily in green polyol technologies. Furthermore, the inherent circularity offered by bio-based materials, which can be derived from renewable resources and potentially biodegraded or recycled, aligns perfectly with the growing global focus on a circular economy model. The increasing corporate sustainability goals and the pressure from investors to demonstrate tangible progress in reducing environmental footprints are further accelerating the adoption of green and bio polyols. The development of novel bio-polyol formulations tailored for specific high-performance applications, such as in advanced composites and energy-efficient building materials, is also contributing to market penetration.
Dominant Regions, Countries, or Segments in Green and Bio Polyols Market
The Automotive end-user industry is currently the dominant segment driving growth in the Green and Bio Polyols Market, with an estimated market share of 28% in 2025. This leadership is attributed to the automotive sector's significant push towards lightweighting, reduced emissions, and the incorporation of sustainable materials to meet stringent environmental regulations and consumer demand for eco-friendly vehicles. The development of bio-based polyols for seating foam, interior components, and lightweight composite parts offers a compelling solution for automakers seeking to enhance fuel efficiency and reduce their carbon footprint.
Key drivers for the automotive sector's dominance include:
- Stringent Emission Standards: Governments worldwide are implementing stricter emissions regulations, compelling automakers to adopt lighter and more sustainable materials.
- Consumer Demand for Sustainability: A growing segment of car buyers actively seeks vehicles with a lower environmental impact, influencing manufacturer choices.
- Lightweighting Initiatives: Bio-polyols contribute to reducing vehicle weight, leading to improved fuel economy and lower CO2 emissions.
- Corporate Sustainability Goals: Major automotive manufacturers have set ambitious targets for reducing their environmental impact, often including increased use of bio-based materials.
- Advancements in Bio-Composite Materials: The development of high-performance bio-composites utilizing bio-polyols is opening new avenues for their application in structural and semi-structural automotive components.
Geographically, North America and Europe are the leading regions, accounting for a combined market share of approximately 55% in 2025. This dominance is fueled by robust regulatory support, a well-established research and development infrastructure, and a strong consumer and industrial inclination towards sustainability.
- North America: Benefits from government initiatives promoting bio-based products, significant R&D investments, and a large automotive and construction industry actively seeking sustainable solutions.
- Europe: Driven by ambitious climate targets, the European Green Deal, and a highly aware consumer base, leading to strong demand for bio-based materials in various sectors.
Within Material Type, Polyether Polyols are expected to hold the largest market share, estimated at 45% in 2025, due to their versatility and widespread use in flexible and rigid foam applications, which are prevalent in the dominant automotive and building and construction sectors. However, Polyester Polyols are witnessing rapid growth due to their superior mechanical properties and increasing use in specialized applications within these key industries.
Green and Bio Polyols Market Product Landscape
The Green and Bio Polyols Market is characterized by a diverse and evolving product landscape focused on sustainability and enhanced performance. Innovations are centered on utilizing a wider array of renewable feedstocks, including vegetable oils (soybean, castor, palm), agricultural by-products, and even waste streams, to produce polyols for various applications. Key advancements include the development of bio-polyols with improved thermal insulation properties for building and construction, enhanced durability and flexibility for automotive seating and interiors, and specialized formulations for biodegradable packaging solutions. The performance metrics being optimized include, but are not limited to, mechanical strength, thermal resistance, flame retardancy, and UV stability, ensuring that bio-based alternatives can effectively replace or even outperform conventional petrochemical polyols. Unique selling propositions revolve around reduced carbon footprint, biodegradability, and support for a circular economy, making these products highly attractive to environmentally conscious manufacturers and consumers.
Key Drivers, Barriers & Challenges in Green and Bio Polyols Market
Key Drivers:
The Green and Bio Polyols Market is propelled by several significant drivers. Foremost among these is the escalating global demand for sustainable and eco-friendly materials, spurred by heightened environmental awareness and increasing consumer preference for green products. Stringent government regulations and policies promoting the use of bio-based content and reducing carbon emissions act as powerful catalysts. Technological advancements in bio-refining and polymerization processes are making bio-polyols more cost-competitive and performance-oriented, expanding their applicability. The automotive industry's drive for lightweighting and reduced environmental impact, coupled with the building and construction sector's focus on energy efficiency and sustainable building materials, further fuels demand.
Barriers & Challenges:
Despite the positive outlook, the market faces considerable barriers and challenges. The higher initial cost of production compared to conventional petrochemical polyols remains a significant hurdle, impacting market penetration. The availability and consistent supply of high-quality renewable feedstocks can be variable, influenced by agricultural yields and market fluctuations. Scaling up production facilities for bio-polyols requires substantial capital investment. Regulatory inconsistencies and the need for clear labeling standards for bio-based products can create confusion. Competition from established petrochemical polyol manufacturers with existing infrastructure and economies of scale poses another challenge. Furthermore, ensuring the performance equivalence or superiority of bio-polyols in all demanding applications requires continuous R&D.
Emerging Opportunities in Green and Bio Polyols Market
Emerging opportunities in the Green and Bio Polyols Market are abundant and point towards significant future growth. The untapped potential in developing nations, where sustainability awareness is rising and economic growth presents opportunities for new material adoption, is considerable. Innovative applications in niche sectors like medical devices, where biocompatibility and biodegradability are paramount, offer a promising avenue. The increasing demand for high-performance, bio-based adhesives and coatings is another area ripe for expansion. Furthermore, the development of advanced bio-polyols derived from waste streams, such as food waste or forestry residues, aligns with circular economy principles and presents a cost-effective and environmentally sound opportunity. Evolving consumer preferences for transparent and traceable supply chains will also create opportunities for bio-polyol manufacturers who can demonstrate their commitment to sustainable sourcing and production.
Growth Accelerators in the Green and Bio Polyols Market Industry
Several factors are acting as strong accelerators for long-term growth in the Green and Bio Polyols Market. Technological breakthroughs in enzyme catalysis and fermentation processes are enabling more efficient and cost-effective conversion of biomass into polyols. Strategic partnerships and collaborations between feedstock suppliers, polyol manufacturers, and end-user industries are fostering innovation and accelerating market adoption. Investments in research and development are leading to the creation of new bio-polyol grades with enhanced properties tailored for specific high-value applications, such as in aerospace and advanced electronics. Market expansion strategies, including a focus on geographical diversification into regions with growing environmental consciousness and supportive policies, are also contributing to accelerated growth. The increasing integration of life cycle assessment (LCA) into product development and marketing is further solidifying the market's sustainable credentials, attracting environmentally responsible businesses and investors.
Key Players Shaping the Green and Bio Polyols Market Market
- BASF SE
- Huntsman International LLC
- Cargill Inc
- Arkema S A
- Mitsui Chemicals Inc
- Emery Oleochemicals
- Jayant Agro-Organics Limited
- Piedmont Chemical Industries Inc
- Polylabs
- Kemipex
- Bayer
Notable Milestones in Green and Bio Polyols Market Sector
- 2023: BASF SE launched a new line of bio-based polyols for automotive applications, achieving a significant reduction in carbon footprint.
- 2023: Cargill Inc. expanded its portfolio of bio-based polyols derived from soybean oil, targeting the furniture and bedding industries.
- 2022: Arkema S A acquired a specialty bio-polyol producer, strengthening its position in sustainable materials for coatings and adhesives.
- 2022: Huntsman International LLC announced significant investments in R&D for novel bio-polyol technologies with enhanced performance characteristics.
- 2021: Jayant Agro-Organics Limited reported increased production capacity for castor oil-based polyols, catering to growing demand.
- 2021: A consortium of European companies launched a project focused on developing advanced bio-polyols from agricultural waste streams.
- 2020: Piedmont Chemical Industries Inc. introduced a new range of polyester polyols with a high percentage of recycled content.
- 2019: Emery Oleochemicals developed innovative bio-based polyols for use in lubricants and functional fluids.
In-Depth Green and Bio Polyols Market Market Outlook
The future outlook for the Green and Bio Polyols Market is exceptionally promising, driven by sustained global momentum towards sustainability and the circular economy. Growth accelerators, including cutting-edge biotechnological advancements, strategic industry collaborations, and a growing appetite for high-performance bio-based materials, will continue to shape this trajectory. The market is set to witness an increased penetration of bio-polyols in high-value applications across automotive, construction, and packaging sectors, further solidifying their position as viable and often superior alternatives to petrochemical-based products. Emerging opportunities in untapped geographical markets and innovative product development, particularly from waste-derived feedstocks, will unlock new revenue streams. Overall, the Green and Bio Polyols Market is on a robust growth path, aligning with global environmental goals and evolving industrial demands.
Green and Bio Polyols Market Segmentation
-
1. Material Type
- 1.1. Polyether Polyols
- 1.2. Polyester Polyols
- 1.3. Other Types
-
2. End-user Industry
- 2.1. Automotive
- 2.2. Building and Construction
- 2.3. Furniture
- 2.4. Packaging
- 2.5. Other End-user Industries
Green and Bio Polyols Market Segmentation By Geography
-
1. Asia Pacific
- 1.1. China
- 1.2. India
- 1.3. Japan
- 1.4. South Korea
- 1.5. Rest of Asia Pacific
-
2. North America
- 2.1. United States
- 2.2. Canada
- 2.3. Mexico
-
3. Europe
- 3.1. Germany
- 3.2. United Kingdom
- 3.3. France
- 3.4. Italy
- 3.5. Rest of Europe
-
4. South America
- 4.1. Brazil
- 4.2. Argentina
- 4.3. Rest of South America
-
5. Middle East and Africa
- 5.1. Saudi Arabia
- 5.2. South Africa
- 5.3. Rest of Middle East and Africa
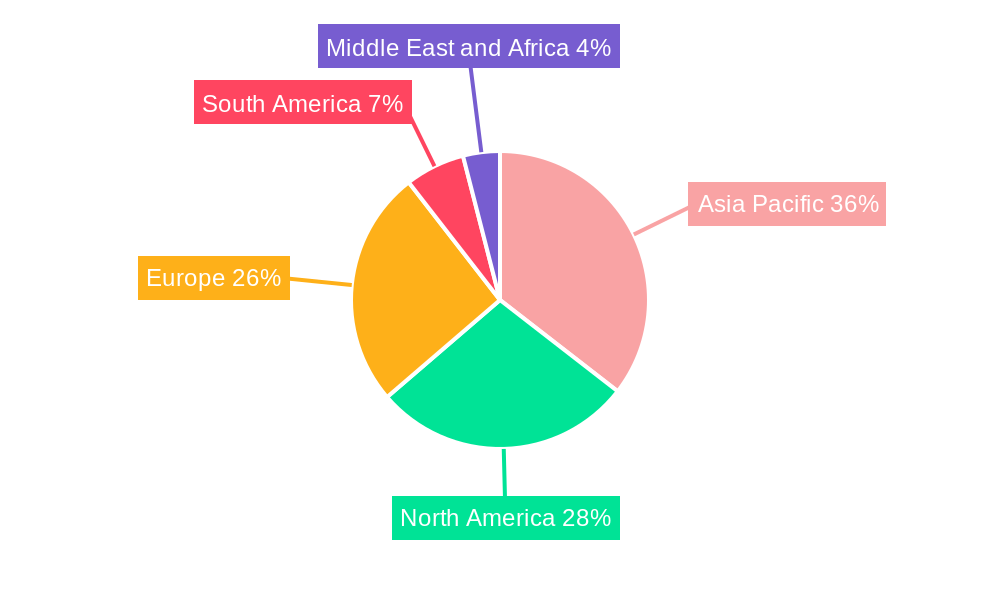
Green and Bio Polyols Market Regional Market Share
Geographic Coverage of Green and Bio Polyols Market
Green and Bio Polyols Market REPORT HIGHLIGHTS
| Aspects | Details |
|---|---|
| Study Period | 2020-2034 |
| Base Year | 2025 |
| Estimated Year | 2026 |
| Forecast Period | 2026-2034 |
| Historical Period | 2020-2025 |
| Growth Rate | CAGR of 9.4% from 2020-2034 |
| Segmentation |
|
Table of Contents
- 1. Introduction
- 1.1. Research Scope
- 1.2. Market Segmentation
- 1.3. Research Objective
- 1.4. Definitions and Assumptions
- 2. Executive Summary
- 2.1. Market Snapshot
- 3. Market Dynamics
- 3.1. Market Drivers
- 3.2. Market Restrains
- 3.3. Market Trends
- 3.4. Market Opportunities
- 4. Market Factor Analysis
- 4.1. Porters Five Forces
- 4.1.1. Bargaining Power of Suppliers
- 4.1.2. Bargaining Power of Buyers
- 4.1.3. Threat of New Entrants
- 4.1.4. Threat of Substitutes
- 4.1.5. Competitive Rivalry
- 4.2. PESTEL analysis
- 4.3. BCG Analysis
- 4.3.1. Stars (High Growth, High Market Share)
- 4.3.2. Cash Cows (Low Growth, High Market Share)
- 4.3.3. Question Mark (High Growth, Low Market Share)
- 4.3.4. Dogs (Low Growth, Low Market Share)
- 4.4. Ansoff Matrix Analysis
- 4.5. Supply Chain Analysis
- 4.6. Regulatory Landscape
- 4.7. Current Market Potential and Opportunity Assessment (TAM–SAM–SOM Framework)
- 4.8. IMR Analyst Note
- 4.1. Porters Five Forces
- 5. Market Analysis, Insights and Forecast 2021-2033
- 5.1. Market Analysis, Insights and Forecast - by Material Type
- 5.1.1. Polyether Polyols
- 5.1.2. Polyester Polyols
- 5.1.3. Other Types
- 5.2. Market Analysis, Insights and Forecast - by End-user Industry
- 5.2.1. Automotive
- 5.2.2. Building and Construction
- 5.2.3. Furniture
- 5.2.4. Packaging
- 5.2.5. Other End-user Industries
- 5.3. Market Analysis, Insights and Forecast - by Region
- 5.3.1. Asia Pacific
- 5.3.2. North America
- 5.3.3. Europe
- 5.3.4. South America
- 5.3.5. Middle East and Africa
- 5.1. Market Analysis, Insights and Forecast - by Material Type
- 6. Global Green and Bio Polyols Market Analysis, Insights and Forecast, 2021-2033
- 6.1. Market Analysis, Insights and Forecast - by Material Type
- 6.1.1. Polyether Polyols
- 6.1.2. Polyester Polyols
- 6.1.3. Other Types
- 6.2. Market Analysis, Insights and Forecast - by End-user Industry
- 6.2.1. Automotive
- 6.2.2. Building and Construction
- 6.2.3. Furniture
- 6.2.4. Packaging
- 6.2.5. Other End-user Industries
- 6.1. Market Analysis, Insights and Forecast - by Material Type
- 7. Asia Pacific Green and Bio Polyols Market Analysis, Insights and Forecast, 2020-2032
- 7.1. Market Analysis, Insights and Forecast - by Material Type
- 7.1.1. Polyether Polyols
- 7.1.2. Polyester Polyols
- 7.1.3. Other Types
- 7.2. Market Analysis, Insights and Forecast - by End-user Industry
- 7.2.1. Automotive
- 7.2.2. Building and Construction
- 7.2.3. Furniture
- 7.2.4. Packaging
- 7.2.5. Other End-user Industries
- 7.1. Market Analysis, Insights and Forecast - by Material Type
- 8. North America Green and Bio Polyols Market Analysis, Insights and Forecast, 2020-2032
- 8.1. Market Analysis, Insights and Forecast - by Material Type
- 8.1.1. Polyether Polyols
- 8.1.2. Polyester Polyols
- 8.1.3. Other Types
- 8.2. Market Analysis, Insights and Forecast - by End-user Industry
- 8.2.1. Automotive
- 8.2.2. Building and Construction
- 8.2.3. Furniture
- 8.2.4. Packaging
- 8.2.5. Other End-user Industries
- 8.1. Market Analysis, Insights and Forecast - by Material Type
- 9. Europe Green and Bio Polyols Market Analysis, Insights and Forecast, 2020-2032
- 9.1. Market Analysis, Insights and Forecast - by Material Type
- 9.1.1. Polyether Polyols
- 9.1.2. Polyester Polyols
- 9.1.3. Other Types
- 9.2. Market Analysis, Insights and Forecast - by End-user Industry
- 9.2.1. Automotive
- 9.2.2. Building and Construction
- 9.2.3. Furniture
- 9.2.4. Packaging
- 9.2.5. Other End-user Industries
- 9.1. Market Analysis, Insights and Forecast - by Material Type
- 10. South America Green and Bio Polyols Market Analysis, Insights and Forecast, 2020-2032
- 10.1. Market Analysis, Insights and Forecast - by Material Type
- 10.1.1. Polyether Polyols
- 10.1.2. Polyester Polyols
- 10.1.3. Other Types
- 10.2. Market Analysis, Insights and Forecast - by End-user Industry
- 10.2.1. Automotive
- 10.2.2. Building and Construction
- 10.2.3. Furniture
- 10.2.4. Packaging
- 10.2.5. Other End-user Industries
- 10.1. Market Analysis, Insights and Forecast - by Material Type
- 11. Middle East and Africa Green and Bio Polyols Market Analysis, Insights and Forecast, 2020-2032
- 11.1. Market Analysis, Insights and Forecast - by Material Type
- 11.1.1. Polyether Polyols
- 11.1.2. Polyester Polyols
- 11.1.3. Other Types
- 11.2. Market Analysis, Insights and Forecast - by End-user Industry
- 11.2.1. Automotive
- 11.2.2. Building and Construction
- 11.2.3. Furniture
- 11.2.4. Packaging
- 11.2.5. Other End-user Industries
- 11.1. Market Analysis, Insights and Forecast - by Material Type
- 12. Competitive Analysis
- 12.1. Company Profiles
- 12.1.1 Mitsui Chemicals Inc
- 12.1.1.1. Company Overview
- 12.1.1.2. Products
- 12.1.1.3. Company Financials
- 12.1.1.4. SWOT Analysis
- 12.1.2 Arkema S A
- 12.1.2.1. Company Overview
- 12.1.2.2. Products
- 12.1.2.3. Company Financials
- 12.1.2.4. SWOT Analysis
- 12.1.3 Jayant Agro-Organics Limited
- 12.1.3.1. Company Overview
- 12.1.3.2. Products
- 12.1.3.3. Company Financials
- 12.1.3.4. SWOT Analysis
- 12.1.4 Piedmont Chemical Industries Inc
- 12.1.4.1. Company Overview
- 12.1.4.2. Products
- 12.1.4.3. Company Financials
- 12.1.4.4. SWOT Analysis
- 12.1.5 Polylabs
- 12.1.5.1. Company Overview
- 12.1.5.2. Products
- 12.1.5.3. Company Financials
- 12.1.5.4. SWOT Analysis
- 12.1.6 Kemipex
- 12.1.6.1. Company Overview
- 12.1.6.2. Products
- 12.1.6.3. Company Financials
- 12.1.6.4. SWOT Analysis
- 12.1.7 Emery Oleochemicals
- 12.1.7.1. Company Overview
- 12.1.7.2. Products
- 12.1.7.3. Company Financials
- 12.1.7.4. SWOT Analysis
- 12.1.8 BASF SE
- 12.1.8.1. Company Overview
- 12.1.8.2. Products
- 12.1.8.3. Company Financials
- 12.1.8.4. SWOT Analysis
- 12.1.9 Huntsman International LLC
- 12.1.9.1. Company Overview
- 12.1.9.2. Products
- 12.1.9.3. Company Financials
- 12.1.9.4. SWOT Analysis
- 12.1.10 Cargill Inc
- 12.1.10.1. Company Overview
- 12.1.10.2. Products
- 12.1.10.3. Company Financials
- 12.1.10.4. SWOT Analysis
- 12.1.11 Bayer
- 12.1.11.1. Company Overview
- 12.1.11.2. Products
- 12.1.11.3. Company Financials
- 12.1.11.4. SWOT Analysis
- 12.1.1 Mitsui Chemicals Inc
- 12.2. Market Entropy
- 12.2.1 Company's Key Areas Served
- 12.2.2 Recent Developments
- 12.3. Company Market Share Analysis 2025
- 12.3.1 Top 5 Companies Market Share Analysis
- 12.3.2 Top 3 Companies Market Share Analysis
- 12.4. List of Potential Customers
- 13. Research Methodology
List of Figures
- Figure 1: Global Green and Bio Polyols Market Revenue Breakdown (billion, %) by Region 2025 & 2033
- Figure 2: Global Green and Bio Polyols Market Volume Breakdown (K Tons, %) by Region 2025 & 2033
- Figure 3: Asia Pacific Green and Bio Polyols Market Revenue (billion), by Material Type 2025 & 2033
- Figure 4: Asia Pacific Green and Bio Polyols Market Volume (K Tons), by Material Type 2025 & 2033
- Figure 5: Asia Pacific Green and Bio Polyols Market Revenue Share (%), by Material Type 2025 & 2033
- Figure 6: Asia Pacific Green and Bio Polyols Market Volume Share (%), by Material Type 2025 & 2033
- Figure 7: Asia Pacific Green and Bio Polyols Market Revenue (billion), by End-user Industry 2025 & 2033
- Figure 8: Asia Pacific Green and Bio Polyols Market Volume (K Tons), by End-user Industry 2025 & 2033
- Figure 9: Asia Pacific Green and Bio Polyols Market Revenue Share (%), by End-user Industry 2025 & 2033
- Figure 10: Asia Pacific Green and Bio Polyols Market Volume Share (%), by End-user Industry 2025 & 2033
- Figure 11: Asia Pacific Green and Bio Polyols Market Revenue (billion), by Country 2025 & 2033
- Figure 12: Asia Pacific Green and Bio Polyols Market Volume (K Tons), by Country 2025 & 2033
- Figure 13: Asia Pacific Green and Bio Polyols Market Revenue Share (%), by Country 2025 & 2033
- Figure 14: Asia Pacific Green and Bio Polyols Market Volume Share (%), by Country 2025 & 2033
- Figure 15: North America Green and Bio Polyols Market Revenue (billion), by Material Type 2025 & 2033
- Figure 16: North America Green and Bio Polyols Market Volume (K Tons), by Material Type 2025 & 2033
- Figure 17: North America Green and Bio Polyols Market Revenue Share (%), by Material Type 2025 & 2033
- Figure 18: North America Green and Bio Polyols Market Volume Share (%), by Material Type 2025 & 2033
- Figure 19: North America Green and Bio Polyols Market Revenue (billion), by End-user Industry 2025 & 2033
- Figure 20: North America Green and Bio Polyols Market Volume (K Tons), by End-user Industry 2025 & 2033
- Figure 21: North America Green and Bio Polyols Market Revenue Share (%), by End-user Industry 2025 & 2033
- Figure 22: North America Green and Bio Polyols Market Volume Share (%), by End-user Industry 2025 & 2033
- Figure 23: North America Green and Bio Polyols Market Revenue (billion), by Country 2025 & 2033
- Figure 24: North America Green and Bio Polyols Market Volume (K Tons), by Country 2025 & 2033
- Figure 25: North America Green and Bio Polyols Market Revenue Share (%), by Country 2025 & 2033
- Figure 26: North America Green and Bio Polyols Market Volume Share (%), by Country 2025 & 2033
- Figure 27: Europe Green and Bio Polyols Market Revenue (billion), by Material Type 2025 & 2033
- Figure 28: Europe Green and Bio Polyols Market Volume (K Tons), by Material Type 2025 & 2033
- Figure 29: Europe Green and Bio Polyols Market Revenue Share (%), by Material Type 2025 & 2033
- Figure 30: Europe Green and Bio Polyols Market Volume Share (%), by Material Type 2025 & 2033
- Figure 31: Europe Green and Bio Polyols Market Revenue (billion), by End-user Industry 2025 & 2033
- Figure 32: Europe Green and Bio Polyols Market Volume (K Tons), by End-user Industry 2025 & 2033
- Figure 33: Europe Green and Bio Polyols Market Revenue Share (%), by End-user Industry 2025 & 2033
- Figure 34: Europe Green and Bio Polyols Market Volume Share (%), by End-user Industry 2025 & 2033
- Figure 35: Europe Green and Bio Polyols Market Revenue (billion), by Country 2025 & 2033
- Figure 36: Europe Green and Bio Polyols Market Volume (K Tons), by Country 2025 & 2033
- Figure 37: Europe Green and Bio Polyols Market Revenue Share (%), by Country 2025 & 2033
- Figure 38: Europe Green and Bio Polyols Market Volume Share (%), by Country 2025 & 2033
- Figure 39: South America Green and Bio Polyols Market Revenue (billion), by Material Type 2025 & 2033
- Figure 40: South America Green and Bio Polyols Market Volume (K Tons), by Material Type 2025 & 2033
- Figure 41: South America Green and Bio Polyols Market Revenue Share (%), by Material Type 2025 & 2033
- Figure 42: South America Green and Bio Polyols Market Volume Share (%), by Material Type 2025 & 2033
- Figure 43: South America Green and Bio Polyols Market Revenue (billion), by End-user Industry 2025 & 2033
- Figure 44: South America Green and Bio Polyols Market Volume (K Tons), by End-user Industry 2025 & 2033
- Figure 45: South America Green and Bio Polyols Market Revenue Share (%), by End-user Industry 2025 & 2033
- Figure 46: South America Green and Bio Polyols Market Volume Share (%), by End-user Industry 2025 & 2033
- Figure 47: South America Green and Bio Polyols Market Revenue (billion), by Country 2025 & 2033
- Figure 48: South America Green and Bio Polyols Market Volume (K Tons), by Country 2025 & 2033
- Figure 49: South America Green and Bio Polyols Market Revenue Share (%), by Country 2025 & 2033
- Figure 50: South America Green and Bio Polyols Market Volume Share (%), by Country 2025 & 2033
- Figure 51: Middle East and Africa Green and Bio Polyols Market Revenue (billion), by Material Type 2025 & 2033
- Figure 52: Middle East and Africa Green and Bio Polyols Market Volume (K Tons), by Material Type 2025 & 2033
- Figure 53: Middle East and Africa Green and Bio Polyols Market Revenue Share (%), by Material Type 2025 & 2033
- Figure 54: Middle East and Africa Green and Bio Polyols Market Volume Share (%), by Material Type 2025 & 2033
- Figure 55: Middle East and Africa Green and Bio Polyols Market Revenue (billion), by End-user Industry 2025 & 2033
- Figure 56: Middle East and Africa Green and Bio Polyols Market Volume (K Tons), by End-user Industry 2025 & 2033
- Figure 57: Middle East and Africa Green and Bio Polyols Market Revenue Share (%), by End-user Industry 2025 & 2033
- Figure 58: Middle East and Africa Green and Bio Polyols Market Volume Share (%), by End-user Industry 2025 & 2033
- Figure 59: Middle East and Africa Green and Bio Polyols Market Revenue (billion), by Country 2025 & 2033
- Figure 60: Middle East and Africa Green and Bio Polyols Market Volume (K Tons), by Country 2025 & 2033
- Figure 61: Middle East and Africa Green and Bio Polyols Market Revenue Share (%), by Country 2025 & 2033
- Figure 62: Middle East and Africa Green and Bio Polyols Market Volume Share (%), by Country 2025 & 2033
List of Tables
- Table 1: Global Green and Bio Polyols Market Revenue billion Forecast, by Material Type 2020 & 2033
- Table 2: Global Green and Bio Polyols Market Volume K Tons Forecast, by Material Type 2020 & 2033
- Table 3: Global Green and Bio Polyols Market Revenue billion Forecast, by End-user Industry 2020 & 2033
- Table 4: Global Green and Bio Polyols Market Volume K Tons Forecast, by End-user Industry 2020 & 2033
- Table 5: Global Green and Bio Polyols Market Revenue billion Forecast, by Region 2020 & 2033
- Table 6: Global Green and Bio Polyols Market Volume K Tons Forecast, by Region 2020 & 2033
- Table 7: Global Green and Bio Polyols Market Revenue billion Forecast, by Material Type 2020 & 2033
- Table 8: Global Green and Bio Polyols Market Volume K Tons Forecast, by Material Type 2020 & 2033
- Table 9: Global Green and Bio Polyols Market Revenue billion Forecast, by End-user Industry 2020 & 2033
- Table 10: Global Green and Bio Polyols Market Volume K Tons Forecast, by End-user Industry 2020 & 2033
- Table 11: Global Green and Bio Polyols Market Revenue billion Forecast, by Country 2020 & 2033
- Table 12: Global Green and Bio Polyols Market Volume K Tons Forecast, by Country 2020 & 2033
- Table 13: China Green and Bio Polyols Market Revenue (billion) Forecast, by Application 2020 & 2033
- Table 14: China Green and Bio Polyols Market Volume (K Tons) Forecast, by Application 2020 & 2033
- Table 15: India Green and Bio Polyols Market Revenue (billion) Forecast, by Application 2020 & 2033
- Table 16: India Green and Bio Polyols Market Volume (K Tons) Forecast, by Application 2020 & 2033
- Table 17: Japan Green and Bio Polyols Market Revenue (billion) Forecast, by Application 2020 & 2033
- Table 18: Japan Green and Bio Polyols Market Volume (K Tons) Forecast, by Application 2020 & 2033
- Table 19: South Korea Green and Bio Polyols Market Revenue (billion) Forecast, by Application 2020 & 2033
- Table 20: South Korea Green and Bio Polyols Market Volume (K Tons) Forecast, by Application 2020 & 2033
- Table 21: Rest of Asia Pacific Green and Bio Polyols Market Revenue (billion) Forecast, by Application 2020 & 2033
- Table 22: Rest of Asia Pacific Green and Bio Polyols Market Volume (K Tons) Forecast, by Application 2020 & 2033
- Table 23: Global Green and Bio Polyols Market Revenue billion Forecast, by Material Type 2020 & 2033
- Table 24: Global Green and Bio Polyols Market Volume K Tons Forecast, by Material Type 2020 & 2033
- Table 25: Global Green and Bio Polyols Market Revenue billion Forecast, by End-user Industry 2020 & 2033
- Table 26: Global Green and Bio Polyols Market Volume K Tons Forecast, by End-user Industry 2020 & 2033
- Table 27: Global Green and Bio Polyols Market Revenue billion Forecast, by Country 2020 & 2033
- Table 28: Global Green and Bio Polyols Market Volume K Tons Forecast, by Country 2020 & 2033
- Table 29: United States Green and Bio Polyols Market Revenue (billion) Forecast, by Application 2020 & 2033
- Table 30: United States Green and Bio Polyols Market Volume (K Tons) Forecast, by Application 2020 & 2033
- Table 31: Canada Green and Bio Polyols Market Revenue (billion) Forecast, by Application 2020 & 2033
- Table 32: Canada Green and Bio Polyols Market Volume (K Tons) Forecast, by Application 2020 & 2033
- Table 33: Mexico Green and Bio Polyols Market Revenue (billion) Forecast, by Application 2020 & 2033
- Table 34: Mexico Green and Bio Polyols Market Volume (K Tons) Forecast, by Application 2020 & 2033
- Table 35: Global Green and Bio Polyols Market Revenue billion Forecast, by Material Type 2020 & 2033
- Table 36: Global Green and Bio Polyols Market Volume K Tons Forecast, by Material Type 2020 & 2033
- Table 37: Global Green and Bio Polyols Market Revenue billion Forecast, by End-user Industry 2020 & 2033
- Table 38: Global Green and Bio Polyols Market Volume K Tons Forecast, by End-user Industry 2020 & 2033
- Table 39: Global Green and Bio Polyols Market Revenue billion Forecast, by Country 2020 & 2033
- Table 40: Global Green and Bio Polyols Market Volume K Tons Forecast, by Country 2020 & 2033
- Table 41: Germany Green and Bio Polyols Market Revenue (billion) Forecast, by Application 2020 & 2033
- Table 42: Germany Green and Bio Polyols Market Volume (K Tons) Forecast, by Application 2020 & 2033
- Table 43: United Kingdom Green and Bio Polyols Market Revenue (billion) Forecast, by Application 2020 & 2033
- Table 44: United Kingdom Green and Bio Polyols Market Volume (K Tons) Forecast, by Application 2020 & 2033
- Table 45: France Green and Bio Polyols Market Revenue (billion) Forecast, by Application 2020 & 2033
- Table 46: France Green and Bio Polyols Market Volume (K Tons) Forecast, by Application 2020 & 2033
- Table 47: Italy Green and Bio Polyols Market Revenue (billion) Forecast, by Application 2020 & 2033
- Table 48: Italy Green and Bio Polyols Market Volume (K Tons) Forecast, by Application 2020 & 2033
- Table 49: Rest of Europe Green and Bio Polyols Market Revenue (billion) Forecast, by Application 2020 & 2033
- Table 50: Rest of Europe Green and Bio Polyols Market Volume (K Tons) Forecast, by Application 2020 & 2033
- Table 51: Global Green and Bio Polyols Market Revenue billion Forecast, by Material Type 2020 & 2033
- Table 52: Global Green and Bio Polyols Market Volume K Tons Forecast, by Material Type 2020 & 2033
- Table 53: Global Green and Bio Polyols Market Revenue billion Forecast, by End-user Industry 2020 & 2033
- Table 54: Global Green and Bio Polyols Market Volume K Tons Forecast, by End-user Industry 2020 & 2033
- Table 55: Global Green and Bio Polyols Market Revenue billion Forecast, by Country 2020 & 2033
- Table 56: Global Green and Bio Polyols Market Volume K Tons Forecast, by Country 2020 & 2033
- Table 57: Brazil Green and Bio Polyols Market Revenue (billion) Forecast, by Application 2020 & 2033
- Table 58: Brazil Green and Bio Polyols Market Volume (K Tons) Forecast, by Application 2020 & 2033
- Table 59: Argentina Green and Bio Polyols Market Revenue (billion) Forecast, by Application 2020 & 2033
- Table 60: Argentina Green and Bio Polyols Market Volume (K Tons) Forecast, by Application 2020 & 2033
- Table 61: Rest of South America Green and Bio Polyols Market Revenue (billion) Forecast, by Application 2020 & 2033
- Table 62: Rest of South America Green and Bio Polyols Market Volume (K Tons) Forecast, by Application 2020 & 2033
- Table 63: Global Green and Bio Polyols Market Revenue billion Forecast, by Material Type 2020 & 2033
- Table 64: Global Green and Bio Polyols Market Volume K Tons Forecast, by Material Type 2020 & 2033
- Table 65: Global Green and Bio Polyols Market Revenue billion Forecast, by End-user Industry 2020 & 2033
- Table 66: Global Green and Bio Polyols Market Volume K Tons Forecast, by End-user Industry 2020 & 2033
- Table 67: Global Green and Bio Polyols Market Revenue billion Forecast, by Country 2020 & 2033
- Table 68: Global Green and Bio Polyols Market Volume K Tons Forecast, by Country 2020 & 2033
- Table 69: Saudi Arabia Green and Bio Polyols Market Revenue (billion) Forecast, by Application 2020 & 2033
- Table 70: Saudi Arabia Green and Bio Polyols Market Volume (K Tons) Forecast, by Application 2020 & 2033
- Table 71: South Africa Green and Bio Polyols Market Revenue (billion) Forecast, by Application 2020 & 2033
- Table 72: South Africa Green and Bio Polyols Market Volume (K Tons) Forecast, by Application 2020 & 2033
- Table 73: Rest of Middle East and Africa Green and Bio Polyols Market Revenue (billion) Forecast, by Application 2020 & 2033
- Table 74: Rest of Middle East and Africa Green and Bio Polyols Market Volume (K Tons) Forecast, by Application 2020 & 2033
Frequently Asked Questions
1. What is the projected Compound Annual Growth Rate (CAGR) of the Green and Bio Polyols Market?
The projected CAGR is approximately 9.4%.
2. Which companies are prominent players in the Green and Bio Polyols Market?
Key companies in the market include Mitsui Chemicals Inc, Arkema S A, Jayant Agro-Organics Limited, Piedmont Chemical Industries Inc, Polylabs, Kemipex, Emery Oleochemicals, BASF SE, Huntsman International LLC, Cargill Inc, Bayer.
3. What are the main segments of the Green and Bio Polyols Market?
The market segments include Material Type, End-user Industry.
4. Can you provide details about the market size?
The market size is estimated to be USD 5.65 billion as of 2022.
5. What are some drivers contributing to market growth?
; Increasing Applications for Bio-Friendly Organic Compounds; Growing Demand from the Construction Industry.
6. What are the notable trends driving market growth?
Growing Demand from Construction and Automotive Sectors.
7. Are there any restraints impacting market growth?
; High cost and Impact of COVID-19; Other Restraints.
8. Can you provide examples of recent developments in the market?
N/A
9. What pricing options are available for accessing the report?
Pricing options include single-user, multi-user, and enterprise licenses priced at USD 4750, USD 5250, and USD 8750 respectively.
10. Is the market size provided in terms of value or volume?
The market size is provided in terms of value, measured in billion and volume, measured in K Tons.
11. Are there any specific market keywords associated with the report?
Yes, the market keyword associated with the report is "Green and Bio Polyols Market," which aids in identifying and referencing the specific market segment covered.
12. How do I determine which pricing option suits my needs best?
The pricing options vary based on user requirements and access needs. Individual users may opt for single-user licenses, while businesses requiring broader access may choose multi-user or enterprise licenses for cost-effective access to the report.
13. Are there any additional resources or data provided in the Green and Bio Polyols Market report?
While the report offers comprehensive insights, it's advisable to review the specific contents or supplementary materials provided to ascertain if additional resources or data are available.
14. How can I stay updated on further developments or reports in the Green and Bio Polyols Market?
To stay informed about further developments, trends, and reports in the Green and Bio Polyols Market, consider subscribing to industry newsletters, following relevant companies and organizations, or regularly checking reputable industry news sources and publications.
Methodology
Step 1 - Identification of Relevant Samples Size from Population Database


Step 2 - Approaches for Defining Global Market Size (Value, Volume* & Price*)

Note*: In applicable scenarios
Step 3 - Data Sources
Primary Research
- Web Analytics
- Survey Reports
- Research Institute
- Latest Research Reports
- Opinion Leaders
Secondary Research
- Annual Reports
- White Paper
- Latest Press Release
- Industry Association
- Paid Database
- Investor Presentations

Step 4 - Data Triangulation
Involves using different sources of information in order to increase the validity of a study
These sources are likely to be stakeholders in a program - participants, other researchers, program staff, other community members, and so on.
Then we put all data in single framework & apply various statistical tools to find out the dynamic on the market.
During the analysis stage, feedback from the stakeholder groups would be compared to determine areas of agreement as well as areas of divergence