

Key Insights
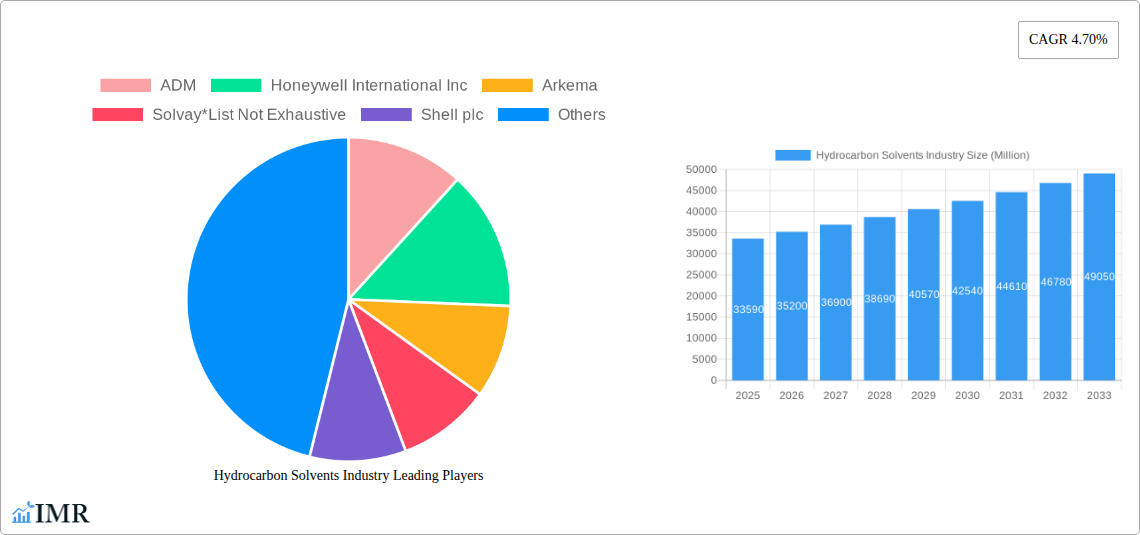
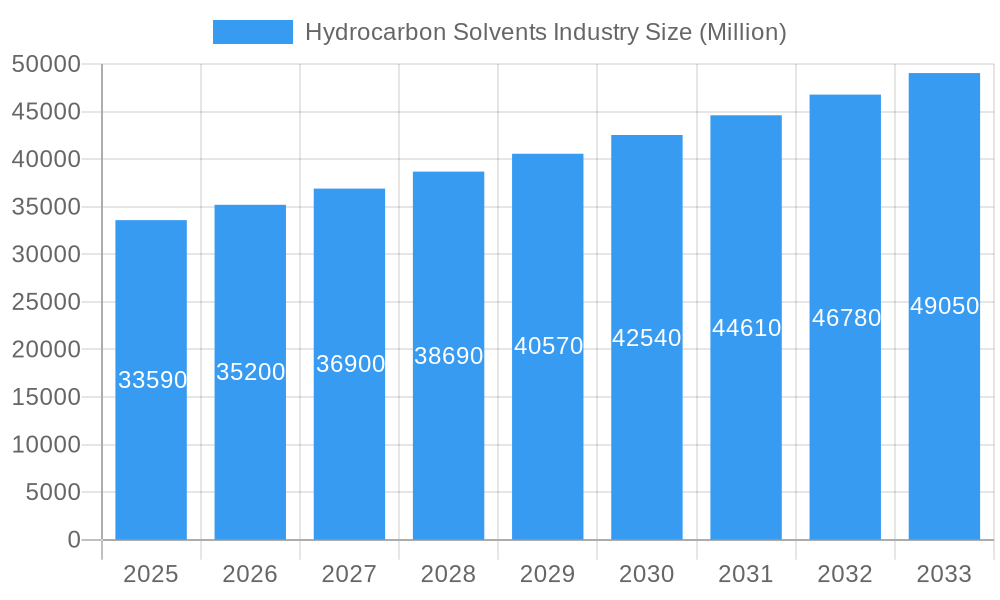
The global hydrocarbon solvents market, valued at approximately $33.59 billion in 2025, is projected to experience robust growth, driven by a compound annual growth rate (CAGR) of 4.70% from 2025 to 2033. This expansion is fueled by several key factors. The increasing demand for hydrocarbon solvents across diverse industries, such as paints and coatings, adhesives, and personal care products, is a primary driver. The cost-effectiveness and versatility of hydrocarbon solvents compared to other solvent types, particularly in applications requiring high solvency power, contribute significantly to their market dominance. Furthermore, ongoing advancements in refining techniques and the development of environmentally friendly hydrocarbon solvent formulations are mitigating some of the traditional concerns associated with their use, further boosting market growth. The Asia-Pacific region, particularly China and India, are anticipated to be major contributors to this growth due to rapid industrialization and expanding consumer markets. However, stringent environmental regulations aimed at reducing volatile organic compound (VOC) emissions, coupled with the rising popularity of bio-based alternatives, are expected to pose challenges to the market's continued expansion in the long term. The market will need to adapt with innovative solutions addressing sustainability concerns to maintain its strong growth trajectory.
Hydrocarbon Solvents Industry Market Size (In Billion)
The hydrocarbon solvents market is segmented based on solvent type (e.g., aliphatic, aromatic, and naphthenic solvents) and application. The paints and coatings segment holds a significant market share, owing to the extensive use of hydrocarbon solvents as diluents and viscosity modifiers. The adhesives and personal care sectors also represent substantial market segments, reflecting the continued demand for these solvents in the manufacturing of various products. Leading players in the market include multinational chemical companies and regional producers, with competition intensifying through strategic partnerships, mergers and acquisitions, and the introduction of innovative products. Geographical variations in regulatory landscapes and market dynamics will continue to shape the competitive landscape and growth trajectory of individual market players. Ongoing research and development efforts focused on reducing environmental impact will likely play a crucial role in determining the future growth prospects for hydrocarbon solvents.
Hydrocarbon Solvents Industry Company Market Share
Hydrocarbon Solvents Industry Market Report: 2019-2033
This comprehensive report provides a detailed analysis of the global Hydrocarbon Solvents industry, encompassing market dynamics, growth trends, regional segmentation, product landscape, and key players. The study period covers 2019-2033, with 2025 as the base and estimated year. This in-depth analysis caters to industry professionals, investors, and strategic decision-makers seeking a thorough understanding of this crucial sector. The report meticulously examines the parent market (Solvents) and its child market (Hydrocarbon Solvents), offering a granular view of market segmentation by source (Bio-Based Solvents, Petrochemical-based Solvents), type (Oxygenated Solvents, Hydrocarbon Solvents, Halogenated Solvents), and application (Adhesives, Paints and Coatings, Personal Care, Pharmaceuticals, Polymer Production, Other Applications).
Hydrocarbon Solvents Industry Market Dynamics & Structure
The Hydrocarbon Solvents market is characterized by a moderately concentrated landscape, with key players like ADM, Honeywell International Inc, Arkema, and Solvay holding significant market share. However, the presence of numerous smaller players indicates a competitive environment. Technological innovation, driven by the need for sustainable and high-performance solvents, is a key driver. Stringent environmental regulations regarding VOC emissions influence market dynamics, pushing innovation towards greener alternatives. The market experiences significant M&A activity, with xx deals recorded between 2019-2024, aiming for market consolidation and technological synergy. Competitive product substitutes, such as water-based and bio-based solvents, exert pressure.
- Market Concentration: Moderately concentrated, with top 5 players holding xx% market share in 2025.
- Technological Innovation: Focus on bio-based solvents and improved efficiency.
- Regulatory Framework: Stringent environmental regulations impacting VOC emissions.
- Competitive Substitutes: Water-based and bio-based solvents.
- M&A Activity: xx deals recorded between 2019 and 2024, driving consolidation.
- End-User Demographics: Primarily industrial applications, with growing demand from emerging economies.
Hydrocarbon Solvents Industry Growth Trends & Insights
The global Hydrocarbon Solvents market witnessed substantial growth during the historical period (2019-2024), expanding from xx million units to xx million units in 2024, representing a CAGR of xx%. This growth trajectory is projected to continue during the forecast period (2025-2033), with an anticipated CAGR of xx%, driven by factors such as increasing demand from the paints and coatings industry, growing personal care sector and expansion in emerging markets. Technological disruptions, especially the development of sustainable and high-performance solvents, are significantly influencing adoption rates. Consumer behavior shifts towards environmentally friendly products are impacting demand for bio-based hydrocarbon solvents.
Dominant Regions, Countries, or Segments in Hydrocarbon Solvents Industry
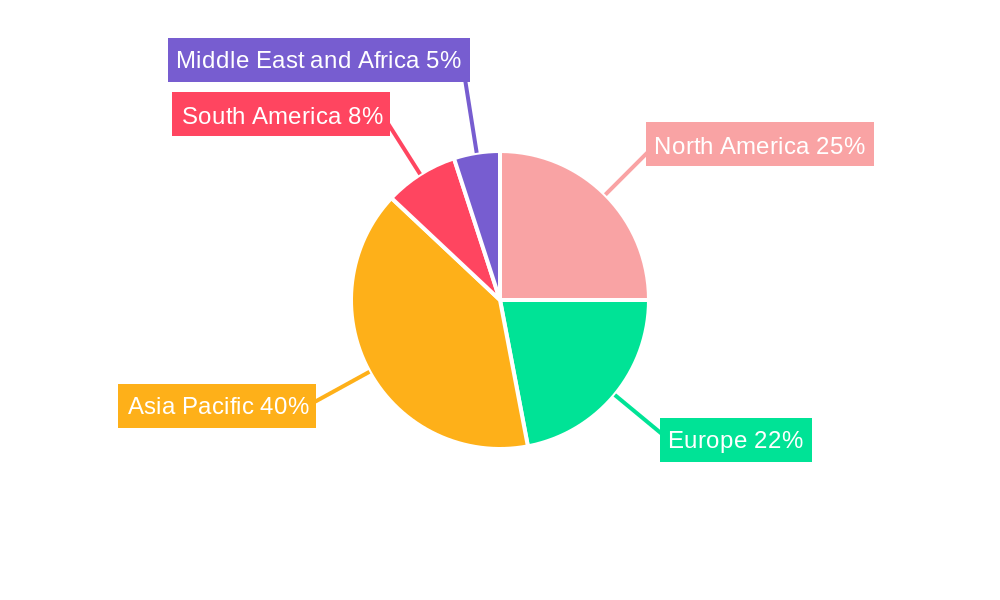
The Asia-Pacific region is projected to dominate the Hydrocarbon Solvents market during the forecast period, driven by rapid industrialization and economic growth in countries like China and India. North America also holds a significant market share due to the mature paints and coatings industry and robust chemical sector. Within the application segments, paints and coatings dominate, followed by the adhesives and polymer production industries. Within the type segment, hydrocarbon solvents holds the largest share, followed by Oxygenated Solvents.
- Key Drivers (Asia-Pacific): Rapid industrialization, rising disposable incomes, and favorable government policies.
- Key Drivers (North America): Mature chemical industry, strong R&D activities, and technological advancements.
- Dominant Segment (Application): Paints and Coatings (xx% market share in 2025).
- Dominant Segment (Type): Hydrocarbon Solvents (xx% market share in 2025).
Hydrocarbon Solvents Industry Product Landscape
The Hydrocarbon Solvents market offers a range of products varying in purity, composition, and performance characteristics. Innovations focus on improving solvent efficiency, reducing VOC emissions, and enhancing compatibility with various materials. Recent advancements include the development of bio-based solvents derived from renewable resources, offering a sustainable alternative. Unique selling propositions are centered around enhanced performance, reduced environmental impact, and cost-effectiveness.
Key Drivers, Barriers & Challenges in Hydrocarbon Solvents Industry
Key Drivers: Growing demand from diverse industries (paints & coatings, adhesives), technological advancements leading to improved efficiency and sustainability, and economic growth in emerging markets.
Challenges: Stringent environmental regulations leading to higher compliance costs, volatility in raw material prices, and intense competition from substitute products. Supply chain disruptions due to geopolitical events could impact production and cost.
Emerging Opportunities in Hydrocarbon Solvents Industry
Emerging opportunities include the expanding bio-based solvents market, growing demand for specialized solvents in niche applications (pharmaceuticals, electronics), and increasing focus on sustainable and eco-friendly solutions. Untapped markets in developing economies present significant growth potential. Innovation in solvent design to enhance performance and reduce environmental impact is a key area of opportunity.
Growth Accelerators in the Hydrocarbon Solvents Industry Industry
Technological breakthroughs in solvent synthesis and formulation are crucial growth catalysts. Strategic partnerships between solvent manufacturers and end-users foster innovation and market penetration. Expansion into new geographical markets, particularly in developing economies, offers significant growth potential.
Key Players Shaping the Hydrocarbon Solvents Industry Market
- ADM
- Honeywell International Inc
- Arkema
- Solvay
- Shell plc
- Bharat Petroleum Corporation Limited
- Exxon Mobil Corporation
- INEOS
- Celanese Corporation
- GROUPE BERKEM
- Ashland
- BASF SE
- LyondellBasell Industries Holdings B V
- Huntsman International LLC
- Sasol Limited
- Gandhar Oil Refinery (India) Limited
- Dow
- Eastman Chemical Company
Notable Milestones in Hydrocarbon Solvents Industry Sector
- 2021: INEOS launched a new line of sustainable hydrocarbon solvents.
- 2022: A major merger between two key players resulted in increased market share. (Specific details unavailable – xx)
- 2023: New environmental regulations were implemented in the EU impacting solvent production.
In-Depth Hydrocarbon Solvents Industry Market Outlook
The Hydrocarbon Solvents market is poised for continued growth driven by the factors discussed earlier. Strategic investments in R&D, expansion into new markets, and the development of sustainable alternatives will shape the future market landscape. The industry is expected to see further consolidation through M&A activity, with large players aiming to expand their product portfolios and geographical reach. The focus on sustainable practices and environmental compliance will be paramount, driving innovation and investment in greener technologies.
Hydrocarbon Solvents Industry Segmentation
-
1. Source
- 1.1. Bio-based Solvents
- 1.2. Petrochemical-based Solvents
-
2. Type
- 2.1. Oxygenated Solvents
- 2.2. Hydrocarbon Solvents
- 2.3. Halogenated Solvents
-
3. Application
- 3.1. Adhesives
- 3.2. Paints and Coatings
- 3.3. Personal Care
- 3.4. Pharmaceuticals
- 3.5. Polymer Production
- 3.6. Other Ap
Hydrocarbon Solvents Industry Segmentation By Geography
-
1. Asia Pacific
- 1.1. China
- 1.2. India
- 1.3. Japan
- 1.4. South Korea
- 1.5. Malaysia
- 1.6. Thailand
- 1.7. Indonesia
- 1.8. Vietnam
- 1.9. Rest of Asia Pacific
-
2. North America
- 2.1. United States
- 2.2. Canada
- 2.3. Mexico
-
3. Europe
- 3.1. Germany
- 3.2. United Kingdom
- 3.3. France
- 3.4. Italy
- 3.5. Spain
- 3.6. NORDIC Countries
- 3.7. Turkey
- 3.8. Russia
- 3.9. Rest of Europe
-
4. South America
- 4.1. Brazil
- 4.2. Argentina
- 4.3. Colombia
- 4.4. Rest of South America
-
5. Middle East and Africa
- 5.1. Saudi Arabia
- 5.2. Qatar
- 5.3. United Arab Emirates
- 5.4. Nigeria
- 5.5. Egypt
- 5.6. South Africa
- 5.7. Rest of Middle East and Africa
Hydrocarbon Solvents Industry Regional Market Share
Geographic Coverage of Hydrocarbon Solvents Industry
Hydrocarbon Solvents Industry REPORT HIGHLIGHTS
| Aspects | Details |
|---|---|
| Study Period | 2020-2034 |
| Base Year | 2025 |
| Estimated Year | 2026 |
| Forecast Period | 2026-2034 |
| Historical Period | 2020-2025 |
| Growth Rate | CAGR of 4.70% from 2020-2034 |
| Segmentation |
|
Table of Contents
- 1. Introduction
- 1.1. Research Scope
- 1.2. Market Segmentation
- 1.3. Research Methodology
- 1.4. Definitions and Assumptions
- 2. Executive Summary
- 2.1. Introduction
- 3. Market Dynamics
- 3.1. Introduction
- 3.2. Market Drivers
- 3.2.1. Surging Demand from the Paints & Coatings Sector; Stringent Regulations in Place to Minimize VOC Emissions; Other Drivers
- 3.3. Market Restrains
- 3.3.1. High Manufacturing Costs and Performance Issues of Solvents; Detrimental Effects of Chemical Solvents
- 3.4. Market Trends
- 3.4.1. Significant Demand from Construction and Automotive Industry
- 4. Market Factor Analysis
- 4.1. Porters Five Forces
- 4.2. Supply/Value Chain
- 4.3. PESTEL analysis
- 4.4. Market Entropy
- 4.5. Patent/Trademark Analysis
- 5. Global Hydrocarbon Solvents Industry Analysis, Insights and Forecast, 2020-2032
- 5.1. Market Analysis, Insights and Forecast - by Source
- 5.1.1. Bio-based Solvents
- 5.1.2. Petrochemical-based Solvents
- 5.2. Market Analysis, Insights and Forecast - by Type
- 5.2.1. Oxygenated Solvents
- 5.2.2. Hydrocarbon Solvents
- 5.2.3. Halogenated Solvents
- 5.3. Market Analysis, Insights and Forecast - by Application
- 5.3.1. Adhesives
- 5.3.2. Paints and Coatings
- 5.3.3. Personal Care
- 5.3.4. Pharmaceuticals
- 5.3.5. Polymer Production
- 5.3.6. Other Ap
- 5.4. Market Analysis, Insights and Forecast - by Region
- 5.4.1. Asia Pacific
- 5.4.2. North America
- 5.4.3. Europe
- 5.4.4. South America
- 5.4.5. Middle East and Africa
- 5.1. Market Analysis, Insights and Forecast - by Source
- 6. Asia Pacific Hydrocarbon Solvents Industry Analysis, Insights and Forecast, 2020-2032
- 6.1. Market Analysis, Insights and Forecast - by Source
- 6.1.1. Bio-based Solvents
- 6.1.2. Petrochemical-based Solvents
- 6.2. Market Analysis, Insights and Forecast - by Type
- 6.2.1. Oxygenated Solvents
- 6.2.2. Hydrocarbon Solvents
- 6.2.3. Halogenated Solvents
- 6.3. Market Analysis, Insights and Forecast - by Application
- 6.3.1. Adhesives
- 6.3.2. Paints and Coatings
- 6.3.3. Personal Care
- 6.3.4. Pharmaceuticals
- 6.3.5. Polymer Production
- 6.3.6. Other Ap
- 6.1. Market Analysis, Insights and Forecast - by Source
- 7. North America Hydrocarbon Solvents Industry Analysis, Insights and Forecast, 2020-2032
- 7.1. Market Analysis, Insights and Forecast - by Source
- 7.1.1. Bio-based Solvents
- 7.1.2. Petrochemical-based Solvents
- 7.2. Market Analysis, Insights and Forecast - by Type
- 7.2.1. Oxygenated Solvents
- 7.2.2. Hydrocarbon Solvents
- 7.2.3. Halogenated Solvents
- 7.3. Market Analysis, Insights and Forecast - by Application
- 7.3.1. Adhesives
- 7.3.2. Paints and Coatings
- 7.3.3. Personal Care
- 7.3.4. Pharmaceuticals
- 7.3.5. Polymer Production
- 7.3.6. Other Ap
- 7.1. Market Analysis, Insights and Forecast - by Source
- 8. Europe Hydrocarbon Solvents Industry Analysis, Insights and Forecast, 2020-2032
- 8.1. Market Analysis, Insights and Forecast - by Source
- 8.1.1. Bio-based Solvents
- 8.1.2. Petrochemical-based Solvents
- 8.2. Market Analysis, Insights and Forecast - by Type
- 8.2.1. Oxygenated Solvents
- 8.2.2. Hydrocarbon Solvents
- 8.2.3. Halogenated Solvents
- 8.3. Market Analysis, Insights and Forecast - by Application
- 8.3.1. Adhesives
- 8.3.2. Paints and Coatings
- 8.3.3. Personal Care
- 8.3.4. Pharmaceuticals
- 8.3.5. Polymer Production
- 8.3.6. Other Ap
- 8.1. Market Analysis, Insights and Forecast - by Source
- 9. South America Hydrocarbon Solvents Industry Analysis, Insights and Forecast, 2020-2032
- 9.1. Market Analysis, Insights and Forecast - by Source
- 9.1.1. Bio-based Solvents
- 9.1.2. Petrochemical-based Solvents
- 9.2. Market Analysis, Insights and Forecast - by Type
- 9.2.1. Oxygenated Solvents
- 9.2.2. Hydrocarbon Solvents
- 9.2.3. Halogenated Solvents
- 9.3. Market Analysis, Insights and Forecast - by Application
- 9.3.1. Adhesives
- 9.3.2. Paints and Coatings
- 9.3.3. Personal Care
- 9.3.4. Pharmaceuticals
- 9.3.5. Polymer Production
- 9.3.6. Other Ap
- 9.1. Market Analysis, Insights and Forecast - by Source
- 10. Middle East and Africa Hydrocarbon Solvents Industry Analysis, Insights and Forecast, 2020-2032
- 10.1. Market Analysis, Insights and Forecast - by Source
- 10.1.1. Bio-based Solvents
- 10.1.2. Petrochemical-based Solvents
- 10.2. Market Analysis, Insights and Forecast - by Type
- 10.2.1. Oxygenated Solvents
- 10.2.2. Hydrocarbon Solvents
- 10.2.3. Halogenated Solvents
- 10.3. Market Analysis, Insights and Forecast - by Application
- 10.3.1. Adhesives
- 10.3.2. Paints and Coatings
- 10.3.3. Personal Care
- 10.3.4. Pharmaceuticals
- 10.3.5. Polymer Production
- 10.3.6. Other Ap
- 10.1. Market Analysis, Insights and Forecast - by Source
- 11. Competitive Analysis
- 11.1. Global Market Share Analysis 2025
- 11.2. Company Profiles
- 11.2.1 ADM
- 11.2.1.1. Overview
- 11.2.1.2. Products
- 11.2.1.3. SWOT Analysis
- 11.2.1.4. Recent Developments
- 11.2.1.5. Financials (Based on Availability)
- 11.2.2 Honeywell International Inc
- 11.2.2.1. Overview
- 11.2.2.2. Products
- 11.2.2.3. SWOT Analysis
- 11.2.2.4. Recent Developments
- 11.2.2.5. Financials (Based on Availability)
- 11.2.3 Arkema
- 11.2.3.1. Overview
- 11.2.3.2. Products
- 11.2.3.3. SWOT Analysis
- 11.2.3.4. Recent Developments
- 11.2.3.5. Financials (Based on Availability)
- 11.2.4 Solvay*List Not Exhaustive
- 11.2.4.1. Overview
- 11.2.4.2. Products
- 11.2.4.3. SWOT Analysis
- 11.2.4.4. Recent Developments
- 11.2.4.5. Financials (Based on Availability)
- 11.2.5 Shell plc
- 11.2.5.1. Overview
- 11.2.5.2. Products
- 11.2.5.3. SWOT Analysis
- 11.2.5.4. Recent Developments
- 11.2.5.5. Financials (Based on Availability)
- 11.2.6 Bharat Petroleum Corporation Limited
- 11.2.6.1. Overview
- 11.2.6.2. Products
- 11.2.6.3. SWOT Analysis
- 11.2.6.4. Recent Developments
- 11.2.6.5. Financials (Based on Availability)
- 11.2.7 Exxon Mobil Corporation
- 11.2.7.1. Overview
- 11.2.7.2. Products
- 11.2.7.3. SWOT Analysis
- 11.2.7.4. Recent Developments
- 11.2.7.5. Financials (Based on Availability)
- 11.2.8 INEOS
- 11.2.8.1. Overview
- 11.2.8.2. Products
- 11.2.8.3. SWOT Analysis
- 11.2.8.4. Recent Developments
- 11.2.8.5. Financials (Based on Availability)
- 11.2.9 Celanese Corporation
- 11.2.9.1. Overview
- 11.2.9.2. Products
- 11.2.9.3. SWOT Analysis
- 11.2.9.4. Recent Developments
- 11.2.9.5. Financials (Based on Availability)
- 11.2.10 GROUPE BERKEM
- 11.2.10.1. Overview
- 11.2.10.2. Products
- 11.2.10.3. SWOT Analysis
- 11.2.10.4. Recent Developments
- 11.2.10.5. Financials (Based on Availability)
- 11.2.11 Ashland
- 11.2.11.1. Overview
- 11.2.11.2. Products
- 11.2.11.3. SWOT Analysis
- 11.2.11.4. Recent Developments
- 11.2.11.5. Financials (Based on Availability)
- 11.2.12 BASF SE
- 11.2.12.1. Overview
- 11.2.12.2. Products
- 11.2.12.3. SWOT Analysis
- 11.2.12.4. Recent Developments
- 11.2.12.5. Financials (Based on Availability)
- 11.2.13 LyondellBasell Industries Holdings B V
- 11.2.13.1. Overview
- 11.2.13.2. Products
- 11.2.13.3. SWOT Analysis
- 11.2.13.4. Recent Developments
- 11.2.13.5. Financials (Based on Availability)
- 11.2.14 Huntsman International LLC
- 11.2.14.1. Overview
- 11.2.14.2. Products
- 11.2.14.3. SWOT Analysis
- 11.2.14.4. Recent Developments
- 11.2.14.5. Financials (Based on Availability)
- 11.2.15 Sasol Limited
- 11.2.15.1. Overview
- 11.2.15.2. Products
- 11.2.15.3. SWOT Analysis
- 11.2.15.4. Recent Developments
- 11.2.15.5. Financials (Based on Availability)
- 11.2.16 Gandhar Oil Refinery (India) Limited
- 11.2.16.1. Overview
- 11.2.16.2. Products
- 11.2.16.3. SWOT Analysis
- 11.2.16.4. Recent Developments
- 11.2.16.5. Financials (Based on Availability)
- 11.2.17 Dow
- 11.2.17.1. Overview
- 11.2.17.2. Products
- 11.2.17.3. SWOT Analysis
- 11.2.17.4. Recent Developments
- 11.2.17.5. Financials (Based on Availability)
- 11.2.18 Eastman Chemical Company
- 11.2.18.1. Overview
- 11.2.18.2. Products
- 11.2.18.3. SWOT Analysis
- 11.2.18.4. Recent Developments
- 11.2.18.5. Financials (Based on Availability)
- 11.2.1 ADM
List of Figures
- Figure 1: Global Hydrocarbon Solvents Industry Revenue Breakdown (Million, %) by Region 2025 & 2033
- Figure 2: Asia Pacific Hydrocarbon Solvents Industry Revenue (Million), by Source 2025 & 2033
- Figure 3: Asia Pacific Hydrocarbon Solvents Industry Revenue Share (%), by Source 2025 & 2033
- Figure 4: Asia Pacific Hydrocarbon Solvents Industry Revenue (Million), by Type 2025 & 2033
- Figure 5: Asia Pacific Hydrocarbon Solvents Industry Revenue Share (%), by Type 2025 & 2033
- Figure 6: Asia Pacific Hydrocarbon Solvents Industry Revenue (Million), by Application 2025 & 2033
- Figure 7: Asia Pacific Hydrocarbon Solvents Industry Revenue Share (%), by Application 2025 & 2033
- Figure 8: Asia Pacific Hydrocarbon Solvents Industry Revenue (Million), by Country 2025 & 2033
- Figure 9: Asia Pacific Hydrocarbon Solvents Industry Revenue Share (%), by Country 2025 & 2033
- Figure 10: North America Hydrocarbon Solvents Industry Revenue (Million), by Source 2025 & 2033
- Figure 11: North America Hydrocarbon Solvents Industry Revenue Share (%), by Source 2025 & 2033
- Figure 12: North America Hydrocarbon Solvents Industry Revenue (Million), by Type 2025 & 2033
- Figure 13: North America Hydrocarbon Solvents Industry Revenue Share (%), by Type 2025 & 2033
- Figure 14: North America Hydrocarbon Solvents Industry Revenue (Million), by Application 2025 & 2033
- Figure 15: North America Hydrocarbon Solvents Industry Revenue Share (%), by Application 2025 & 2033
- Figure 16: North America Hydrocarbon Solvents Industry Revenue (Million), by Country 2025 & 2033
- Figure 17: North America Hydrocarbon Solvents Industry Revenue Share (%), by Country 2025 & 2033
- Figure 18: Europe Hydrocarbon Solvents Industry Revenue (Million), by Source 2025 & 2033
- Figure 19: Europe Hydrocarbon Solvents Industry Revenue Share (%), by Source 2025 & 2033
- Figure 20: Europe Hydrocarbon Solvents Industry Revenue (Million), by Type 2025 & 2033
- Figure 21: Europe Hydrocarbon Solvents Industry Revenue Share (%), by Type 2025 & 2033
- Figure 22: Europe Hydrocarbon Solvents Industry Revenue (Million), by Application 2025 & 2033
- Figure 23: Europe Hydrocarbon Solvents Industry Revenue Share (%), by Application 2025 & 2033
- Figure 24: Europe Hydrocarbon Solvents Industry Revenue (Million), by Country 2025 & 2033
- Figure 25: Europe Hydrocarbon Solvents Industry Revenue Share (%), by Country 2025 & 2033
- Figure 26: South America Hydrocarbon Solvents Industry Revenue (Million), by Source 2025 & 2033
- Figure 27: South America Hydrocarbon Solvents Industry Revenue Share (%), by Source 2025 & 2033
- Figure 28: South America Hydrocarbon Solvents Industry Revenue (Million), by Type 2025 & 2033
- Figure 29: South America Hydrocarbon Solvents Industry Revenue Share (%), by Type 2025 & 2033
- Figure 30: South America Hydrocarbon Solvents Industry Revenue (Million), by Application 2025 & 2033
- Figure 31: South America Hydrocarbon Solvents Industry Revenue Share (%), by Application 2025 & 2033
- Figure 32: South America Hydrocarbon Solvents Industry Revenue (Million), by Country 2025 & 2033
- Figure 33: South America Hydrocarbon Solvents Industry Revenue Share (%), by Country 2025 & 2033
- Figure 34: Middle East and Africa Hydrocarbon Solvents Industry Revenue (Million), by Source 2025 & 2033
- Figure 35: Middle East and Africa Hydrocarbon Solvents Industry Revenue Share (%), by Source 2025 & 2033
- Figure 36: Middle East and Africa Hydrocarbon Solvents Industry Revenue (Million), by Type 2025 & 2033
- Figure 37: Middle East and Africa Hydrocarbon Solvents Industry Revenue Share (%), by Type 2025 & 2033
- Figure 38: Middle East and Africa Hydrocarbon Solvents Industry Revenue (Million), by Application 2025 & 2033
- Figure 39: Middle East and Africa Hydrocarbon Solvents Industry Revenue Share (%), by Application 2025 & 2033
- Figure 40: Middle East and Africa Hydrocarbon Solvents Industry Revenue (Million), by Country 2025 & 2033
- Figure 41: Middle East and Africa Hydrocarbon Solvents Industry Revenue Share (%), by Country 2025 & 2033
List of Tables
- Table 1: Global Hydrocarbon Solvents Industry Revenue Million Forecast, by Source 2020 & 2033
- Table 2: Global Hydrocarbon Solvents Industry Revenue Million Forecast, by Type 2020 & 2033
- Table 3: Global Hydrocarbon Solvents Industry Revenue Million Forecast, by Application 2020 & 2033
- Table 4: Global Hydrocarbon Solvents Industry Revenue Million Forecast, by Region 2020 & 2033
- Table 5: Global Hydrocarbon Solvents Industry Revenue Million Forecast, by Source 2020 & 2033
- Table 6: Global Hydrocarbon Solvents Industry Revenue Million Forecast, by Type 2020 & 2033
- Table 7: Global Hydrocarbon Solvents Industry Revenue Million Forecast, by Application 2020 & 2033
- Table 8: Global Hydrocarbon Solvents Industry Revenue Million Forecast, by Country 2020 & 2033
- Table 9: China Hydrocarbon Solvents Industry Revenue (Million) Forecast, by Application 2020 & 2033
- Table 10: India Hydrocarbon Solvents Industry Revenue (Million) Forecast, by Application 2020 & 2033
- Table 11: Japan Hydrocarbon Solvents Industry Revenue (Million) Forecast, by Application 2020 & 2033
- Table 12: South Korea Hydrocarbon Solvents Industry Revenue (Million) Forecast, by Application 2020 & 2033
- Table 13: Malaysia Hydrocarbon Solvents Industry Revenue (Million) Forecast, by Application 2020 & 2033
- Table 14: Thailand Hydrocarbon Solvents Industry Revenue (Million) Forecast, by Application 2020 & 2033
- Table 15: Indonesia Hydrocarbon Solvents Industry Revenue (Million) Forecast, by Application 2020 & 2033
- Table 16: Vietnam Hydrocarbon Solvents Industry Revenue (Million) Forecast, by Application 2020 & 2033
- Table 17: Rest of Asia Pacific Hydrocarbon Solvents Industry Revenue (Million) Forecast, by Application 2020 & 2033
- Table 18: Global Hydrocarbon Solvents Industry Revenue Million Forecast, by Source 2020 & 2033
- Table 19: Global Hydrocarbon Solvents Industry Revenue Million Forecast, by Type 2020 & 2033
- Table 20: Global Hydrocarbon Solvents Industry Revenue Million Forecast, by Application 2020 & 2033
- Table 21: Global Hydrocarbon Solvents Industry Revenue Million Forecast, by Country 2020 & 2033
- Table 22: United States Hydrocarbon Solvents Industry Revenue (Million) Forecast, by Application 2020 & 2033
- Table 23: Canada Hydrocarbon Solvents Industry Revenue (Million) Forecast, by Application 2020 & 2033
- Table 24: Mexico Hydrocarbon Solvents Industry Revenue (Million) Forecast, by Application 2020 & 2033
- Table 25: Global Hydrocarbon Solvents Industry Revenue Million Forecast, by Source 2020 & 2033
- Table 26: Global Hydrocarbon Solvents Industry Revenue Million Forecast, by Type 2020 & 2033
- Table 27: Global Hydrocarbon Solvents Industry Revenue Million Forecast, by Application 2020 & 2033
- Table 28: Global Hydrocarbon Solvents Industry Revenue Million Forecast, by Country 2020 & 2033
- Table 29: Germany Hydrocarbon Solvents Industry Revenue (Million) Forecast, by Application 2020 & 2033
- Table 30: United Kingdom Hydrocarbon Solvents Industry Revenue (Million) Forecast, by Application 2020 & 2033
- Table 31: France Hydrocarbon Solvents Industry Revenue (Million) Forecast, by Application 2020 & 2033
- Table 32: Italy Hydrocarbon Solvents Industry Revenue (Million) Forecast, by Application 2020 & 2033
- Table 33: Spain Hydrocarbon Solvents Industry Revenue (Million) Forecast, by Application 2020 & 2033
- Table 34: NORDIC Countries Hydrocarbon Solvents Industry Revenue (Million) Forecast, by Application 2020 & 2033
- Table 35: Turkey Hydrocarbon Solvents Industry Revenue (Million) Forecast, by Application 2020 & 2033
- Table 36: Russia Hydrocarbon Solvents Industry Revenue (Million) Forecast, by Application 2020 & 2033
- Table 37: Rest of Europe Hydrocarbon Solvents Industry Revenue (Million) Forecast, by Application 2020 & 2033
- Table 38: Global Hydrocarbon Solvents Industry Revenue Million Forecast, by Source 2020 & 2033
- Table 39: Global Hydrocarbon Solvents Industry Revenue Million Forecast, by Type 2020 & 2033
- Table 40: Global Hydrocarbon Solvents Industry Revenue Million Forecast, by Application 2020 & 2033
- Table 41: Global Hydrocarbon Solvents Industry Revenue Million Forecast, by Country 2020 & 2033
- Table 42: Brazil Hydrocarbon Solvents Industry Revenue (Million) Forecast, by Application 2020 & 2033
- Table 43: Argentina Hydrocarbon Solvents Industry Revenue (Million) Forecast, by Application 2020 & 2033
- Table 44: Colombia Hydrocarbon Solvents Industry Revenue (Million) Forecast, by Application 2020 & 2033
- Table 45: Rest of South America Hydrocarbon Solvents Industry Revenue (Million) Forecast, by Application 2020 & 2033
- Table 46: Global Hydrocarbon Solvents Industry Revenue Million Forecast, by Source 2020 & 2033
- Table 47: Global Hydrocarbon Solvents Industry Revenue Million Forecast, by Type 2020 & 2033
- Table 48: Global Hydrocarbon Solvents Industry Revenue Million Forecast, by Application 2020 & 2033
- Table 49: Global Hydrocarbon Solvents Industry Revenue Million Forecast, by Country 2020 & 2033
- Table 50: Saudi Arabia Hydrocarbon Solvents Industry Revenue (Million) Forecast, by Application 2020 & 2033
- Table 51: Qatar Hydrocarbon Solvents Industry Revenue (Million) Forecast, by Application 2020 & 2033
- Table 52: United Arab Emirates Hydrocarbon Solvents Industry Revenue (Million) Forecast, by Application 2020 & 2033
- Table 53: Nigeria Hydrocarbon Solvents Industry Revenue (Million) Forecast, by Application 2020 & 2033
- Table 54: Egypt Hydrocarbon Solvents Industry Revenue (Million) Forecast, by Application 2020 & 2033
- Table 55: South Africa Hydrocarbon Solvents Industry Revenue (Million) Forecast, by Application 2020 & 2033
- Table 56: Rest of Middle East and Africa Hydrocarbon Solvents Industry Revenue (Million) Forecast, by Application 2020 & 2033
Frequently Asked Questions
1. What is the projected Compound Annual Growth Rate (CAGR) of the Hydrocarbon Solvents Industry?
The projected CAGR is approximately 4.70%.
2. Which companies are prominent players in the Hydrocarbon Solvents Industry?
Key companies in the market include ADM, Honeywell International Inc, Arkema, Solvay*List Not Exhaustive, Shell plc, Bharat Petroleum Corporation Limited, Exxon Mobil Corporation, INEOS, Celanese Corporation, GROUPE BERKEM, Ashland, BASF SE, LyondellBasell Industries Holdings B V, Huntsman International LLC, Sasol Limited, Gandhar Oil Refinery (India) Limited, Dow, Eastman Chemical Company.
3. What are the main segments of the Hydrocarbon Solvents Industry?
The market segments include Source, Type, Application.
4. Can you provide details about the market size?
The market size is estimated to be USD 33.59 Million as of 2022.
5. What are some drivers contributing to market growth?
Surging Demand from the Paints & Coatings Sector; Stringent Regulations in Place to Minimize VOC Emissions; Other Drivers.
6. What are the notable trends driving market growth?
Significant Demand from Construction and Automotive Industry.
7. Are there any restraints impacting market growth?
High Manufacturing Costs and Performance Issues of Solvents; Detrimental Effects of Chemical Solvents.
8. Can you provide examples of recent developments in the market?
N/A
9. What pricing options are available for accessing the report?
Pricing options include single-user, multi-user, and enterprise licenses priced at USD 4750, USD 5250, and USD 8750 respectively.
10. Is the market size provided in terms of value or volume?
The market size is provided in terms of value, measured in Million.
11. Are there any specific market keywords associated with the report?
Yes, the market keyword associated with the report is "Hydrocarbon Solvents Industry," which aids in identifying and referencing the specific market segment covered.
12. How do I determine which pricing option suits my needs best?
The pricing options vary based on user requirements and access needs. Individual users may opt for single-user licenses, while businesses requiring broader access may choose multi-user or enterprise licenses for cost-effective access to the report.
13. Are there any additional resources or data provided in the Hydrocarbon Solvents Industry report?
While the report offers comprehensive insights, it's advisable to review the specific contents or supplementary materials provided to ascertain if additional resources or data are available.
14. How can I stay updated on further developments or reports in the Hydrocarbon Solvents Industry?
To stay informed about further developments, trends, and reports in the Hydrocarbon Solvents Industry, consider subscribing to industry newsletters, following relevant companies and organizations, or regularly checking reputable industry news sources and publications.
Methodology
Step 1 - Identification of Relevant Samples Size from Population Database


Step 2 - Approaches for Defining Global Market Size (Value, Volume* & Price*)

Note*: In applicable scenarios
Step 3 - Data Sources
Primary Research
- Web Analytics
- Survey Reports
- Research Institute
- Latest Research Reports
- Opinion Leaders
Secondary Research
- Annual Reports
- White Paper
- Latest Press Release
- Industry Association
- Paid Database
- Investor Presentations

Step 4 - Data Triangulation
Involves using different sources of information in order to increase the validity of a study
These sources are likely to be stakeholders in a program - participants, other researchers, program staff, other community members, and so on.
Then we put all data in single framework & apply various statistical tools to find out the dynamic on the market.
During the analysis stage, feedback from the stakeholder groups would be compared to determine areas of agreement as well as areas of divergence