

Key Insights
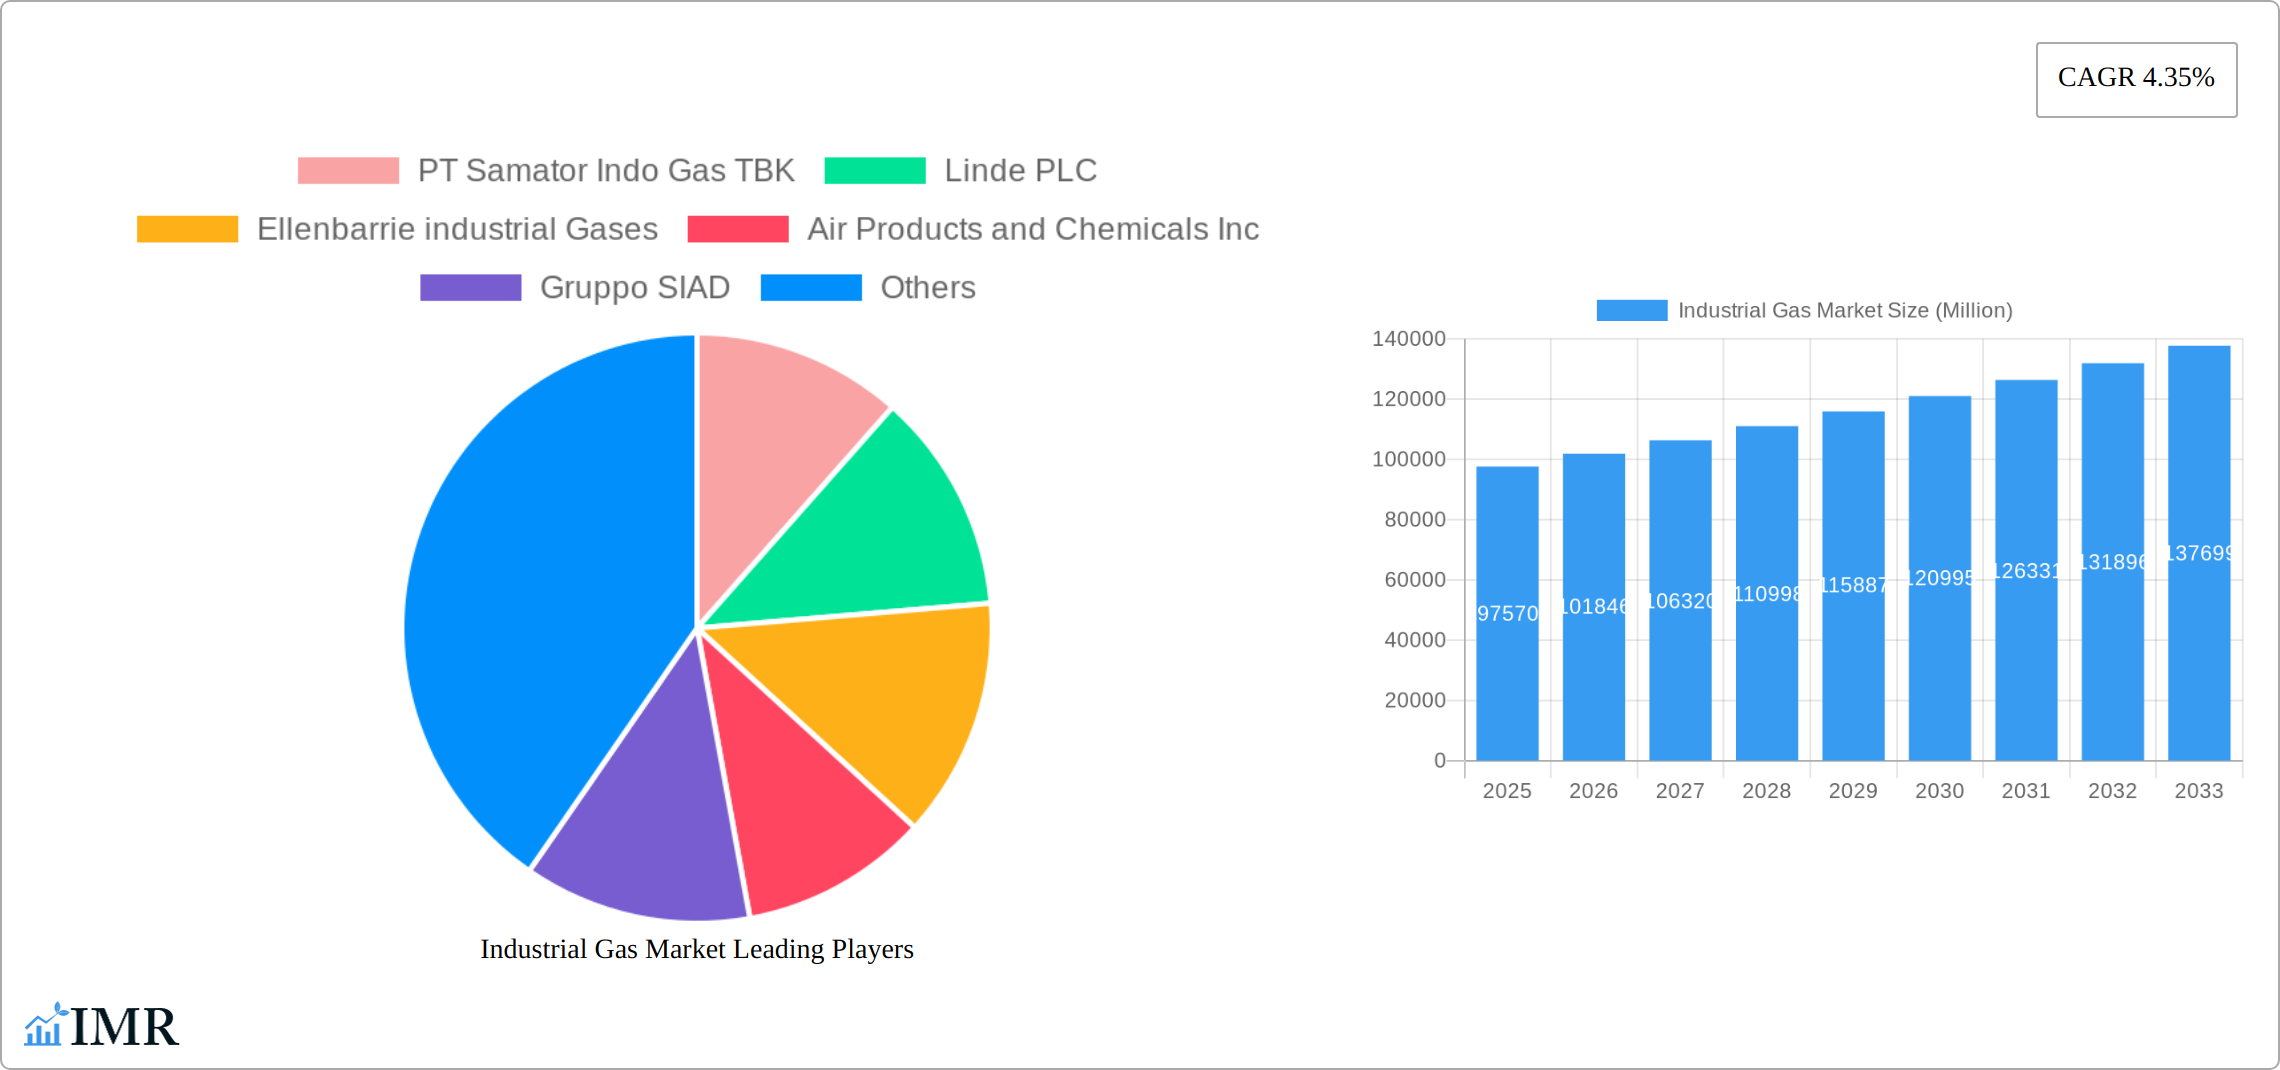
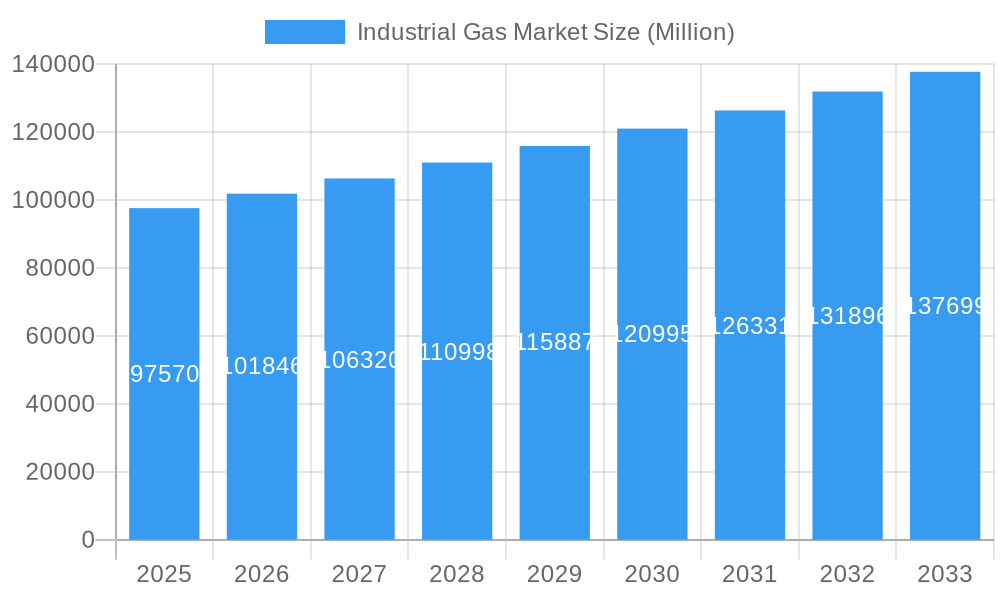
The global industrial gas market is projected for significant expansion, estimated at $119.11 billion by 2033, with a Compound Annual Growth Rate (CAGR) of 4.4% from the 2025 base year. Key growth drivers include the expanding chemical processing and refining industries, alongside increased demand for high-purity gases in electronics manufacturing. The food and beverage sector's growth, especially in emerging markets, also fuels demand for gases like carbon dioxide and nitrogen in packaging and preservation. The automotive and transportation industries further contribute through their reliance on industrial gases in vehicle production and maintenance. Technological innovations in gas production and delivery systems are accelerating market growth. While regulatory compliance presents some challenges, the market outlook is robust across diverse geographical regions.
Industrial Gas Market Market Size (In Billion)
Market share distribution highlights a blend of mature industrial regions and rapidly developing economies. North America and Europe maintain substantial shares due to advanced infrastructure and technology. However, the Asia-Pacific region is poised for the fastest growth, driven by intense industrialization and expanding manufacturing in China and India. Emerging economies in South America, the Middle East, and Africa also offer significant growth prospects. The market is characterized by intense competition among global and regional players, with strategic collaborations, mergers, and acquisitions expected to redefine the competitive landscape. The widespread application of industrial gases across multiple sectors ensures consistent demand and long-term growth potential.
Industrial Gas Market Company Market Share
Industrial Gas Market: A Comprehensive Report (2019-2033)
This in-depth report provides a comprehensive analysis of the Industrial Gas Market, encompassing market dynamics, growth trends, regional dominance, product landscape, key players, and future outlook. With a study period spanning 2019-2033, a base year of 2025, and a forecast period of 2025-2033, this report is an essential resource for industry professionals, investors, and strategic decision-makers. The market is segmented by product type (Nitrogen, Oxygen, Carbon dioxide, Hydrogen, Helium, Argon, Ammonia, Methane, Propane, Butane, Other Product Types) and end-user industry (Chemical Processing and Refining, Electronics, Food and Beverage, Oil and Gas, Metal Manufacturing and Fabrication, Medical and Pharmaceutical, Automotive and Transportation, Energy and Power, Other End-user Industries). The total market size is projected to reach xx Million units by 2033.
Industrial Gas Market Market Dynamics & Structure
The industrial gas market is characterized by moderate concentration, with a few major players holding significant market share. Technological innovation, driven by efficiency improvements and environmental regulations, plays a crucial role. Stringent safety and environmental regulations shape market dynamics, while the emergence of substitute technologies and alternative energy sources presents both challenges and opportunities. Mergers and acquisitions (M&A) activity is prevalent, reflecting consolidation efforts and expansion strategies.
- Market Concentration: The top 5 players account for approximately xx% of the global market share in 2025.
- Technological Innovation: Focus on energy efficiency, process optimization, and emission reduction is driving innovation.
- Regulatory Landscape: Stringent environmental regulations are pushing adoption of cleaner technologies and sustainable practices.
- Competitive Substitutes: Renewable energy sources and alternative process technologies pose a competitive threat, although limited in scope.
- End-User Demographics: Growth is fueled by expanding industrial sectors, particularly in developing economies.
- M&A Activity: An average of xx M&A deals per year were recorded during the historical period (2019-2024).
Industrial Gas Market Growth Trends & Insights
The industrial gas market exhibits consistent growth, driven by increasing industrial activity and technological advancements. The market witnessed a CAGR of xx% during the historical period (2019-2024) and is projected to maintain a CAGR of xx% during the forecast period (2025-2033). Market penetration in emerging economies is increasing, driven by industrialization and infrastructure development. Technological disruptions, such as the adoption of advanced separation technologies and digitalization, are further enhancing market dynamics. Consumer behavior shifts toward sustainable practices are influencing product demand. Specific regional growth trajectories vary based on economic development and industrial activity. Adoption rates for new technologies are influenced by cost, efficiency gains, and regulatory pressures. The market size is estimated at xx Million units in 2025.
Dominant Regions, Countries, or Segments in Industrial Gas Market
The Asia-Pacific region holds a dominant position in the industrial gas market, fueled by the robust industrial expansion in major economies like China and India. Within the product spectrum, Nitrogen and Oxygen consistently command the largest market share due to their widespread applications across diverse industries. Key end-user sectors driving demand include Chemical Processing and Refining, and Metal Manufacturing and Fabrication. This regional dominance is further solidified by several key factors.
- Key Drivers in Asia-Pacific: Rapid industrialization, escalating energy consumption, supportive government policies promoting industrial growth, and a burgeoning demand for advanced manufacturing processes are key growth drivers.
- Dominance Factors: The region's extensive industrial base, significant investments in infrastructure development, and the rising demand across various sectors contribute to its market leadership.
- Growth Potential: Continued economic expansion in the region, coupled with the increasing adoption of advanced technologies across industries, promises significant future growth.
- North America and Europe: While these regions represent mature markets characterized by stable growth, they continue to be influenced by factors such as technological innovation and the implementation of stringent environmental regulations.
Industrial Gas Market Product Landscape
The industrial gas market encompasses a diverse portfolio of products, including nitrogen, oxygen, carbon dioxide, hydrogen, helium, argon, ammonia, methane, propane, and butane. Ongoing innovation is focused on enhancing product purity, developing more efficient delivery systems, and implementing environmentally sustainable production methods. Technological advancements are continuously improving product performance, safety profiles, and cost-effectiveness. Successful players differentiate themselves through superior purity levels, application-specific delivery solutions, and integrated service offerings.
Key Drivers, Barriers & Challenges in Industrial Gas Market
Key Drivers:
- Rising industrial activity across various sectors.
- Growing demand for high-purity gases in diverse applications.
- Technological advancements leading to improved efficiency and cost reduction.
- Favorable government regulations supporting industrial development.
Challenges & Restraints:
- Fluctuations in raw material prices.
- Stringent environmental regulations increasing operational costs.
- Intense competition among existing players.
- Supply chain disruptions impacting production and distribution. These disruptions caused an estimated xx% reduction in output in 2022.
Emerging Opportunities in Industrial Gas Market
- Growth in emerging markets such as Africa and Latin America.
- Increasing demand for specialized gases in niche applications.
- Expanding use of industrial gases in renewable energy technologies.
- Development of innovative delivery and storage solutions.
Growth Accelerators in the Industrial Gas Market Industry
Long-term growth is projected to be driven by technological advancements, strategic partnerships between gas producers and end-users, and expansion into new markets. Emphasis on sustainability initiatives is playing an increasingly significant role. Government support for industrial growth, especially in developing nations, remains a key catalyst.
Key Players Shaping the Industrial Gas Market Market
- PT Samator Indo Gas TBK
- Linde PLC
- Ellenbarrie industrial Gases
- Air Products and Chemicals Inc
- Gruppo SIAD
- Bhuruka Gases Limited
- BASF SE
- Iwatani Corporation
- Asia Technical Gas Co Pte Ltd
- Sapio Group
- Messer Group GmbH
- Yingde Gases Group
- Air Liquide
- Nippon Sanso Holdings Corporation
- SOL SPA
Notable Milestones in Industrial Gas Market Sector
- January 2023: Iwatani Corporation's strategic acquisition of Aspen Air US, LLC significantly expanded its footprint in the competitive US industrial gas market.
- April 2023: Nippon Gases' collaboration with Enel Green Power Italia highlights a significant investment in CO2 reuse technologies for innovative food applications, showcasing a commitment to sustainability.
- [Add more recent milestones here - include dates and brief descriptions]
In-Depth Industrial Gas Market Market Outlook
The industrial gas market is poised for sustained growth, driven by technological innovation, sustainable practices, and expanding industrial activity. Strategic partnerships, market expansion into new geographical regions, and the development of specialized gas applications will further enhance market potential. The focus on sustainability and efficiency will create new opportunities for innovative players to enter the market and compete effectively.
Industrial Gas Market Segmentation
-
1. Product Type
- 1.1. Nitrogen
- 1.2. Oxygen
- 1.3. Carbon dioxide
- 1.4. Hydrogen
- 1.5. Helium
- 1.6. Argon
- 1.7. Ammonia
- 1.8. Methane
- 1.9. Propane
- 1.10. Butane
- 1.11. Other Product Types
-
2. End-user Industry
- 2.1. Chemical Processing and Refining
- 2.2. Electronics
- 2.3. Food and Beverage
- 2.4. Oil and Gas
- 2.5. Metal Manufacturing and Fabrication
- 2.6. Medical and Pharmaceutical
- 2.7. Automotive and Transportation
- 2.8. Energy and Power
- 2.9. Other End-user Industries
Industrial Gas Market Segmentation By Geography
-
1. Asia Pacific
- 1.1. China
- 1.2. India
- 1.3. Japan
- 1.4. South Korea
- 1.5. ASEAN Countries
- 1.6. Rest of Asia Pacific
-
2. North America
- 2.1. United States
- 2.2. Canada
- 2.3. Mexico
-
3. Europe
- 3.1. Germany
- 3.2. United Kingdom
- 3.3. France
- 3.4. Italy
- 3.5. NORDIC Countries
- 3.6. Rest of Europe
-
4. South America
- 4.1. Brazil
- 4.2. Argentina
- 4.3. Rest of South America
-
5. Middle East and Africa
- 5.1. Saudi Arabia
- 5.2. South Africa
- 5.3. Rest of Middle East and Africa
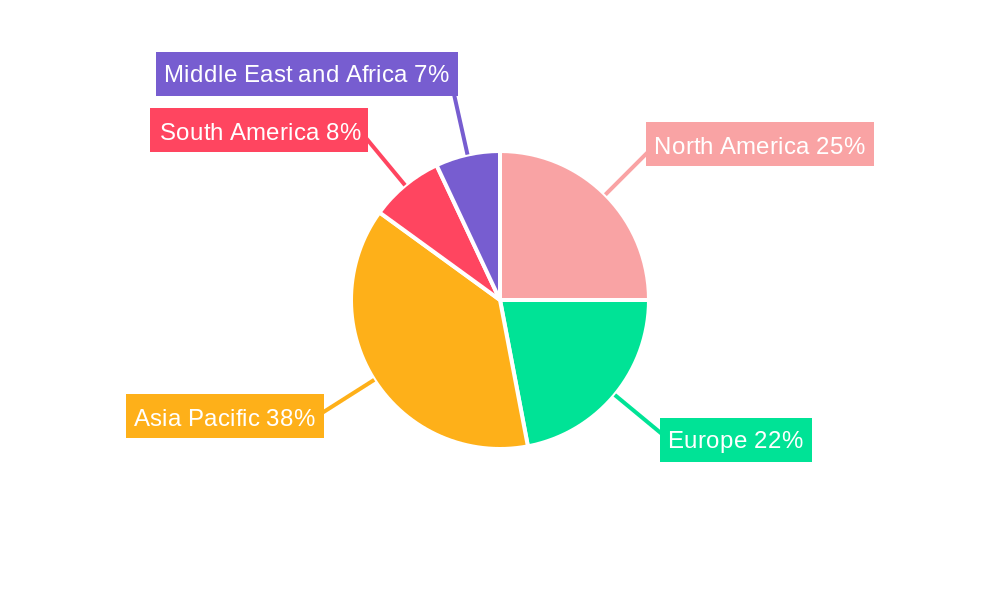
Industrial Gas Market Regional Market Share
Geographic Coverage of Industrial Gas Market
Industrial Gas Market REPORT HIGHLIGHTS
| Aspects | Details |
|---|---|
| Study Period | 2020-2034 |
| Base Year | 2025 |
| Estimated Year | 2026 |
| Forecast Period | 2026-2034 |
| Historical Period | 2020-2025 |
| Growth Rate | CAGR of 4.4% from 2020-2034 |
| Segmentation |
|
Table of Contents
- 1. Introduction
- 1.1. Research Scope
- 1.2. Market Segmentation
- 1.3. Research Objective
- 1.4. Definitions and Assumptions
- 2. Executive Summary
- 2.1. Market Snapshot
- 3. Market Dynamics
- 3.1. Market Drivers
- 3.2. Market Restrains
- 3.3. Market Trends
- 3.4. Market Opportunities
- 4. Market Factor Analysis
- 4.1. Porters Five Forces
- 4.1.1. Bargaining Power of Suppliers
- 4.1.2. Bargaining Power of Buyers
- 4.1.3. Threat of New Entrants
- 4.1.4. Threat of Substitutes
- 4.1.5. Competitive Rivalry
- 4.2. PESTEL analysis
- 4.3. BCG Analysis
- 4.3.1. Stars (High Growth, High Market Share)
- 4.3.2. Cash Cows (Low Growth, High Market Share)
- 4.3.3. Question Mark (High Growth, Low Market Share)
- 4.3.4. Dogs (Low Growth, Low Market Share)
- 4.4. Ansoff Matrix Analysis
- 4.5. Supply Chain Analysis
- 4.6. Regulatory Landscape
- 4.7. Current Market Potential and Opportunity Assessment (TAM–SAM–SOM Framework)
- 4.8. IMR Analyst Note
- 4.1. Porters Five Forces
- 5. Market Analysis, Insights and Forecast 2021-2033
- 5.1. Market Analysis, Insights and Forecast - by Product Type
- 5.1.1. Nitrogen
- 5.1.2. Oxygen
- 5.1.3. Carbon dioxide
- 5.1.4. Hydrogen
- 5.1.5. Helium
- 5.1.6. Argon
- 5.1.7. Ammonia
- 5.1.8. Methane
- 5.1.9. Propane
- 5.1.10. Butane
- 5.1.11. Other Product Types
- 5.2. Market Analysis, Insights and Forecast - by End-user Industry
- 5.2.1. Chemical Processing and Refining
- 5.2.2. Electronics
- 5.2.3. Food and Beverage
- 5.2.4. Oil and Gas
- 5.2.5. Metal Manufacturing and Fabrication
- 5.2.6. Medical and Pharmaceutical
- 5.2.7. Automotive and Transportation
- 5.2.8. Energy and Power
- 5.2.9. Other End-user Industries
- 5.3. Market Analysis, Insights and Forecast - by Region
- 5.3.1. Asia Pacific
- 5.3.2. North America
- 5.3.3. Europe
- 5.3.4. South America
- 5.3.5. Middle East and Africa
- 5.1. Market Analysis, Insights and Forecast - by Product Type
- 6. Global Industrial Gas Market Analysis, Insights and Forecast, 2021-2033
- 6.1. Market Analysis, Insights and Forecast - by Product Type
- 6.1.1. Nitrogen
- 6.1.2. Oxygen
- 6.1.3. Carbon dioxide
- 6.1.4. Hydrogen
- 6.1.5. Helium
- 6.1.6. Argon
- 6.1.7. Ammonia
- 6.1.8. Methane
- 6.1.9. Propane
- 6.1.10. Butane
- 6.1.11. Other Product Types
- 6.2. Market Analysis, Insights and Forecast - by End-user Industry
- 6.2.1. Chemical Processing and Refining
- 6.2.2. Electronics
- 6.2.3. Food and Beverage
- 6.2.4. Oil and Gas
- 6.2.5. Metal Manufacturing and Fabrication
- 6.2.6. Medical and Pharmaceutical
- 6.2.7. Automotive and Transportation
- 6.2.8. Energy and Power
- 6.2.9. Other End-user Industries
- 6.1. Market Analysis, Insights and Forecast - by Product Type
- 7. Asia Pacific Industrial Gas Market Analysis, Insights and Forecast, 2020-2032
- 7.1. Market Analysis, Insights and Forecast - by Product Type
- 7.1.1. Nitrogen
- 7.1.2. Oxygen
- 7.1.3. Carbon dioxide
- 7.1.4. Hydrogen
- 7.1.5. Helium
- 7.1.6. Argon
- 7.1.7. Ammonia
- 7.1.8. Methane
- 7.1.9. Propane
- 7.1.10. Butane
- 7.1.11. Other Product Types
- 7.2. Market Analysis, Insights and Forecast - by End-user Industry
- 7.2.1. Chemical Processing and Refining
- 7.2.2. Electronics
- 7.2.3. Food and Beverage
- 7.2.4. Oil and Gas
- 7.2.5. Metal Manufacturing and Fabrication
- 7.2.6. Medical and Pharmaceutical
- 7.2.7. Automotive and Transportation
- 7.2.8. Energy and Power
- 7.2.9. Other End-user Industries
- 7.1. Market Analysis, Insights and Forecast - by Product Type
- 8. North America Industrial Gas Market Analysis, Insights and Forecast, 2020-2032
- 8.1. Market Analysis, Insights and Forecast - by Product Type
- 8.1.1. Nitrogen
- 8.1.2. Oxygen
- 8.1.3. Carbon dioxide
- 8.1.4. Hydrogen
- 8.1.5. Helium
- 8.1.6. Argon
- 8.1.7. Ammonia
- 8.1.8. Methane
- 8.1.9. Propane
- 8.1.10. Butane
- 8.1.11. Other Product Types
- 8.2. Market Analysis, Insights and Forecast - by End-user Industry
- 8.2.1. Chemical Processing and Refining
- 8.2.2. Electronics
- 8.2.3. Food and Beverage
- 8.2.4. Oil and Gas
- 8.2.5. Metal Manufacturing and Fabrication
- 8.2.6. Medical and Pharmaceutical
- 8.2.7. Automotive and Transportation
- 8.2.8. Energy and Power
- 8.2.9. Other End-user Industries
- 8.1. Market Analysis, Insights and Forecast - by Product Type
- 9. Europe Industrial Gas Market Analysis, Insights and Forecast, 2020-2032
- 9.1. Market Analysis, Insights and Forecast - by Product Type
- 9.1.1. Nitrogen
- 9.1.2. Oxygen
- 9.1.3. Carbon dioxide
- 9.1.4. Hydrogen
- 9.1.5. Helium
- 9.1.6. Argon
- 9.1.7. Ammonia
- 9.1.8. Methane
- 9.1.9. Propane
- 9.1.10. Butane
- 9.1.11. Other Product Types
- 9.2. Market Analysis, Insights and Forecast - by End-user Industry
- 9.2.1. Chemical Processing and Refining
- 9.2.2. Electronics
- 9.2.3. Food and Beverage
- 9.2.4. Oil and Gas
- 9.2.5. Metal Manufacturing and Fabrication
- 9.2.6. Medical and Pharmaceutical
- 9.2.7. Automotive and Transportation
- 9.2.8. Energy and Power
- 9.2.9. Other End-user Industries
- 9.1. Market Analysis, Insights and Forecast - by Product Type
- 10. South America Industrial Gas Market Analysis, Insights and Forecast, 2020-2032
- 10.1. Market Analysis, Insights and Forecast - by Product Type
- 10.1.1. Nitrogen
- 10.1.2. Oxygen
- 10.1.3. Carbon dioxide
- 10.1.4. Hydrogen
- 10.1.5. Helium
- 10.1.6. Argon
- 10.1.7. Ammonia
- 10.1.8. Methane
- 10.1.9. Propane
- 10.1.10. Butane
- 10.1.11. Other Product Types
- 10.2. Market Analysis, Insights and Forecast - by End-user Industry
- 10.2.1. Chemical Processing and Refining
- 10.2.2. Electronics
- 10.2.3. Food and Beverage
- 10.2.4. Oil and Gas
- 10.2.5. Metal Manufacturing and Fabrication
- 10.2.6. Medical and Pharmaceutical
- 10.2.7. Automotive and Transportation
- 10.2.8. Energy and Power
- 10.2.9. Other End-user Industries
- 10.1. Market Analysis, Insights and Forecast - by Product Type
- 11. Middle East and Africa Industrial Gas Market Analysis, Insights and Forecast, 2020-2032
- 11.1. Market Analysis, Insights and Forecast - by Product Type
- 11.1.1. Nitrogen
- 11.1.2. Oxygen
- 11.1.3. Carbon dioxide
- 11.1.4. Hydrogen
- 11.1.5. Helium
- 11.1.6. Argon
- 11.1.7. Ammonia
- 11.1.8. Methane
- 11.1.9. Propane
- 11.1.10. Butane
- 11.1.11. Other Product Types
- 11.2. Market Analysis, Insights and Forecast - by End-user Industry
- 11.2.1. Chemical Processing and Refining
- 11.2.2. Electronics
- 11.2.3. Food and Beverage
- 11.2.4. Oil and Gas
- 11.2.5. Metal Manufacturing and Fabrication
- 11.2.6. Medical and Pharmaceutical
- 11.2.7. Automotive and Transportation
- 11.2.8. Energy and Power
- 11.2.9. Other End-user Industries
- 11.1. Market Analysis, Insights and Forecast - by Product Type
- 12. Competitive Analysis
- 12.1. Company Profiles
- 12.1.1 PT Samator Indo Gas TBK
- 12.1.1.1. Company Overview
- 12.1.1.2. Products
- 12.1.1.3. Company Financials
- 12.1.1.4. SWOT Analysis
- 12.1.2 Linde PLC
- 12.1.2.1. Company Overview
- 12.1.2.2. Products
- 12.1.2.3. Company Financials
- 12.1.2.4. SWOT Analysis
- 12.1.3 Ellenbarrie industrial Gases
- 12.1.3.1. Company Overview
- 12.1.3.2. Products
- 12.1.3.3. Company Financials
- 12.1.3.4. SWOT Analysis
- 12.1.4 Air Products and Chemicals Inc
- 12.1.4.1. Company Overview
- 12.1.4.2. Products
- 12.1.4.3. Company Financials
- 12.1.4.4. SWOT Analysis
- 12.1.5 Gruppo SIAD
- 12.1.5.1. Company Overview
- 12.1.5.2. Products
- 12.1.5.3. Company Financials
- 12.1.5.4. SWOT Analysis
- 12.1.6 Bhuruka Gases Limited
- 12.1.6.1. Company Overview
- 12.1.6.2. Products
- 12.1.6.3. Company Financials
- 12.1.6.4. SWOT Analysis
- 12.1.7 BASF SE
- 12.1.7.1. Company Overview
- 12.1.7.2. Products
- 12.1.7.3. Company Financials
- 12.1.7.4. SWOT Analysis
- 12.1.8 Iwatani Corporation
- 12.1.8.1. Company Overview
- 12.1.8.2. Products
- 12.1.8.3. Company Financials
- 12.1.8.4. SWOT Analysis
- 12.1.9 Asia Technical Gas Co Pte Ltd
- 12.1.9.1. Company Overview
- 12.1.9.2. Products
- 12.1.9.3. Company Financials
- 12.1.9.4. SWOT Analysis
- 12.1.10 Sapio Group
- 12.1.10.1. Company Overview
- 12.1.10.2. Products
- 12.1.10.3. Company Financials
- 12.1.10.4. SWOT Analysis
- 12.1.11 Messer Group GmbH
- 12.1.11.1. Company Overview
- 12.1.11.2. Products
- 12.1.11.3. Company Financials
- 12.1.11.4. SWOT Analysis
- 12.1.12 Yingde Gases Group*List Not Exhaustive
- 12.1.12.1. Company Overview
- 12.1.12.2. Products
- 12.1.12.3. Company Financials
- 12.1.12.4. SWOT Analysis
- 12.1.13 Air Liquide
- 12.1.13.1. Company Overview
- 12.1.13.2. Products
- 12.1.13.3. Company Financials
- 12.1.13.4. SWOT Analysis
- 12.1.14 Nippon Sanso Holdings Corporation
- 12.1.14.1. Company Overview
- 12.1.14.2. Products
- 12.1.14.3. Company Financials
- 12.1.14.4. SWOT Analysis
- 12.1.15 SOL SPA
- 12.1.15.1. Company Overview
- 12.1.15.2. Products
- 12.1.15.3. Company Financials
- 12.1.15.4. SWOT Analysis
- 12.1.1 PT Samator Indo Gas TBK
- 12.2. Market Entropy
- 12.2.1 Company's Key Areas Served
- 12.2.2 Recent Developments
- 12.3. Company Market Share Analysis 2025
- 12.3.1 Top 5 Companies Market Share Analysis
- 12.3.2 Top 3 Companies Market Share Analysis
- 12.4. List of Potential Customers
- 13. Research Methodology
List of Figures
- Figure 1: Global Industrial Gas Market Revenue Breakdown (billion, %) by Region 2025 & 2033
- Figure 2: Global Industrial Gas Market Volume Breakdown (K Tons, %) by Region 2025 & 2033
- Figure 3: Asia Pacific Industrial Gas Market Revenue (billion), by Product Type 2025 & 2033
- Figure 4: Asia Pacific Industrial Gas Market Volume (K Tons), by Product Type 2025 & 2033
- Figure 5: Asia Pacific Industrial Gas Market Revenue Share (%), by Product Type 2025 & 2033
- Figure 6: Asia Pacific Industrial Gas Market Volume Share (%), by Product Type 2025 & 2033
- Figure 7: Asia Pacific Industrial Gas Market Revenue (billion), by End-user Industry 2025 & 2033
- Figure 8: Asia Pacific Industrial Gas Market Volume (K Tons), by End-user Industry 2025 & 2033
- Figure 9: Asia Pacific Industrial Gas Market Revenue Share (%), by End-user Industry 2025 & 2033
- Figure 10: Asia Pacific Industrial Gas Market Volume Share (%), by End-user Industry 2025 & 2033
- Figure 11: Asia Pacific Industrial Gas Market Revenue (billion), by Country 2025 & 2033
- Figure 12: Asia Pacific Industrial Gas Market Volume (K Tons), by Country 2025 & 2033
- Figure 13: Asia Pacific Industrial Gas Market Revenue Share (%), by Country 2025 & 2033
- Figure 14: Asia Pacific Industrial Gas Market Volume Share (%), by Country 2025 & 2033
- Figure 15: North America Industrial Gas Market Revenue (billion), by Product Type 2025 & 2033
- Figure 16: North America Industrial Gas Market Volume (K Tons), by Product Type 2025 & 2033
- Figure 17: North America Industrial Gas Market Revenue Share (%), by Product Type 2025 & 2033
- Figure 18: North America Industrial Gas Market Volume Share (%), by Product Type 2025 & 2033
- Figure 19: North America Industrial Gas Market Revenue (billion), by End-user Industry 2025 & 2033
- Figure 20: North America Industrial Gas Market Volume (K Tons), by End-user Industry 2025 & 2033
- Figure 21: North America Industrial Gas Market Revenue Share (%), by End-user Industry 2025 & 2033
- Figure 22: North America Industrial Gas Market Volume Share (%), by End-user Industry 2025 & 2033
- Figure 23: North America Industrial Gas Market Revenue (billion), by Country 2025 & 2033
- Figure 24: North America Industrial Gas Market Volume (K Tons), by Country 2025 & 2033
- Figure 25: North America Industrial Gas Market Revenue Share (%), by Country 2025 & 2033
- Figure 26: North America Industrial Gas Market Volume Share (%), by Country 2025 & 2033
- Figure 27: Europe Industrial Gas Market Revenue (billion), by Product Type 2025 & 2033
- Figure 28: Europe Industrial Gas Market Volume (K Tons), by Product Type 2025 & 2033
- Figure 29: Europe Industrial Gas Market Revenue Share (%), by Product Type 2025 & 2033
- Figure 30: Europe Industrial Gas Market Volume Share (%), by Product Type 2025 & 2033
- Figure 31: Europe Industrial Gas Market Revenue (billion), by End-user Industry 2025 & 2033
- Figure 32: Europe Industrial Gas Market Volume (K Tons), by End-user Industry 2025 & 2033
- Figure 33: Europe Industrial Gas Market Revenue Share (%), by End-user Industry 2025 & 2033
- Figure 34: Europe Industrial Gas Market Volume Share (%), by End-user Industry 2025 & 2033
- Figure 35: Europe Industrial Gas Market Revenue (billion), by Country 2025 & 2033
- Figure 36: Europe Industrial Gas Market Volume (K Tons), by Country 2025 & 2033
- Figure 37: Europe Industrial Gas Market Revenue Share (%), by Country 2025 & 2033
- Figure 38: Europe Industrial Gas Market Volume Share (%), by Country 2025 & 2033
- Figure 39: South America Industrial Gas Market Revenue (billion), by Product Type 2025 & 2033
- Figure 40: South America Industrial Gas Market Volume (K Tons), by Product Type 2025 & 2033
- Figure 41: South America Industrial Gas Market Revenue Share (%), by Product Type 2025 & 2033
- Figure 42: South America Industrial Gas Market Volume Share (%), by Product Type 2025 & 2033
- Figure 43: South America Industrial Gas Market Revenue (billion), by End-user Industry 2025 & 2033
- Figure 44: South America Industrial Gas Market Volume (K Tons), by End-user Industry 2025 & 2033
- Figure 45: South America Industrial Gas Market Revenue Share (%), by End-user Industry 2025 & 2033
- Figure 46: South America Industrial Gas Market Volume Share (%), by End-user Industry 2025 & 2033
- Figure 47: South America Industrial Gas Market Revenue (billion), by Country 2025 & 2033
- Figure 48: South America Industrial Gas Market Volume (K Tons), by Country 2025 & 2033
- Figure 49: South America Industrial Gas Market Revenue Share (%), by Country 2025 & 2033
- Figure 50: South America Industrial Gas Market Volume Share (%), by Country 2025 & 2033
- Figure 51: Middle East and Africa Industrial Gas Market Revenue (billion), by Product Type 2025 & 2033
- Figure 52: Middle East and Africa Industrial Gas Market Volume (K Tons), by Product Type 2025 & 2033
- Figure 53: Middle East and Africa Industrial Gas Market Revenue Share (%), by Product Type 2025 & 2033
- Figure 54: Middle East and Africa Industrial Gas Market Volume Share (%), by Product Type 2025 & 2033
- Figure 55: Middle East and Africa Industrial Gas Market Revenue (billion), by End-user Industry 2025 & 2033
- Figure 56: Middle East and Africa Industrial Gas Market Volume (K Tons), by End-user Industry 2025 & 2033
- Figure 57: Middle East and Africa Industrial Gas Market Revenue Share (%), by End-user Industry 2025 & 2033
- Figure 58: Middle East and Africa Industrial Gas Market Volume Share (%), by End-user Industry 2025 & 2033
- Figure 59: Middle East and Africa Industrial Gas Market Revenue (billion), by Country 2025 & 2033
- Figure 60: Middle East and Africa Industrial Gas Market Volume (K Tons), by Country 2025 & 2033
- Figure 61: Middle East and Africa Industrial Gas Market Revenue Share (%), by Country 2025 & 2033
- Figure 62: Middle East and Africa Industrial Gas Market Volume Share (%), by Country 2025 & 2033
List of Tables
- Table 1: Global Industrial Gas Market Revenue billion Forecast, by Product Type 2020 & 2033
- Table 2: Global Industrial Gas Market Volume K Tons Forecast, by Product Type 2020 & 2033
- Table 3: Global Industrial Gas Market Revenue billion Forecast, by End-user Industry 2020 & 2033
- Table 4: Global Industrial Gas Market Volume K Tons Forecast, by End-user Industry 2020 & 2033
- Table 5: Global Industrial Gas Market Revenue billion Forecast, by Region 2020 & 2033
- Table 6: Global Industrial Gas Market Volume K Tons Forecast, by Region 2020 & 2033
- Table 7: Global Industrial Gas Market Revenue billion Forecast, by Product Type 2020 & 2033
- Table 8: Global Industrial Gas Market Volume K Tons Forecast, by Product Type 2020 & 2033
- Table 9: Global Industrial Gas Market Revenue billion Forecast, by End-user Industry 2020 & 2033
- Table 10: Global Industrial Gas Market Volume K Tons Forecast, by End-user Industry 2020 & 2033
- Table 11: Global Industrial Gas Market Revenue billion Forecast, by Country 2020 & 2033
- Table 12: Global Industrial Gas Market Volume K Tons Forecast, by Country 2020 & 2033
- Table 13: China Industrial Gas Market Revenue (billion) Forecast, by Application 2020 & 2033
- Table 14: China Industrial Gas Market Volume (K Tons) Forecast, by Application 2020 & 2033
- Table 15: India Industrial Gas Market Revenue (billion) Forecast, by Application 2020 & 2033
- Table 16: India Industrial Gas Market Volume (K Tons) Forecast, by Application 2020 & 2033
- Table 17: Japan Industrial Gas Market Revenue (billion) Forecast, by Application 2020 & 2033
- Table 18: Japan Industrial Gas Market Volume (K Tons) Forecast, by Application 2020 & 2033
- Table 19: South Korea Industrial Gas Market Revenue (billion) Forecast, by Application 2020 & 2033
- Table 20: South Korea Industrial Gas Market Volume (K Tons) Forecast, by Application 2020 & 2033
- Table 21: ASEAN Countries Industrial Gas Market Revenue (billion) Forecast, by Application 2020 & 2033
- Table 22: ASEAN Countries Industrial Gas Market Volume (K Tons) Forecast, by Application 2020 & 2033
- Table 23: Rest of Asia Pacific Industrial Gas Market Revenue (billion) Forecast, by Application 2020 & 2033
- Table 24: Rest of Asia Pacific Industrial Gas Market Volume (K Tons) Forecast, by Application 2020 & 2033
- Table 25: Global Industrial Gas Market Revenue billion Forecast, by Product Type 2020 & 2033
- Table 26: Global Industrial Gas Market Volume K Tons Forecast, by Product Type 2020 & 2033
- Table 27: Global Industrial Gas Market Revenue billion Forecast, by End-user Industry 2020 & 2033
- Table 28: Global Industrial Gas Market Volume K Tons Forecast, by End-user Industry 2020 & 2033
- Table 29: Global Industrial Gas Market Revenue billion Forecast, by Country 2020 & 2033
- Table 30: Global Industrial Gas Market Volume K Tons Forecast, by Country 2020 & 2033
- Table 31: United States Industrial Gas Market Revenue (billion) Forecast, by Application 2020 & 2033
- Table 32: United States Industrial Gas Market Volume (K Tons) Forecast, by Application 2020 & 2033
- Table 33: Canada Industrial Gas Market Revenue (billion) Forecast, by Application 2020 & 2033
- Table 34: Canada Industrial Gas Market Volume (K Tons) Forecast, by Application 2020 & 2033
- Table 35: Mexico Industrial Gas Market Revenue (billion) Forecast, by Application 2020 & 2033
- Table 36: Mexico Industrial Gas Market Volume (K Tons) Forecast, by Application 2020 & 2033
- Table 37: Global Industrial Gas Market Revenue billion Forecast, by Product Type 2020 & 2033
- Table 38: Global Industrial Gas Market Volume K Tons Forecast, by Product Type 2020 & 2033
- Table 39: Global Industrial Gas Market Revenue billion Forecast, by End-user Industry 2020 & 2033
- Table 40: Global Industrial Gas Market Volume K Tons Forecast, by End-user Industry 2020 & 2033
- Table 41: Global Industrial Gas Market Revenue billion Forecast, by Country 2020 & 2033
- Table 42: Global Industrial Gas Market Volume K Tons Forecast, by Country 2020 & 2033
- Table 43: Germany Industrial Gas Market Revenue (billion) Forecast, by Application 2020 & 2033
- Table 44: Germany Industrial Gas Market Volume (K Tons) Forecast, by Application 2020 & 2033
- Table 45: United Kingdom Industrial Gas Market Revenue (billion) Forecast, by Application 2020 & 2033
- Table 46: United Kingdom Industrial Gas Market Volume (K Tons) Forecast, by Application 2020 & 2033
- Table 47: France Industrial Gas Market Revenue (billion) Forecast, by Application 2020 & 2033
- Table 48: France Industrial Gas Market Volume (K Tons) Forecast, by Application 2020 & 2033
- Table 49: Italy Industrial Gas Market Revenue (billion) Forecast, by Application 2020 & 2033
- Table 50: Italy Industrial Gas Market Volume (K Tons) Forecast, by Application 2020 & 2033
- Table 51: NORDIC Countries Industrial Gas Market Revenue (billion) Forecast, by Application 2020 & 2033
- Table 52: NORDIC Countries Industrial Gas Market Volume (K Tons) Forecast, by Application 2020 & 2033
- Table 53: Rest of Europe Industrial Gas Market Revenue (billion) Forecast, by Application 2020 & 2033
- Table 54: Rest of Europe Industrial Gas Market Volume (K Tons) Forecast, by Application 2020 & 2033
- Table 55: Global Industrial Gas Market Revenue billion Forecast, by Product Type 2020 & 2033
- Table 56: Global Industrial Gas Market Volume K Tons Forecast, by Product Type 2020 & 2033
- Table 57: Global Industrial Gas Market Revenue billion Forecast, by End-user Industry 2020 & 2033
- Table 58: Global Industrial Gas Market Volume K Tons Forecast, by End-user Industry 2020 & 2033
- Table 59: Global Industrial Gas Market Revenue billion Forecast, by Country 2020 & 2033
- Table 60: Global Industrial Gas Market Volume K Tons Forecast, by Country 2020 & 2033
- Table 61: Brazil Industrial Gas Market Revenue (billion) Forecast, by Application 2020 & 2033
- Table 62: Brazil Industrial Gas Market Volume (K Tons) Forecast, by Application 2020 & 2033
- Table 63: Argentina Industrial Gas Market Revenue (billion) Forecast, by Application 2020 & 2033
- Table 64: Argentina Industrial Gas Market Volume (K Tons) Forecast, by Application 2020 & 2033
- Table 65: Rest of South America Industrial Gas Market Revenue (billion) Forecast, by Application 2020 & 2033
- Table 66: Rest of South America Industrial Gas Market Volume (K Tons) Forecast, by Application 2020 & 2033
- Table 67: Global Industrial Gas Market Revenue billion Forecast, by Product Type 2020 & 2033
- Table 68: Global Industrial Gas Market Volume K Tons Forecast, by Product Type 2020 & 2033
- Table 69: Global Industrial Gas Market Revenue billion Forecast, by End-user Industry 2020 & 2033
- Table 70: Global Industrial Gas Market Volume K Tons Forecast, by End-user Industry 2020 & 2033
- Table 71: Global Industrial Gas Market Revenue billion Forecast, by Country 2020 & 2033
- Table 72: Global Industrial Gas Market Volume K Tons Forecast, by Country 2020 & 2033
- Table 73: Saudi Arabia Industrial Gas Market Revenue (billion) Forecast, by Application 2020 & 2033
- Table 74: Saudi Arabia Industrial Gas Market Volume (K Tons) Forecast, by Application 2020 & 2033
- Table 75: South Africa Industrial Gas Market Revenue (billion) Forecast, by Application 2020 & 2033
- Table 76: South Africa Industrial Gas Market Volume (K Tons) Forecast, by Application 2020 & 2033
- Table 77: Rest of Middle East and Africa Industrial Gas Market Revenue (billion) Forecast, by Application 2020 & 2033
- Table 78: Rest of Middle East and Africa Industrial Gas Market Volume (K Tons) Forecast, by Application 2020 & 2033
Frequently Asked Questions
1. What is the projected Compound Annual Growth Rate (CAGR) of the Industrial Gas Market?
The projected CAGR is approximately 4.4%.
2. Which companies are prominent players in the Industrial Gas Market?
Key companies in the market include PT Samator Indo Gas TBK, Linde PLC, Ellenbarrie industrial Gases, Air Products and Chemicals Inc, Gruppo SIAD, Bhuruka Gases Limited, BASF SE, Iwatani Corporation, Asia Technical Gas Co Pte Ltd, Sapio Group, Messer Group GmbH, Yingde Gases Group*List Not Exhaustive, Air Liquide, Nippon Sanso Holdings Corporation, SOL SPA.
3. What are the main segments of the Industrial Gas Market?
The market segments include Product Type, End-user Industry.
4. Can you provide details about the market size?
The market size is estimated to be USD 119.11 billion as of 2022.
5. What are some drivers contributing to market growth?
Growing Need for Alternate Energy Sources; Increasing Demand For Frozen and Stored Food; Increasing Demand from the Healthcare Sector.
6. What are the notable trends driving market growth?
Increasing Demand from the Medical and Pharmaceutical Sector.
7. Are there any restraints impacting market growth?
Environmental Regulations and Safety Issues; Other Restraints.
8. Can you provide examples of recent developments in the market?
April 2023: Nippon Gases Operations, a division of Nippon Gases Italia, announced the signing of an agreement with Enel Green Power Italia to construct a new plant for the reuse, purification, and liquefaction of CO2, naturally present in the geothermal fluids of the Piancastagnaio power plants in the province of Siena for food purposes. The significant investment is part of a series of operations planned by the company in Italy to improve production capacity, competitiveness, and customer closeness, emphasizing long-term growth.
9. What pricing options are available for accessing the report?
Pricing options include single-user, multi-user, and enterprise licenses priced at USD 4750, USD 5250, and USD 8750 respectively.
10. Is the market size provided in terms of value or volume?
The market size is provided in terms of value, measured in billion and volume, measured in K Tons.
11. Are there any specific market keywords associated with the report?
Yes, the market keyword associated with the report is "Industrial Gas Market," which aids in identifying and referencing the specific market segment covered.
12. How do I determine which pricing option suits my needs best?
The pricing options vary based on user requirements and access needs. Individual users may opt for single-user licenses, while businesses requiring broader access may choose multi-user or enterprise licenses for cost-effective access to the report.
13. Are there any additional resources or data provided in the Industrial Gas Market report?
While the report offers comprehensive insights, it's advisable to review the specific contents or supplementary materials provided to ascertain if additional resources or data are available.
14. How can I stay updated on further developments or reports in the Industrial Gas Market?
To stay informed about further developments, trends, and reports in the Industrial Gas Market, consider subscribing to industry newsletters, following relevant companies and organizations, or regularly checking reputable industry news sources and publications.
Methodology
Step 1 - Identification of Relevant Samples Size from Population Database


Step 2 - Approaches for Defining Global Market Size (Value, Volume* & Price*)

Note*: In applicable scenarios
Step 3 - Data Sources
Primary Research
- Web Analytics
- Survey Reports
- Research Institute
- Latest Research Reports
- Opinion Leaders
Secondary Research
- Annual Reports
- White Paper
- Latest Press Release
- Industry Association
- Paid Database
- Investor Presentations

Step 4 - Data Triangulation
Involves using different sources of information in order to increase the validity of a study
These sources are likely to be stakeholders in a program - participants, other researchers, program staff, other community members, and so on.
Then we put all data in single framework & apply various statistical tools to find out the dynamic on the market.
During the analysis stage, feedback from the stakeholder groups would be compared to determine areas of agreement as well as areas of divergence