

Key Insights
The industrial nitrogen market, valued at $21.18 billion in 2025, is projected for substantial expansion. This growth is underpinned by a compound annual growth rate (CAGR) of 6.6% from 2025 to 2033. Key drivers include escalating demand from the chemical and pharmaceutical sectors, essential for processes like ammonia synthesis and inerting. The healthcare industry's increasing utilization in cryogenics and medical applications further bolsters market growth. Additionally, the transportation sector's adoption of nitrogen for tire inflation and related uses contributes to this expansion. Innovations in nitrogen storage and delivery systems, including advanced cylinder designs and packaged gas solutions, are enhancing operational efficiency and reducing costs, thereby stimulating market development. The Asia-Pacific region, with China and India leading, is poised for significant growth due to rapid industrialization and escalating consumption across diverse end-user industries.
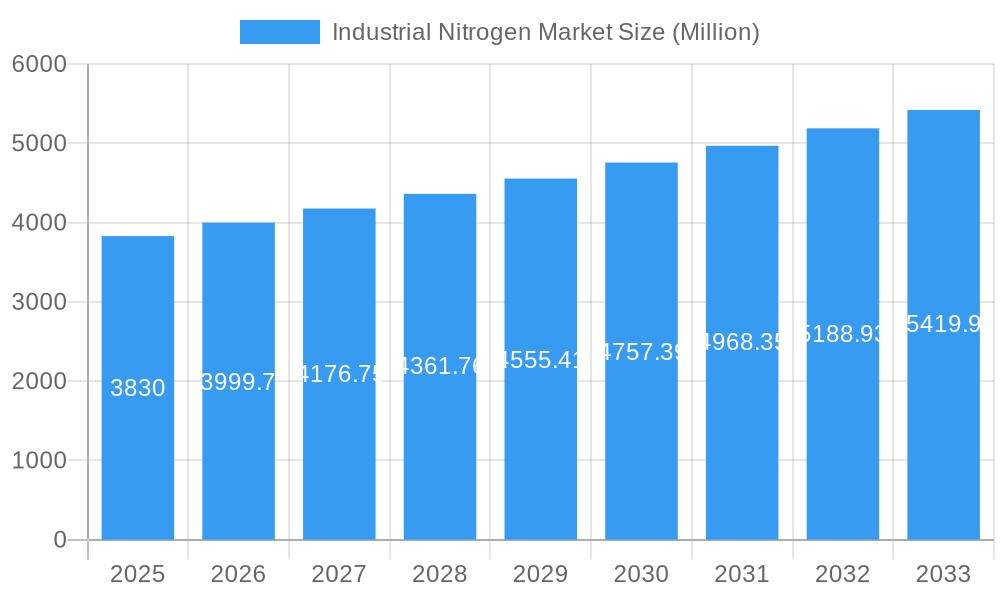
Industrial Nitrogen Market Market Size (In Billion)
Despite potential headwinds from fluctuating raw material costs and stringent environmental regulations, the long-term outlook for the industrial nitrogen market remains optimistic. Continued expansion of manufacturing capabilities in emerging economies, coupled with advancements in energy-efficient production methods, will fuel further market development. A growing emphasis on sustainable practices and environmentally friendly solutions is expected to drive innovation, with companies prioritizing efficient resource management and reduced carbon footprints. The competitive landscape features both global enterprises and regional specialists, fostering continuous innovation and market diversification. The forecast period (2025-2033) presents substantial opportunities for stakeholders prepared to address evolving industry requirements and capitalize on technological advancements to optimize production and logistics.
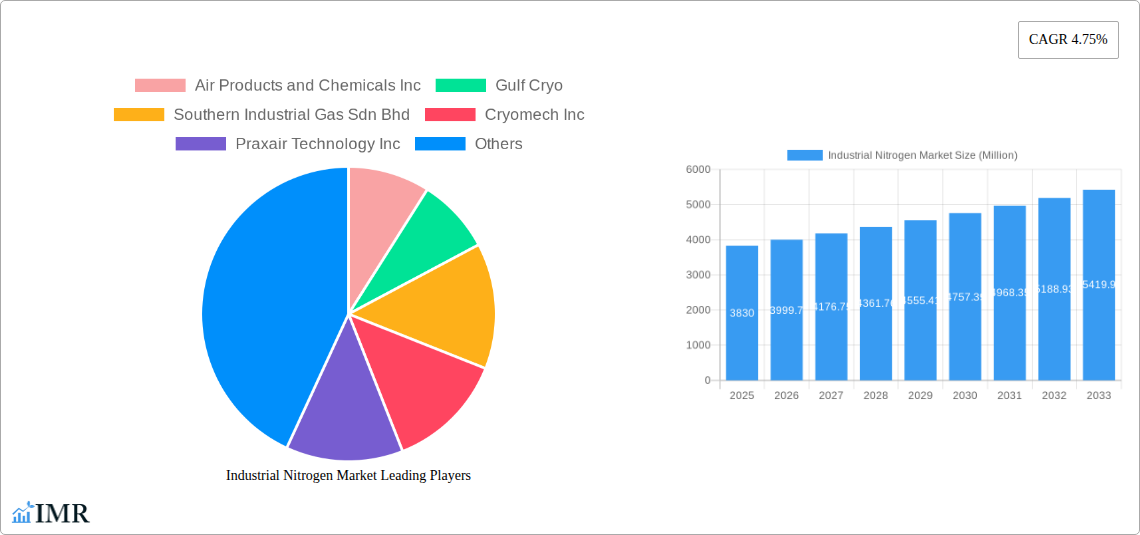
Industrial Nitrogen Market Company Market Share
Industrial Nitrogen Market: A Comprehensive Report (2019-2033)
This comprehensive report provides a detailed analysis of the Industrial Nitrogen Market, encompassing market dynamics, growth trends, regional insights, product landscape, and key players. The study period covers 2019-2033, with 2025 serving as the base and estimated year. The report is invaluable for industry professionals, investors, and strategic decision-makers seeking to understand and capitalize on opportunities within this dynamic market. The report delves into parent market segments like industrial gases and child market segments such as refrigerant gases and coolant gases, providing a holistic view of the landscape.
Industrial Nitrogen Market Dynamics & Structure
The Industrial Nitrogen Market is characterized by a moderately concentrated structure with several major players dominating the landscape. Market share is influenced by factors such as production capacity, geographic reach, and technological innovation. The market is driven by advancements in cryogenic technologies, increasing demand from key end-user industries, and supportive government regulations. However, challenges include fluctuating raw material prices, stringent safety regulations, and the emergence of competitive substitute technologies.
- Market Concentration: Moderate, with top 5 players holding approximately xx% market share (2024).
- Technological Innovation: Continuous improvements in air separation units (ASUs) and cryogenic storage technologies are key drivers.
- Regulatory Framework: Stringent safety and environmental regulations influence operational costs and expansion strategies.
- Competitive Substitutes: Limited direct substitutes, but alternative cooling technologies pose indirect competition.
- End-User Demographics: Significant growth driven by expanding chemical, pharmaceutical, and healthcare sectors.
- M&A Trends: A moderate number of mergers and acquisitions (M&A) activity observed in recent years, xx deals in the last 5 years.
Industrial Nitrogen Market Growth Trends & Insights
The Industrial Nitrogen Market is experiencing robust growth, fueled by increasing demand across diverse sectors. The market size is estimated at xx Million units in 2025 and is projected to reach xx Million units by 2033, exhibiting a CAGR of xx% during the forecast period. This growth is driven by rising industrial activity, particularly in emerging economies, and the increasing adoption of nitrogen in various applications. Technological advancements, such as the development of more efficient and cost-effective production methods, are further accelerating market expansion. Consumer behavior shifts towards sustainable practices and environmentally friendly solutions are also shaping market dynamics.
Dominant Regions, Countries, or Segments in Industrial Nitrogen Market
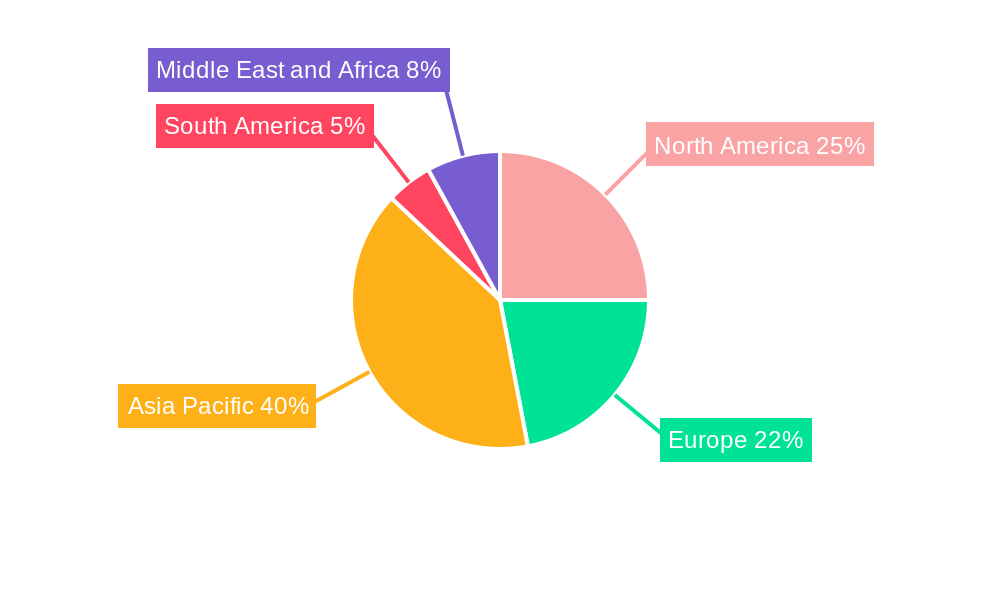
North America and Asia-Pacific are currently the dominant regions in the Industrial Nitrogen Market, driven by robust industrial growth and substantial investments in infrastructure development. Within these regions, specific countries like the US, China, and India are significant contributors due to their large manufacturing base and increasing demand from various end-user industries. In terms of segments, the Packaged Gas storage type enjoys significant traction, especially within the chemical and pharmaceutical segments.
- Key Drivers:
- Economic Growth: Expanding economies in Asia-Pacific and North America fuel demand.
- Industrialization: Rapid industrialization in emerging economies creates significant opportunities.
- Technological Advancements: Efficient production methods and innovative applications drive growth.
- Dominant Segments:
- Storage Type: Packaged Gas holds the largest market share due to convenience and ease of handling.
- Function: Coolant applications dominate due to wide-ranging industrial use.
- End-user Industry: Chemical and Pharmaceutical industry is the largest consumer.
Industrial Nitrogen Market Product Landscape
The Industrial Nitrogen Market offers a range of products catering to different applications and end-user needs. Products are categorized based on purity levels, delivery methods (bulk, cylinders, packaged gas), and storage types. Recent innovations focus on improving efficiency, safety, and sustainability. Unique selling propositions center around superior purity, reliable supply chains, and environmentally conscious production processes. Technological advancements focus on enhancing ASU efficiency, developing more durable storage containers, and optimizing delivery systems.
Key Drivers, Barriers & Challenges in Industrial Nitrogen Market
Key Drivers:
- Growing demand from the chemical and pharmaceutical industries.
- Increasing adoption in food preservation and cryogenic applications.
- Technological advancements leading to higher efficiency and lower production costs.
Challenges & Restraints:
- Fluctuating raw material prices (energy costs).
- Stringent safety and environmental regulations increase operational costs.
- Intense competition among established players and new entrants. Supply chain disruptions have caused price volatility impacting profitability (estimated xx% in 2024).
Emerging Opportunities in Industrial Nitrogen Market
Emerging opportunities lie in untapped markets, particularly in developing economies where industrialization is accelerating. The rising demand for sustainable solutions presents opportunities for environmentally friendly production methods and renewable energy integration in the nitrogen production process. Innovative applications in advanced materials manufacturing and medical technologies also offer substantial growth potential.
Growth Accelerators in the Industrial Nitrogen Market Industry
Strategic partnerships between nitrogen producers and end-users are vital for long-term growth. The development of new applications, such as in advanced materials processing and energy storage, could significantly accelerate market expansion. Expansion into underserved markets and the adoption of digital technologies to optimize operations are also key growth catalysts.
Key Players Shaping the Industrial Nitrogen Market Market
- Air Products and Chemicals Inc
- Gulf Cryo
- Southern Industrial Gas Sdn Bhd
- Cryomech Inc
- Praxair Technology Inc
- Linde plc
- TAIYO NIPPON SANSO CORPORATION
- MVS Engineering Pvt Ltd
- Messer Group
- Air Liquide
Notable Milestones in Industrial Nitrogen Market Sector
- April 2022: Linde plc's capacity expansion to meet growing aerospace and other industrial demands illustrates increased market activity and growth projections.
- February 2022: INOX Air Products' new plant in India highlights the substantial investment and growing demand in emerging markets.
In-Depth Industrial Nitrogen Market Market Outlook
The Industrial Nitrogen Market is poised for continued growth driven by factors including increasing industrialization, technological innovation, and the development of new applications across various sectors. Strategic partnerships, geographical expansion, and a focus on sustainability will be critical for success in this competitive landscape. The market presents significant opportunities for established players and new entrants alike, promising a robust and dynamic future.
Industrial Nitrogen Market Segmentation
-
1. Storage Type
- 1.1. Cylinder
- 1.2. Packaged Gas
-
2. Function
- 2.1. Coolant
- 2.2. Refrigerant
-
3. End-user Industry
- 3.1. Chemical and Pharmaceutical
- 3.2. Healthcare
- 3.3. Transportation
- 3.4. Other End-user Industries
Industrial Nitrogen Market Segmentation By Geography
-
1. Asia Pacific
- 1.1. China
- 1.2. India
- 1.3. Japan
- 1.4. South Korea
- 1.5. Rest of Asia Pacific
-
2. North America
- 2.1. United States
- 2.2. Canada
- 2.3. Mexico
-
3. Europe
- 3.1. Germany
- 3.2. United Kingdom
- 3.3. Italy
- 3.4. France
- 3.5. Rest of Europe
-
4. South America
- 4.1. Brazil
- 4.2. Argentina
- 4.3. Rest of South America
-
5. Middle East and Africa
- 5.1. Saudi Arabia
- 5.2. South Africa
- 5.3. Rest of Middle East and Africa
Industrial Nitrogen Market Regional Market Share
Geographic Coverage of Industrial Nitrogen Market
Industrial Nitrogen Market REPORT HIGHLIGHTS
| Aspects | Details |
|---|---|
| Study Period | 2020-2034 |
| Base Year | 2025 |
| Estimated Year | 2026 |
| Forecast Period | 2026-2034 |
| Historical Period | 2020-2025 |
| Growth Rate | CAGR of 6.6% from 2020-2034 |
| Segmentation |
|
Table of Contents
- 1. Introduction
- 1.1. Research Scope
- 1.2. Market Segmentation
- 1.3. Research Objective
- 1.4. Definitions and Assumptions
- 2. Executive Summary
- 2.1. Market Snapshot
- 3. Market Dynamics
- 3.1. Market Drivers
- 3.2. Market Restrains
- 3.3. Market Trends
- 3.4. Market Opportunities
- 4. Market Factor Analysis
- 4.1. Porters Five Forces
- 4.1.1. Bargaining Power of Suppliers
- 4.1.2. Bargaining Power of Buyers
- 4.1.3. Threat of New Entrants
- 4.1.4. Threat of Substitutes
- 4.1.5. Competitive Rivalry
- 4.2. PESTEL analysis
- 4.3. BCG Analysis
- 4.3.1. Stars (High Growth, High Market Share)
- 4.3.2. Cash Cows (Low Growth, High Market Share)
- 4.3.3. Question Mark (High Growth, Low Market Share)
- 4.3.4. Dogs (Low Growth, Low Market Share)
- 4.4. Ansoff Matrix Analysis
- 4.5. Supply Chain Analysis
- 4.6. Regulatory Landscape
- 4.7. Current Market Potential and Opportunity Assessment (TAM–SAM–SOM Framework)
- 4.8. IMR Analyst Note
- 4.1. Porters Five Forces
- 5. Market Analysis, Insights and Forecast 2021-2033
- 5.1. Market Analysis, Insights and Forecast - by Storage Type
- 5.1.1. Cylinder
- 5.1.2. Packaged Gas
- 5.2. Market Analysis, Insights and Forecast - by Function
- 5.2.1. Coolant
- 5.2.2. Refrigerant
- 5.3. Market Analysis, Insights and Forecast - by End-user Industry
- 5.3.1. Chemical and Pharmaceutical
- 5.3.2. Healthcare
- 5.3.3. Transportation
- 5.3.4. Other End-user Industries
- 5.4. Market Analysis, Insights and Forecast - by Region
- 5.4.1. Asia Pacific
- 5.4.2. North America
- 5.4.3. Europe
- 5.4.4. South America
- 5.4.5. Middle East and Africa
- 5.1. Market Analysis, Insights and Forecast - by Storage Type
- 6. Global Industrial Nitrogen Market Analysis, Insights and Forecast, 2021-2033
- 6.1. Market Analysis, Insights and Forecast - by Storage Type
- 6.1.1. Cylinder
- 6.1.2. Packaged Gas
- 6.2. Market Analysis, Insights and Forecast - by Function
- 6.2.1. Coolant
- 6.2.2. Refrigerant
- 6.3. Market Analysis, Insights and Forecast - by End-user Industry
- 6.3.1. Chemical and Pharmaceutical
- 6.3.2. Healthcare
- 6.3.3. Transportation
- 6.3.4. Other End-user Industries
- 6.1. Market Analysis, Insights and Forecast - by Storage Type
- 7. Asia Pacific Industrial Nitrogen Market Analysis, Insights and Forecast, 2020-2032
- 7.1. Market Analysis, Insights and Forecast - by Storage Type
- 7.1.1. Cylinder
- 7.1.2. Packaged Gas
- 7.2. Market Analysis, Insights and Forecast - by Function
- 7.2.1. Coolant
- 7.2.2. Refrigerant
- 7.3. Market Analysis, Insights and Forecast - by End-user Industry
- 7.3.1. Chemical and Pharmaceutical
- 7.3.2. Healthcare
- 7.3.3. Transportation
- 7.3.4. Other End-user Industries
- 7.1. Market Analysis, Insights and Forecast - by Storage Type
- 8. North America Industrial Nitrogen Market Analysis, Insights and Forecast, 2020-2032
- 8.1. Market Analysis, Insights and Forecast - by Storage Type
- 8.1.1. Cylinder
- 8.1.2. Packaged Gas
- 8.2. Market Analysis, Insights and Forecast - by Function
- 8.2.1. Coolant
- 8.2.2. Refrigerant
- 8.3. Market Analysis, Insights and Forecast - by End-user Industry
- 8.3.1. Chemical and Pharmaceutical
- 8.3.2. Healthcare
- 8.3.3. Transportation
- 8.3.4. Other End-user Industries
- 8.1. Market Analysis, Insights and Forecast - by Storage Type
- 9. Europe Industrial Nitrogen Market Analysis, Insights and Forecast, 2020-2032
- 9.1. Market Analysis, Insights and Forecast - by Storage Type
- 9.1.1. Cylinder
- 9.1.2. Packaged Gas
- 9.2. Market Analysis, Insights and Forecast - by Function
- 9.2.1. Coolant
- 9.2.2. Refrigerant
- 9.3. Market Analysis, Insights and Forecast - by End-user Industry
- 9.3.1. Chemical and Pharmaceutical
- 9.3.2. Healthcare
- 9.3.3. Transportation
- 9.3.4. Other End-user Industries
- 9.1. Market Analysis, Insights and Forecast - by Storage Type
- 10. South America Industrial Nitrogen Market Analysis, Insights and Forecast, 2020-2032
- 10.1. Market Analysis, Insights and Forecast - by Storage Type
- 10.1.1. Cylinder
- 10.1.2. Packaged Gas
- 10.2. Market Analysis, Insights and Forecast - by Function
- 10.2.1. Coolant
- 10.2.2. Refrigerant
- 10.3. Market Analysis, Insights and Forecast - by End-user Industry
- 10.3.1. Chemical and Pharmaceutical
- 10.3.2. Healthcare
- 10.3.3. Transportation
- 10.3.4. Other End-user Industries
- 10.1. Market Analysis, Insights and Forecast - by Storage Type
- 11. Middle East and Africa Industrial Nitrogen Market Analysis, Insights and Forecast, 2020-2032
- 11.1. Market Analysis, Insights and Forecast - by Storage Type
- 11.1.1. Cylinder
- 11.1.2. Packaged Gas
- 11.2. Market Analysis, Insights and Forecast - by Function
- 11.2.1. Coolant
- 11.2.2. Refrigerant
- 11.3. Market Analysis, Insights and Forecast - by End-user Industry
- 11.3.1. Chemical and Pharmaceutical
- 11.3.2. Healthcare
- 11.3.3. Transportation
- 11.3.4. Other End-user Industries
- 11.1. Market Analysis, Insights and Forecast - by Storage Type
- 12. Competitive Analysis
- 12.1. Company Profiles
- 12.1.1 Air Products and Chemicals Inc
- 12.1.1.1. Company Overview
- 12.1.1.2. Products
- 12.1.1.3. Company Financials
- 12.1.1.4. SWOT Analysis
- 12.1.2 Gulf Cryo
- 12.1.2.1. Company Overview
- 12.1.2.2. Products
- 12.1.2.3. Company Financials
- 12.1.2.4. SWOT Analysis
- 12.1.3 Southern Industrial Gas Sdn Bhd
- 12.1.3.1. Company Overview
- 12.1.3.2. Products
- 12.1.3.3. Company Financials
- 12.1.3.4. SWOT Analysis
- 12.1.4 Cryomech Inc
- 12.1.4.1. Company Overview
- 12.1.4.2. Products
- 12.1.4.3. Company Financials
- 12.1.4.4. SWOT Analysis
- 12.1.5 Praxair Technology Inc
- 12.1.5.1. Company Overview
- 12.1.5.2. Products
- 12.1.5.3. Company Financials
- 12.1.5.4. SWOT Analysis
- 12.1.6 Linde plc
- 12.1.6.1. Company Overview
- 12.1.6.2. Products
- 12.1.6.3. Company Financials
- 12.1.6.4. SWOT Analysis
- 12.1.7 TAIYO NIPPON SANSO CORPORATION*List Not Exhaustive
- 12.1.7.1. Company Overview
- 12.1.7.2. Products
- 12.1.7.3. Company Financials
- 12.1.7.4. SWOT Analysis
- 12.1.8 MVS Engineering Pvt Ltd
- 12.1.8.1. Company Overview
- 12.1.8.2. Products
- 12.1.8.3. Company Financials
- 12.1.8.4. SWOT Analysis
- 12.1.9 Messer Group
- 12.1.9.1. Company Overview
- 12.1.9.2. Products
- 12.1.9.3. Company Financials
- 12.1.9.4. SWOT Analysis
- 12.1.10 Air Liquide
- 12.1.10.1. Company Overview
- 12.1.10.2. Products
- 12.1.10.3. Company Financials
- 12.1.10.4. SWOT Analysis
- 12.1.1 Air Products and Chemicals Inc
- 12.2. Market Entropy
- 12.2.1 Company's Key Areas Served
- 12.2.2 Recent Developments
- 12.3. Company Market Share Analysis 2025
- 12.3.1 Top 5 Companies Market Share Analysis
- 12.3.2 Top 3 Companies Market Share Analysis
- 12.4. List of Potential Customers
- 13. Research Methodology
List of Figures
- Figure 1: Global Industrial Nitrogen Market Revenue Breakdown (billion, %) by Region 2025 & 2033
- Figure 2: Global Industrial Nitrogen Market Volume Breakdown (K Tons, %) by Region 2025 & 2033
- Figure 3: Asia Pacific Industrial Nitrogen Market Revenue (billion), by Storage Type 2025 & 2033
- Figure 4: Asia Pacific Industrial Nitrogen Market Volume (K Tons), by Storage Type 2025 & 2033
- Figure 5: Asia Pacific Industrial Nitrogen Market Revenue Share (%), by Storage Type 2025 & 2033
- Figure 6: Asia Pacific Industrial Nitrogen Market Volume Share (%), by Storage Type 2025 & 2033
- Figure 7: Asia Pacific Industrial Nitrogen Market Revenue (billion), by Function 2025 & 2033
- Figure 8: Asia Pacific Industrial Nitrogen Market Volume (K Tons), by Function 2025 & 2033
- Figure 9: Asia Pacific Industrial Nitrogen Market Revenue Share (%), by Function 2025 & 2033
- Figure 10: Asia Pacific Industrial Nitrogen Market Volume Share (%), by Function 2025 & 2033
- Figure 11: Asia Pacific Industrial Nitrogen Market Revenue (billion), by End-user Industry 2025 & 2033
- Figure 12: Asia Pacific Industrial Nitrogen Market Volume (K Tons), by End-user Industry 2025 & 2033
- Figure 13: Asia Pacific Industrial Nitrogen Market Revenue Share (%), by End-user Industry 2025 & 2033
- Figure 14: Asia Pacific Industrial Nitrogen Market Volume Share (%), by End-user Industry 2025 & 2033
- Figure 15: Asia Pacific Industrial Nitrogen Market Revenue (billion), by Country 2025 & 2033
- Figure 16: Asia Pacific Industrial Nitrogen Market Volume (K Tons), by Country 2025 & 2033
- Figure 17: Asia Pacific Industrial Nitrogen Market Revenue Share (%), by Country 2025 & 2033
- Figure 18: Asia Pacific Industrial Nitrogen Market Volume Share (%), by Country 2025 & 2033
- Figure 19: North America Industrial Nitrogen Market Revenue (billion), by Storage Type 2025 & 2033
- Figure 20: North America Industrial Nitrogen Market Volume (K Tons), by Storage Type 2025 & 2033
- Figure 21: North America Industrial Nitrogen Market Revenue Share (%), by Storage Type 2025 & 2033
- Figure 22: North America Industrial Nitrogen Market Volume Share (%), by Storage Type 2025 & 2033
- Figure 23: North America Industrial Nitrogen Market Revenue (billion), by Function 2025 & 2033
- Figure 24: North America Industrial Nitrogen Market Volume (K Tons), by Function 2025 & 2033
- Figure 25: North America Industrial Nitrogen Market Revenue Share (%), by Function 2025 & 2033
- Figure 26: North America Industrial Nitrogen Market Volume Share (%), by Function 2025 & 2033
- Figure 27: North America Industrial Nitrogen Market Revenue (billion), by End-user Industry 2025 & 2033
- Figure 28: North America Industrial Nitrogen Market Volume (K Tons), by End-user Industry 2025 & 2033
- Figure 29: North America Industrial Nitrogen Market Revenue Share (%), by End-user Industry 2025 & 2033
- Figure 30: North America Industrial Nitrogen Market Volume Share (%), by End-user Industry 2025 & 2033
- Figure 31: North America Industrial Nitrogen Market Revenue (billion), by Country 2025 & 2033
- Figure 32: North America Industrial Nitrogen Market Volume (K Tons), by Country 2025 & 2033
- Figure 33: North America Industrial Nitrogen Market Revenue Share (%), by Country 2025 & 2033
- Figure 34: North America Industrial Nitrogen Market Volume Share (%), by Country 2025 & 2033
- Figure 35: Europe Industrial Nitrogen Market Revenue (billion), by Storage Type 2025 & 2033
- Figure 36: Europe Industrial Nitrogen Market Volume (K Tons), by Storage Type 2025 & 2033
- Figure 37: Europe Industrial Nitrogen Market Revenue Share (%), by Storage Type 2025 & 2033
- Figure 38: Europe Industrial Nitrogen Market Volume Share (%), by Storage Type 2025 & 2033
- Figure 39: Europe Industrial Nitrogen Market Revenue (billion), by Function 2025 & 2033
- Figure 40: Europe Industrial Nitrogen Market Volume (K Tons), by Function 2025 & 2033
- Figure 41: Europe Industrial Nitrogen Market Revenue Share (%), by Function 2025 & 2033
- Figure 42: Europe Industrial Nitrogen Market Volume Share (%), by Function 2025 & 2033
- Figure 43: Europe Industrial Nitrogen Market Revenue (billion), by End-user Industry 2025 & 2033
- Figure 44: Europe Industrial Nitrogen Market Volume (K Tons), by End-user Industry 2025 & 2033
- Figure 45: Europe Industrial Nitrogen Market Revenue Share (%), by End-user Industry 2025 & 2033
- Figure 46: Europe Industrial Nitrogen Market Volume Share (%), by End-user Industry 2025 & 2033
- Figure 47: Europe Industrial Nitrogen Market Revenue (billion), by Country 2025 & 2033
- Figure 48: Europe Industrial Nitrogen Market Volume (K Tons), by Country 2025 & 2033
- Figure 49: Europe Industrial Nitrogen Market Revenue Share (%), by Country 2025 & 2033
- Figure 50: Europe Industrial Nitrogen Market Volume Share (%), by Country 2025 & 2033
- Figure 51: South America Industrial Nitrogen Market Revenue (billion), by Storage Type 2025 & 2033
- Figure 52: South America Industrial Nitrogen Market Volume (K Tons), by Storage Type 2025 & 2033
- Figure 53: South America Industrial Nitrogen Market Revenue Share (%), by Storage Type 2025 & 2033
- Figure 54: South America Industrial Nitrogen Market Volume Share (%), by Storage Type 2025 & 2033
- Figure 55: South America Industrial Nitrogen Market Revenue (billion), by Function 2025 & 2033
- Figure 56: South America Industrial Nitrogen Market Volume (K Tons), by Function 2025 & 2033
- Figure 57: South America Industrial Nitrogen Market Revenue Share (%), by Function 2025 & 2033
- Figure 58: South America Industrial Nitrogen Market Volume Share (%), by Function 2025 & 2033
- Figure 59: South America Industrial Nitrogen Market Revenue (billion), by End-user Industry 2025 & 2033
- Figure 60: South America Industrial Nitrogen Market Volume (K Tons), by End-user Industry 2025 & 2033
- Figure 61: South America Industrial Nitrogen Market Revenue Share (%), by End-user Industry 2025 & 2033
- Figure 62: South America Industrial Nitrogen Market Volume Share (%), by End-user Industry 2025 & 2033
- Figure 63: South America Industrial Nitrogen Market Revenue (billion), by Country 2025 & 2033
- Figure 64: South America Industrial Nitrogen Market Volume (K Tons), by Country 2025 & 2033
- Figure 65: South America Industrial Nitrogen Market Revenue Share (%), by Country 2025 & 2033
- Figure 66: South America Industrial Nitrogen Market Volume Share (%), by Country 2025 & 2033
- Figure 67: Middle East and Africa Industrial Nitrogen Market Revenue (billion), by Storage Type 2025 & 2033
- Figure 68: Middle East and Africa Industrial Nitrogen Market Volume (K Tons), by Storage Type 2025 & 2033
- Figure 69: Middle East and Africa Industrial Nitrogen Market Revenue Share (%), by Storage Type 2025 & 2033
- Figure 70: Middle East and Africa Industrial Nitrogen Market Volume Share (%), by Storage Type 2025 & 2033
- Figure 71: Middle East and Africa Industrial Nitrogen Market Revenue (billion), by Function 2025 & 2033
- Figure 72: Middle East and Africa Industrial Nitrogen Market Volume (K Tons), by Function 2025 & 2033
- Figure 73: Middle East and Africa Industrial Nitrogen Market Revenue Share (%), by Function 2025 & 2033
- Figure 74: Middle East and Africa Industrial Nitrogen Market Volume Share (%), by Function 2025 & 2033
- Figure 75: Middle East and Africa Industrial Nitrogen Market Revenue (billion), by End-user Industry 2025 & 2033
- Figure 76: Middle East and Africa Industrial Nitrogen Market Volume (K Tons), by End-user Industry 2025 & 2033
- Figure 77: Middle East and Africa Industrial Nitrogen Market Revenue Share (%), by End-user Industry 2025 & 2033
- Figure 78: Middle East and Africa Industrial Nitrogen Market Volume Share (%), by End-user Industry 2025 & 2033
- Figure 79: Middle East and Africa Industrial Nitrogen Market Revenue (billion), by Country 2025 & 2033
- Figure 80: Middle East and Africa Industrial Nitrogen Market Volume (K Tons), by Country 2025 & 2033
- Figure 81: Middle East and Africa Industrial Nitrogen Market Revenue Share (%), by Country 2025 & 2033
- Figure 82: Middle East and Africa Industrial Nitrogen Market Volume Share (%), by Country 2025 & 2033
List of Tables
- Table 1: Global Industrial Nitrogen Market Revenue billion Forecast, by Storage Type 2020 & 2033
- Table 2: Global Industrial Nitrogen Market Volume K Tons Forecast, by Storage Type 2020 & 2033
- Table 3: Global Industrial Nitrogen Market Revenue billion Forecast, by Function 2020 & 2033
- Table 4: Global Industrial Nitrogen Market Volume K Tons Forecast, by Function 2020 & 2033
- Table 5: Global Industrial Nitrogen Market Revenue billion Forecast, by End-user Industry 2020 & 2033
- Table 6: Global Industrial Nitrogen Market Volume K Tons Forecast, by End-user Industry 2020 & 2033
- Table 7: Global Industrial Nitrogen Market Revenue billion Forecast, by Region 2020 & 2033
- Table 8: Global Industrial Nitrogen Market Volume K Tons Forecast, by Region 2020 & 2033
- Table 9: Global Industrial Nitrogen Market Revenue billion Forecast, by Storage Type 2020 & 2033
- Table 10: Global Industrial Nitrogen Market Volume K Tons Forecast, by Storage Type 2020 & 2033
- Table 11: Global Industrial Nitrogen Market Revenue billion Forecast, by Function 2020 & 2033
- Table 12: Global Industrial Nitrogen Market Volume K Tons Forecast, by Function 2020 & 2033
- Table 13: Global Industrial Nitrogen Market Revenue billion Forecast, by End-user Industry 2020 & 2033
- Table 14: Global Industrial Nitrogen Market Volume K Tons Forecast, by End-user Industry 2020 & 2033
- Table 15: Global Industrial Nitrogen Market Revenue billion Forecast, by Country 2020 & 2033
- Table 16: Global Industrial Nitrogen Market Volume K Tons Forecast, by Country 2020 & 2033
- Table 17: China Industrial Nitrogen Market Revenue (billion) Forecast, by Application 2020 & 2033
- Table 18: China Industrial Nitrogen Market Volume (K Tons) Forecast, by Application 2020 & 2033
- Table 19: India Industrial Nitrogen Market Revenue (billion) Forecast, by Application 2020 & 2033
- Table 20: India Industrial Nitrogen Market Volume (K Tons) Forecast, by Application 2020 & 2033
- Table 21: Japan Industrial Nitrogen Market Revenue (billion) Forecast, by Application 2020 & 2033
- Table 22: Japan Industrial Nitrogen Market Volume (K Tons) Forecast, by Application 2020 & 2033
- Table 23: South Korea Industrial Nitrogen Market Revenue (billion) Forecast, by Application 2020 & 2033
- Table 24: South Korea Industrial Nitrogen Market Volume (K Tons) Forecast, by Application 2020 & 2033
- Table 25: Rest of Asia Pacific Industrial Nitrogen Market Revenue (billion) Forecast, by Application 2020 & 2033
- Table 26: Rest of Asia Pacific Industrial Nitrogen Market Volume (K Tons) Forecast, by Application 2020 & 2033
- Table 27: Global Industrial Nitrogen Market Revenue billion Forecast, by Storage Type 2020 & 2033
- Table 28: Global Industrial Nitrogen Market Volume K Tons Forecast, by Storage Type 2020 & 2033
- Table 29: Global Industrial Nitrogen Market Revenue billion Forecast, by Function 2020 & 2033
- Table 30: Global Industrial Nitrogen Market Volume K Tons Forecast, by Function 2020 & 2033
- Table 31: Global Industrial Nitrogen Market Revenue billion Forecast, by End-user Industry 2020 & 2033
- Table 32: Global Industrial Nitrogen Market Volume K Tons Forecast, by End-user Industry 2020 & 2033
- Table 33: Global Industrial Nitrogen Market Revenue billion Forecast, by Country 2020 & 2033
- Table 34: Global Industrial Nitrogen Market Volume K Tons Forecast, by Country 2020 & 2033
- Table 35: United States Industrial Nitrogen Market Revenue (billion) Forecast, by Application 2020 & 2033
- Table 36: United States Industrial Nitrogen Market Volume (K Tons) Forecast, by Application 2020 & 2033
- Table 37: Canada Industrial Nitrogen Market Revenue (billion) Forecast, by Application 2020 & 2033
- Table 38: Canada Industrial Nitrogen Market Volume (K Tons) Forecast, by Application 2020 & 2033
- Table 39: Mexico Industrial Nitrogen Market Revenue (billion) Forecast, by Application 2020 & 2033
- Table 40: Mexico Industrial Nitrogen Market Volume (K Tons) Forecast, by Application 2020 & 2033
- Table 41: Global Industrial Nitrogen Market Revenue billion Forecast, by Storage Type 2020 & 2033
- Table 42: Global Industrial Nitrogen Market Volume K Tons Forecast, by Storage Type 2020 & 2033
- Table 43: Global Industrial Nitrogen Market Revenue billion Forecast, by Function 2020 & 2033
- Table 44: Global Industrial Nitrogen Market Volume K Tons Forecast, by Function 2020 & 2033
- Table 45: Global Industrial Nitrogen Market Revenue billion Forecast, by End-user Industry 2020 & 2033
- Table 46: Global Industrial Nitrogen Market Volume K Tons Forecast, by End-user Industry 2020 & 2033
- Table 47: Global Industrial Nitrogen Market Revenue billion Forecast, by Country 2020 & 2033
- Table 48: Global Industrial Nitrogen Market Volume K Tons Forecast, by Country 2020 & 2033
- Table 49: Germany Industrial Nitrogen Market Revenue (billion) Forecast, by Application 2020 & 2033
- Table 50: Germany Industrial Nitrogen Market Volume (K Tons) Forecast, by Application 2020 & 2033
- Table 51: United Kingdom Industrial Nitrogen Market Revenue (billion) Forecast, by Application 2020 & 2033
- Table 52: United Kingdom Industrial Nitrogen Market Volume (K Tons) Forecast, by Application 2020 & 2033
- Table 53: Italy Industrial Nitrogen Market Revenue (billion) Forecast, by Application 2020 & 2033
- Table 54: Italy Industrial Nitrogen Market Volume (K Tons) Forecast, by Application 2020 & 2033
- Table 55: France Industrial Nitrogen Market Revenue (billion) Forecast, by Application 2020 & 2033
- Table 56: France Industrial Nitrogen Market Volume (K Tons) Forecast, by Application 2020 & 2033
- Table 57: Rest of Europe Industrial Nitrogen Market Revenue (billion) Forecast, by Application 2020 & 2033
- Table 58: Rest of Europe Industrial Nitrogen Market Volume (K Tons) Forecast, by Application 2020 & 2033
- Table 59: Global Industrial Nitrogen Market Revenue billion Forecast, by Storage Type 2020 & 2033
- Table 60: Global Industrial Nitrogen Market Volume K Tons Forecast, by Storage Type 2020 & 2033
- Table 61: Global Industrial Nitrogen Market Revenue billion Forecast, by Function 2020 & 2033
- Table 62: Global Industrial Nitrogen Market Volume K Tons Forecast, by Function 2020 & 2033
- Table 63: Global Industrial Nitrogen Market Revenue billion Forecast, by End-user Industry 2020 & 2033
- Table 64: Global Industrial Nitrogen Market Volume K Tons Forecast, by End-user Industry 2020 & 2033
- Table 65: Global Industrial Nitrogen Market Revenue billion Forecast, by Country 2020 & 2033
- Table 66: Global Industrial Nitrogen Market Volume K Tons Forecast, by Country 2020 & 2033
- Table 67: Brazil Industrial Nitrogen Market Revenue (billion) Forecast, by Application 2020 & 2033
- Table 68: Brazil Industrial Nitrogen Market Volume (K Tons) Forecast, by Application 2020 & 2033
- Table 69: Argentina Industrial Nitrogen Market Revenue (billion) Forecast, by Application 2020 & 2033
- Table 70: Argentina Industrial Nitrogen Market Volume (K Tons) Forecast, by Application 2020 & 2033
- Table 71: Rest of South America Industrial Nitrogen Market Revenue (billion) Forecast, by Application 2020 & 2033
- Table 72: Rest of South America Industrial Nitrogen Market Volume (K Tons) Forecast, by Application 2020 & 2033
- Table 73: Global Industrial Nitrogen Market Revenue billion Forecast, by Storage Type 2020 & 2033
- Table 74: Global Industrial Nitrogen Market Volume K Tons Forecast, by Storage Type 2020 & 2033
- Table 75: Global Industrial Nitrogen Market Revenue billion Forecast, by Function 2020 & 2033
- Table 76: Global Industrial Nitrogen Market Volume K Tons Forecast, by Function 2020 & 2033
- Table 77: Global Industrial Nitrogen Market Revenue billion Forecast, by End-user Industry 2020 & 2033
- Table 78: Global Industrial Nitrogen Market Volume K Tons Forecast, by End-user Industry 2020 & 2033
- Table 79: Global Industrial Nitrogen Market Revenue billion Forecast, by Country 2020 & 2033
- Table 80: Global Industrial Nitrogen Market Volume K Tons Forecast, by Country 2020 & 2033
- Table 81: Saudi Arabia Industrial Nitrogen Market Revenue (billion) Forecast, by Application 2020 & 2033
- Table 82: Saudi Arabia Industrial Nitrogen Market Volume (K Tons) Forecast, by Application 2020 & 2033
- Table 83: South Africa Industrial Nitrogen Market Revenue (billion) Forecast, by Application 2020 & 2033
- Table 84: South Africa Industrial Nitrogen Market Volume (K Tons) Forecast, by Application 2020 & 2033
- Table 85: Rest of Middle East and Africa Industrial Nitrogen Market Revenue (billion) Forecast, by Application 2020 & 2033
- Table 86: Rest of Middle East and Africa Industrial Nitrogen Market Volume (K Tons) Forecast, by Application 2020 & 2033
Frequently Asked Questions
1. What is the projected Compound Annual Growth Rate (CAGR) of the Industrial Nitrogen Market?
The projected CAGR is approximately 6.6%.
2. Which companies are prominent players in the Industrial Nitrogen Market?
Key companies in the market include Air Products and Chemicals Inc, Gulf Cryo, Southern Industrial Gas Sdn Bhd, Cryomech Inc, Praxair Technology Inc, Linde plc, TAIYO NIPPON SANSO CORPORATION*List Not Exhaustive, MVS Engineering Pvt Ltd, Messer Group, Air Liquide.
3. What are the main segments of the Industrial Nitrogen Market?
The market segments include Storage Type, Function, End-user Industry.
4. Can you provide details about the market size?
The market size is estimated to be USD 21.18 billion as of 2022.
5. What are some drivers contributing to market growth?
Increasing Demand from the Chemical and Pharmaceutical Industry; Growing Application in the Healthcare Industry; Other Drivers.
6. What are the notable trends driving market growth?
Growing Demand from the Chemical and Pharmaceutical Industry.
7. Are there any restraints impacting market growth?
Regulatory Restrictions in Maintaining Liquid Nitrogen Plant; Other Restraints.
8. Can you provide examples of recent developments in the market?
April 2022: Linde plc signed another long-term arrangement to supply bulk industrial gases with a major space launch firm in Florida. Linde will deliver liquid nitrogen to the client from its air separation facility in Mims, Florida, expanding to increase production capacity by up to 50%. The extra capacity, expected to begin operations in 2023, will fulfill the new agreement's demands and increase demand from clients in the aerospace, healthcare, manufacturing, food processing, and water treatment end sectors.
9. What pricing options are available for accessing the report?
Pricing options include single-user, multi-user, and enterprise licenses priced at USD 4750, USD 5250, and USD 8750 respectively.
10. Is the market size provided in terms of value or volume?
The market size is provided in terms of value, measured in billion and volume, measured in K Tons.
11. Are there any specific market keywords associated with the report?
Yes, the market keyword associated with the report is "Industrial Nitrogen Market," which aids in identifying and referencing the specific market segment covered.
12. How do I determine which pricing option suits my needs best?
The pricing options vary based on user requirements and access needs. Individual users may opt for single-user licenses, while businesses requiring broader access may choose multi-user or enterprise licenses for cost-effective access to the report.
13. Are there any additional resources or data provided in the Industrial Nitrogen Market report?
While the report offers comprehensive insights, it's advisable to review the specific contents or supplementary materials provided to ascertain if additional resources or data are available.
14. How can I stay updated on further developments or reports in the Industrial Nitrogen Market?
To stay informed about further developments, trends, and reports in the Industrial Nitrogen Market, consider subscribing to industry newsletters, following relevant companies and organizations, or regularly checking reputable industry news sources and publications.
Methodology
Step 1 - Identification of Relevant Samples Size from Population Database


Step 2 - Approaches for Defining Global Market Size (Value, Volume* & Price*)

Note*: In applicable scenarios
Step 3 - Data Sources
Primary Research
- Web Analytics
- Survey Reports
- Research Institute
- Latest Research Reports
- Opinion Leaders
Secondary Research
- Annual Reports
- White Paper
- Latest Press Release
- Industry Association
- Paid Database
- Investor Presentations

Step 4 - Data Triangulation
Involves using different sources of information in order to increase the validity of a study
These sources are likely to be stakeholders in a program - participants, other researchers, program staff, other community members, and so on.
Then we put all data in single framework & apply various statistical tools to find out the dynamic on the market.
During the analysis stage, feedback from the stakeholder groups would be compared to determine areas of agreement as well as areas of divergence