

Key Insights
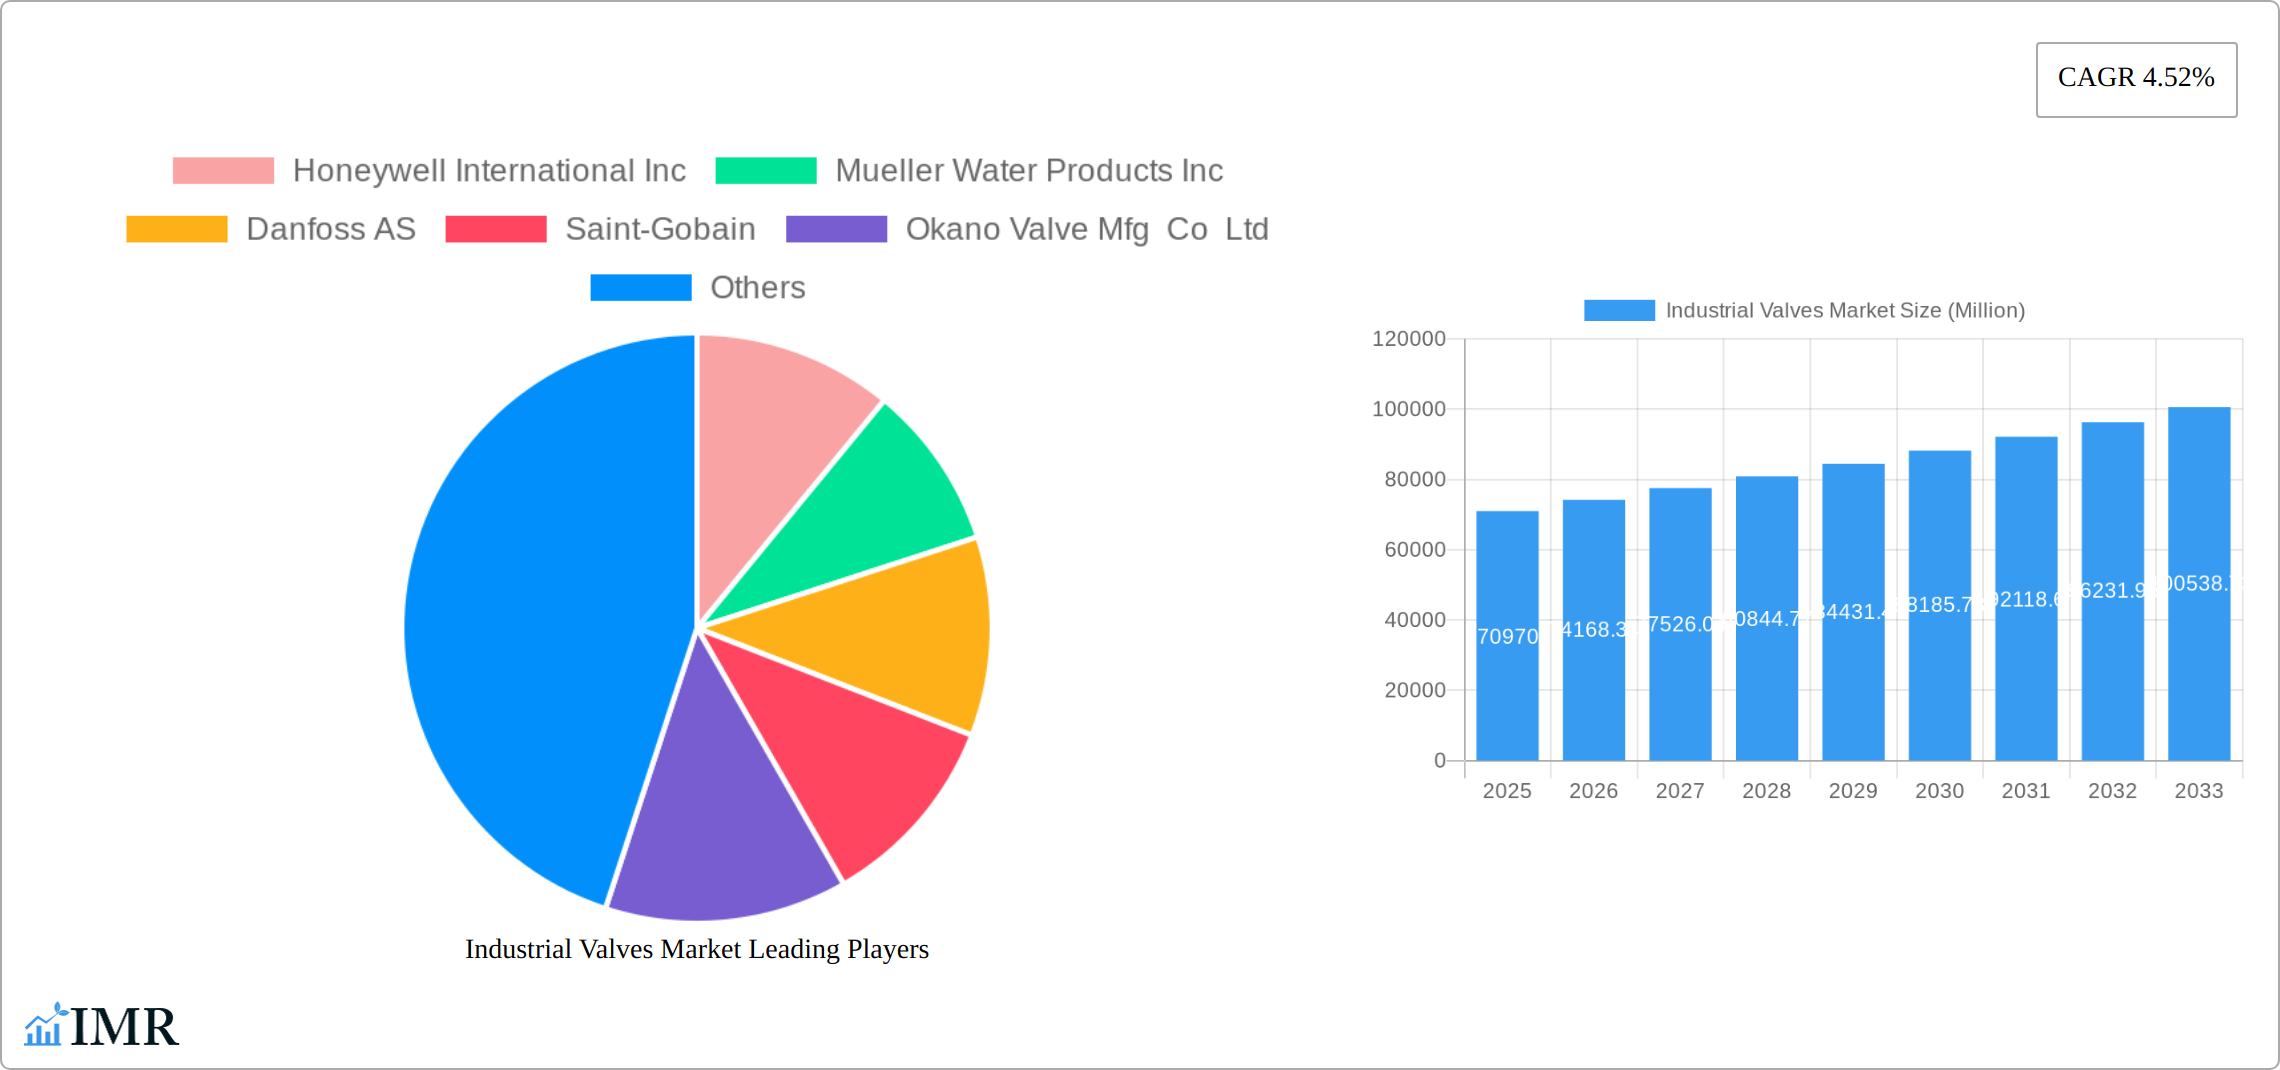
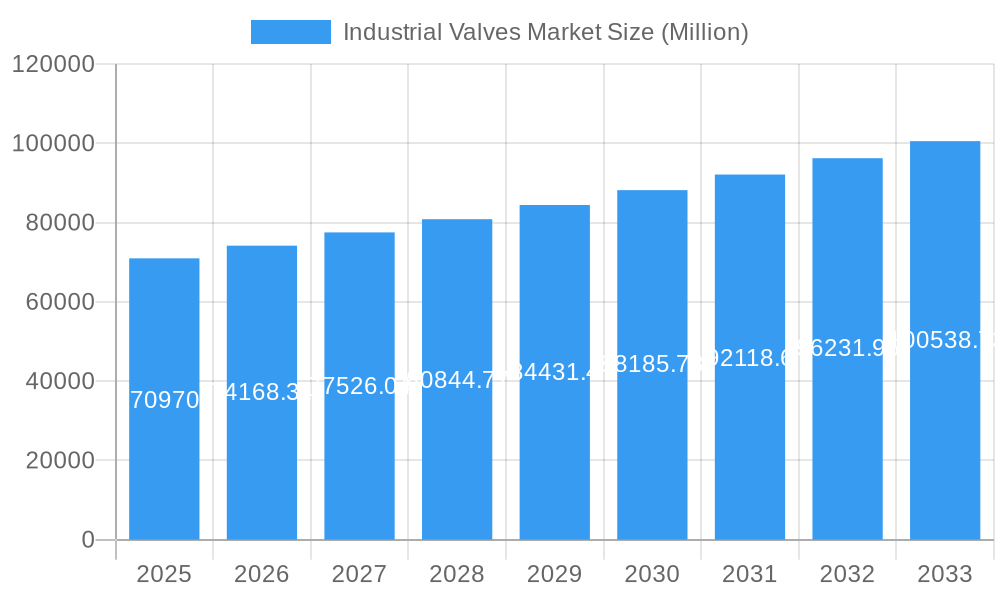
The global industrial valves market, valued at $70.97 billion in 2025, is projected to experience robust growth, driven by a compound annual growth rate (CAGR) of 4.52% from 2025 to 2033. This expansion is fueled by several key factors. Firstly, the increasing demand for automation and process control across various industries, including oil and gas, chemicals, and water management, is a significant driver. The ongoing modernization of existing infrastructure and the development of new industrial facilities necessitate advanced valve technologies for efficient and safe operation. Secondly, stringent environmental regulations are pushing for improved process efficiency and reduced emissions, leading to increased adoption of high-performance valves with features like leak prevention and optimized flow control. Finally, the growth in emerging economies, particularly in Asia-Pacific, presents significant untapped potential for industrial valve manufacturers, further boosting market expansion. The market segmentation reveals a strong preference for butterfly, ball, and globe valves across diverse applications, with quarter-turn valves dominating the product segment due to their ease of operation and speed.
Industrial Valves Market Market Size (In Billion)
The market landscape is characterized by a mix of established multinational corporations and regional players. Companies like Honeywell, Emerson Electric, and Flowserve are leading the innovation drive, focusing on advanced materials, smart valve technologies, and digital solutions for enhanced operational efficiency and predictive maintenance. However, intense competition and price pressures from regional manufacturers, particularly in Asia, present challenges. Geographical analysis shows North America and Europe currently hold significant market share, owing to their established industrial infrastructure and technological advancements. However, the rapid industrialization in Asia-Pacific is expected to significantly increase its market share over the forecast period, driving further market growth and reshaping the competitive dynamics. The market also faces certain restraints such as the volatility of raw material prices, and the need for skilled labor for installation and maintenance. Despite these challenges, the long-term outlook for the industrial valves market remains positive, driven by consistent demand from various end-use sectors.
Industrial Valves Market Company Market Share
Industrial Valves Market: A Comprehensive Report (2019-2033)
This in-depth report provides a comprehensive analysis of the Industrial Valves Market, encompassing market dynamics, growth trends, regional dominance, product landscape, key players, and future outlook. The report covers the period from 2019 to 2033, with 2025 as the base year and a forecast period from 2025 to 2033. The analysis is segmented by type (Butterfly Valve, Ball Valve, Globe Valve, Gate Valve, Plug Valve, Other Types), product (Quarter-turn Valve, Multi-turn Valve, Other Products), and application (Power, Water and Wastewater Management, Chemicals, Oil and Gas, Other Applications). The report utilizes both qualitative and quantitative data to provide a complete picture of this vital industrial sector. The total market size is projected to reach xx Million units by 2033.
Industrial Valves Market Dynamics & Structure
The Industrial Valves Market is characterized by a moderately concentrated landscape, with several major players holding significant market share. Technological innovation, driven by the need for enhanced efficiency, safety, and sustainability, is a key driver. Stringent regulatory frameworks regarding emissions and safety standards also shape market dynamics. The market faces competition from alternative technologies, but the demand for reliable and durable valves remains strong across diverse industries. Mergers and acquisitions (M&A) activity reflects industry consolidation and expansion efforts.
- Market Concentration: The top 10 players hold approximately 60% of the global market share in 2025.
- Technological Innovation: Focus on smart valves, automation, and improved material science for higher pressure and temperature applications.
- Regulatory Landscape: Compliance with environmental regulations and safety standards drives demand for specific valve types.
- Competitive Substitutes: Limited direct substitutes, but alternative flow control methods can influence market adoption.
- End-User Demographics: Strong demand from Oil & Gas, Water & Wastewater, and Chemical processing sectors.
- M&A Trends: Significant M&A activity in recent years, indicating industry consolidation and strategic expansion. The Flowserve Corporation acquisition of Velan Inc. in February 2023 is a notable example.
Industrial Valves Market Growth Trends & Insights
The Industrial Valves Market exhibits robust growth, driven by increasing industrialization, infrastructure development, and rising demand from key end-use sectors. The market experienced a CAGR of xx% during the historical period (2019-2024) and is projected to grow at a CAGR of xx% during the forecast period (2025-2033). Technological advancements, such as the adoption of smart valves and remote monitoring systems, are accelerating market adoption. Changes in consumer behavior towards environmentally friendly solutions are also influencing the market.
Dominant Regions, Countries, or Segments in Industrial Valves Market
The industrial valves market is a dynamic landscape shaped by regional growth patterns and evolving technological demands. While North America and Europe retain significant market share, driven by established industrial infrastructure and robust demand across sectors like oil & gas, chemical processing, and water management, the Asia-Pacific region is poised for explosive growth. This surge is fueled by rapid industrialization, substantial infrastructure investments (including extensive pipeline networks and water treatment facilities), and the burgeoning energy sector. Within this diverse market, ball valves and butterfly valves consistently demonstrate high demand due to their versatility and broad applicability. The Oil and Gas sector remains a dominant application segment, reflecting the ongoing global need for energy resources and the critical role valves play in its extraction, processing, and distribution.
Specific regional performance is further nuanced by factors such as government regulations promoting sustainable industrial practices and increasing adoption of advanced valve technologies. For example, initiatives focusing on reducing emissions and improving resource efficiency are driving demand for energy-efficient and environmentally friendly valve solutions. Similarly, the increasing complexity of industrial processes necessitates valves with enhanced precision, control, and safety features.
- Key Drivers:
- Robust industrial expansion in developing economies, particularly in Asia-Pacific and certain regions of Africa.
- Significant investments in large-scale infrastructure projects, including pipelines, power plants, and water treatment plants.
- Stringent government regulations emphasizing environmental sustainability and operational safety in industrial processes.
- Growing adoption of advanced valve technologies such as smart valves, incorporating features like remote monitoring, predictive maintenance, and enhanced automation.
- Increased demand for customized valve solutions tailored to specific needs within niche applications (e.g., food and beverage, pharmaceuticals).
- Market Segmentation Highlights (Illustrative): While precise figures require proprietary market data, the following provides a general illustration of market segmentation: North America (substantial market share), Europe (substantial market share), Asia-Pacific (rapidly expanding market share), Ball Valves (largest segment by unit volume), Butterfly Valves (second largest segment by unit volume), Oil & Gas Application (largest application segment by value).
Industrial Valves Market Product Landscape
Innovation is a cornerstone of the industrial valves market. Manufacturers are continuously developing advanced materials, refining designs, and incorporating enhanced functionalities to meet the evolving needs of diverse industries. The focus is on improving energy efficiency, extending operational lifespan, enhancing precision control, and bolstering safety features. Smart valves, integrated with remote monitoring and diagnostic capabilities, are gaining significant traction, offering remote diagnostics and predictive maintenance capabilities. These technologies reduce downtime, optimize maintenance schedules, and improve operational efficiency. Unique selling propositions increasingly emphasize enhanced longevity, reduced maintenance requirements, improved safety, and minimized environmental impact.
Key Drivers, Barriers & Challenges in Industrial Valves Market
Key Drivers: Increased industrial activity across various sectors, growing demand for efficient and reliable flow control solutions, and technological advancements in valve design and materials. Government initiatives promoting infrastructure development and sustainable industrial practices further accelerate market growth.
Key Challenges: Supply chain disruptions can impact production and delivery timelines. Stringent regulatory compliance requirements increase manufacturing costs. Intense competition among established players and the emergence of new entrants can pressure profit margins.
Emerging Opportunities in Industrial Valves Market
Significant growth potential exists within untapped markets in developing economies, particularly in regions of Asia Pacific and Africa experiencing rapid industrialization. The demand for sophisticated smart valves with features such as remote monitoring, predictive maintenance, and integrated data analytics is expected to accelerate considerably. The increasing adoption of Industry 4.0 principles is further driving demand for connected and intelligent valves that can seamlessly integrate with other industrial control systems. Furthermore, the demand for customized valve solutions tailored to specific needs within niche sectors like food processing, pharmaceuticals, and semiconductors presents lucrative opportunities for specialized valve manufacturers.
Growth Accelerators in the Industrial Valves Market Industry
Technological breakthroughs in materials science, automation, and sensor integration are driving long-term growth. Strategic partnerships between valve manufacturers and industrial automation companies are expanding market reach and capabilities. Expansion into new geographical markets and diversification into niche applications also accelerate market growth.
Key Players Shaping the Industrial Valves Market Market
- Honeywell International Inc
- Mueller Water Products Inc
- Danfoss AS
- Saint-Gobain
- Okano Valve Mfg Co Ltd
- ALFA LAVAL
- Flowserve Corporation
- The Weir Group PLC
- Georg Fischer Ltd
- NIBCO Inc
- Baker Hughes
- Hitachi Ltd
- Xylem
- Emerson Electric Co
- Zhejiang Dunan Valve Co Ltd
- CIRCOR International Inc
- AVK Holding AS
- ITT Inc
- KLINGER Group
- IMI
- Crane Co
- SLB
- Valvitalia SpA
- Curtiss-Wright Corporation
- TechnipFMC PLC
- KITZ Corporation
Notable Milestones in Industrial Valves Market Sector
- September 2023: Danfoss India expanded its operational capacity with the opening of a new 43,000 sq ft distribution center in Chennai, significantly boosting its growth strategy in the region.
- February 2023: Flowserve Corporation's acquisition of Velan Inc. for USD 245 million expanded its valve portfolio and strengthened its market position, enhancing its product offerings and global reach.
- November 2022: IMI Saudi Industry's launch of a new 5,000 m² facility in Dammam demonstrated a commitment to supporting Saudi Arabia's localization efforts and meeting the growing regional demand for industrial valves.
- November 2022: James Walker's introduction of the Supagraf HT valve stem seal, designed for high-temperature, corrosive media, showcased the ongoing drive for innovation in materials and design to meet demanding industrial applications.
In-Depth Industrial Valves Market Market Outlook
The Industrial Valves Market is poised for sustained growth, driven by ongoing technological advancements, expanding industrial activity, and increasing infrastructure investments globally. Strategic partnerships, market expansions into new geographies, and a focus on innovative, sustainable solutions will shape the market's future trajectory. The market offers lucrative opportunities for players who can leverage technological innovation and adapt to evolving customer needs.
Industrial Valves Market Segmentation
-
1. Type
- 1.1. Butterfly Valve
- 1.2. Ball Valve
- 1.3. Globe Valve
- 1.4. Gate Valve
- 1.5. Plug Valve
- 1.6. Other Types
-
2. Product
- 2.1. Quarter-turn Valve
- 2.2. Multi-turn Valve
- 2.3. Other Products
-
3. Application
- 3.1. Power
- 3.2. Water and Wastewater Management
- 3.3. Chemicals
- 3.4. Oil and Gas
- 3.5. Other Ap
Industrial Valves Market Segmentation By Geography
-
1. Asia Pacific
- 1.1. China
- 1.2. India
- 1.3. Japan
- 1.4. South Korea
- 1.5. Indonesia
- 1.6. Vietnam
- 1.7. Malaysia
- 1.8. Thailand
- 1.9. Rest of Asia Pacific
-
2. North America
- 2.1. United States
- 2.2. Canada
- 2.3. Mexico
-
3. Europe
- 3.1. Germany
- 3.2. United Kingdom
- 3.3. Italy
- 3.4. France
- 3.5. NORDIC
- 3.6. Turkey
- 3.7. Russia
- 3.8. Spain
- 3.9. Rest of Europe
-
4. South America
- 4.1. Brazil
- 4.2. Argentina
- 4.3. Colombia
- 4.4. Rest of South America
-
5. Middle East and Africa
- 5.1. Saudi Arabia
- 5.2. South Africa
- 5.3. United Arab Emirates
- 5.4. Qatar
- 5.5. Nigeria
- 5.6. Egypt
- 5.7. Rest of Middle East and Africa
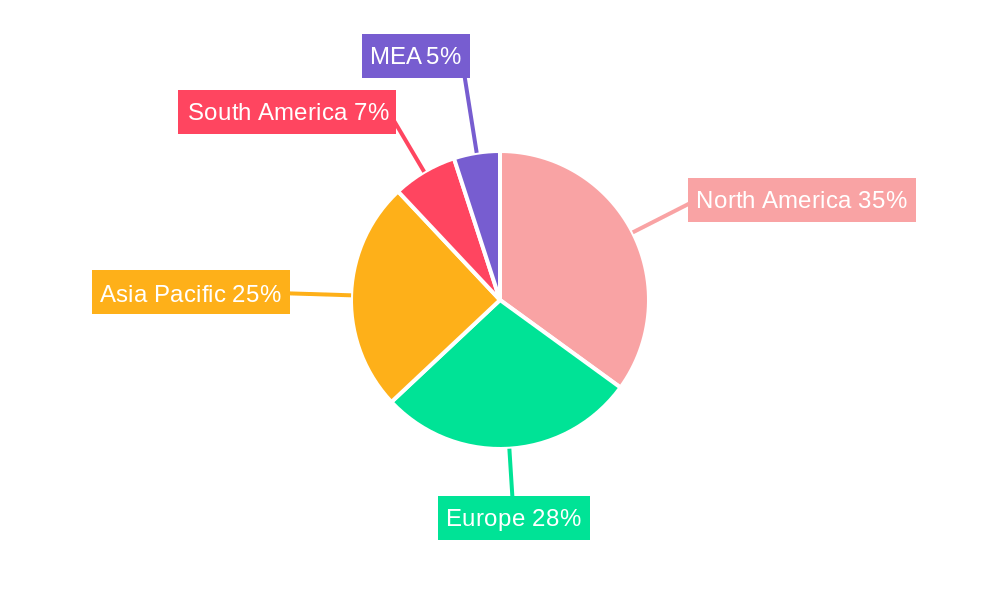
Industrial Valves Market Regional Market Share
Geographic Coverage of Industrial Valves Market
Industrial Valves Market REPORT HIGHLIGHTS
| Aspects | Details |
|---|---|
| Study Period | 2020-2034 |
| Base Year | 2025 |
| Estimated Year | 2026 |
| Forecast Period | 2026-2034 |
| Historical Period | 2020-2025 |
| Growth Rate | CAGR of 4.52% from 2020-2034 |
| Segmentation |
|
Table of Contents
- 1. Introduction
- 1.1. Research Scope
- 1.2. Market Segmentation
- 1.3. Research Objective
- 1.4. Definitions and Assumptions
- 2. Executive Summary
- 2.1. Market Snapshot
- 3. Market Dynamics
- 3.1. Market Drivers
- 3.2. Market Restrains
- 3.3. Market Trends
- 3.4. Market Opportunities
- 4. Market Factor Analysis
- 4.1. Porters Five Forces
- 4.1.1. Bargaining Power of Suppliers
- 4.1.2. Bargaining Power of Buyers
- 4.1.3. Threat of New Entrants
- 4.1.4. Threat of Substitutes
- 4.1.5. Competitive Rivalry
- 4.2. PESTEL analysis
- 4.3. BCG Analysis
- 4.3.1. Stars (High Growth, High Market Share)
- 4.3.2. Cash Cows (Low Growth, High Market Share)
- 4.3.3. Question Mark (High Growth, Low Market Share)
- 4.3.4. Dogs (Low Growth, Low Market Share)
- 4.4. Ansoff Matrix Analysis
- 4.5. Supply Chain Analysis
- 4.6. Regulatory Landscape
- 4.7. Current Market Potential and Opportunity Assessment (TAM–SAM–SOM Framework)
- 4.8. IMR Analyst Note
- 4.1. Porters Five Forces
- 5. Market Analysis, Insights and Forecast 2021-2033
- 5.1. Market Analysis, Insights and Forecast - by Type
- 5.1.1. Butterfly Valve
- 5.1.2. Ball Valve
- 5.1.3. Globe Valve
- 5.1.4. Gate Valve
- 5.1.5. Plug Valve
- 5.1.6. Other Types
- 5.2. Market Analysis, Insights and Forecast - by Product
- 5.2.1. Quarter-turn Valve
- 5.2.2. Multi-turn Valve
- 5.2.3. Other Products
- 5.3. Market Analysis, Insights and Forecast - by Application
- 5.3.1. Power
- 5.3.2. Water and Wastewater Management
- 5.3.3. Chemicals
- 5.3.4. Oil and Gas
- 5.3.5. Other Ap
- 5.4. Market Analysis, Insights and Forecast - by Region
- 5.4.1. Asia Pacific
- 5.4.2. North America
- 5.4.3. Europe
- 5.4.4. South America
- 5.4.5. Middle East and Africa
- 5.1. Market Analysis, Insights and Forecast - by Type
- 6. Global Industrial Valves Market Analysis, Insights and Forecast, 2021-2033
- 6.1. Market Analysis, Insights and Forecast - by Type
- 6.1.1. Butterfly Valve
- 6.1.2. Ball Valve
- 6.1.3. Globe Valve
- 6.1.4. Gate Valve
- 6.1.5. Plug Valve
- 6.1.6. Other Types
- 6.2. Market Analysis, Insights and Forecast - by Product
- 6.2.1. Quarter-turn Valve
- 6.2.2. Multi-turn Valve
- 6.2.3. Other Products
- 6.3. Market Analysis, Insights and Forecast - by Application
- 6.3.1. Power
- 6.3.2. Water and Wastewater Management
- 6.3.3. Chemicals
- 6.3.4. Oil and Gas
- 6.3.5. Other Ap
- 6.1. Market Analysis, Insights and Forecast - by Type
- 7. Asia Pacific Industrial Valves Market Analysis, Insights and Forecast, 2020-2032
- 7.1. Market Analysis, Insights and Forecast - by Type
- 7.1.1. Butterfly Valve
- 7.1.2. Ball Valve
- 7.1.3. Globe Valve
- 7.1.4. Gate Valve
- 7.1.5. Plug Valve
- 7.1.6. Other Types
- 7.2. Market Analysis, Insights and Forecast - by Product
- 7.2.1. Quarter-turn Valve
- 7.2.2. Multi-turn Valve
- 7.2.3. Other Products
- 7.3. Market Analysis, Insights and Forecast - by Application
- 7.3.1. Power
- 7.3.2. Water and Wastewater Management
- 7.3.3. Chemicals
- 7.3.4. Oil and Gas
- 7.3.5. Other Ap
- 7.1. Market Analysis, Insights and Forecast - by Type
- 8. North America Industrial Valves Market Analysis, Insights and Forecast, 2020-2032
- 8.1. Market Analysis, Insights and Forecast - by Type
- 8.1.1. Butterfly Valve
- 8.1.2. Ball Valve
- 8.1.3. Globe Valve
- 8.1.4. Gate Valve
- 8.1.5. Plug Valve
- 8.1.6. Other Types
- 8.2. Market Analysis, Insights and Forecast - by Product
- 8.2.1. Quarter-turn Valve
- 8.2.2. Multi-turn Valve
- 8.2.3. Other Products
- 8.3. Market Analysis, Insights and Forecast - by Application
- 8.3.1. Power
- 8.3.2. Water and Wastewater Management
- 8.3.3. Chemicals
- 8.3.4. Oil and Gas
- 8.3.5. Other Ap
- 8.1. Market Analysis, Insights and Forecast - by Type
- 9. Europe Industrial Valves Market Analysis, Insights and Forecast, 2020-2032
- 9.1. Market Analysis, Insights and Forecast - by Type
- 9.1.1. Butterfly Valve
- 9.1.2. Ball Valve
- 9.1.3. Globe Valve
- 9.1.4. Gate Valve
- 9.1.5. Plug Valve
- 9.1.6. Other Types
- 9.2. Market Analysis, Insights and Forecast - by Product
- 9.2.1. Quarter-turn Valve
- 9.2.2. Multi-turn Valve
- 9.2.3. Other Products
- 9.3. Market Analysis, Insights and Forecast - by Application
- 9.3.1. Power
- 9.3.2. Water and Wastewater Management
- 9.3.3. Chemicals
- 9.3.4. Oil and Gas
- 9.3.5. Other Ap
- 9.1. Market Analysis, Insights and Forecast - by Type
- 10. South America Industrial Valves Market Analysis, Insights and Forecast, 2020-2032
- 10.1. Market Analysis, Insights and Forecast - by Type
- 10.1.1. Butterfly Valve
- 10.1.2. Ball Valve
- 10.1.3. Globe Valve
- 10.1.4. Gate Valve
- 10.1.5. Plug Valve
- 10.1.6. Other Types
- 10.2. Market Analysis, Insights and Forecast - by Product
- 10.2.1. Quarter-turn Valve
- 10.2.2. Multi-turn Valve
- 10.2.3. Other Products
- 10.3. Market Analysis, Insights and Forecast - by Application
- 10.3.1. Power
- 10.3.2. Water and Wastewater Management
- 10.3.3. Chemicals
- 10.3.4. Oil and Gas
- 10.3.5. Other Ap
- 10.1. Market Analysis, Insights and Forecast - by Type
- 11. Middle East and Africa Industrial Valves Market Analysis, Insights and Forecast, 2020-2032
- 11.1. Market Analysis, Insights and Forecast - by Type
- 11.1.1. Butterfly Valve
- 11.1.2. Ball Valve
- 11.1.3. Globe Valve
- 11.1.4. Gate Valve
- 11.1.5. Plug Valve
- 11.1.6. Other Types
- 11.2. Market Analysis, Insights and Forecast - by Product
- 11.2.1. Quarter-turn Valve
- 11.2.2. Multi-turn Valve
- 11.2.3. Other Products
- 11.3. Market Analysis, Insights and Forecast - by Application
- 11.3.1. Power
- 11.3.2. Water and Wastewater Management
- 11.3.3. Chemicals
- 11.3.4. Oil and Gas
- 11.3.5. Other Ap
- 11.1. Market Analysis, Insights and Forecast - by Type
- 12. Competitive Analysis
- 12.1. Company Profiles
- 12.1.1 Honeywell International Inc
- 12.1.1.1. Company Overview
- 12.1.1.2. Products
- 12.1.1.3. Company Financials
- 12.1.1.4. SWOT Analysis
- 12.1.2 Mueller Water Products Inc
- 12.1.2.1. Company Overview
- 12.1.2.2. Products
- 12.1.2.3. Company Financials
- 12.1.2.4. SWOT Analysis
- 12.1.3 Danfoss AS
- 12.1.3.1. Company Overview
- 12.1.3.2. Products
- 12.1.3.3. Company Financials
- 12.1.3.4. SWOT Analysis
- 12.1.4 Saint-Gobain
- 12.1.4.1. Company Overview
- 12.1.4.2. Products
- 12.1.4.3. Company Financials
- 12.1.4.4. SWOT Analysis
- 12.1.5 Okano Valve Mfg Co Ltd
- 12.1.5.1. Company Overview
- 12.1.5.2. Products
- 12.1.5.3. Company Financials
- 12.1.5.4. SWOT Analysis
- 12.1.6 ALFA LAVAL
- 12.1.6.1. Company Overview
- 12.1.6.2. Products
- 12.1.6.3. Company Financials
- 12.1.6.4. SWOT Analysis
- 12.1.7 Flowserve Corporation
- 12.1.7.1. Company Overview
- 12.1.7.2. Products
- 12.1.7.3. Company Financials
- 12.1.7.4. SWOT Analysis
- 12.1.8 The Weir Group PLC
- 12.1.8.1. Company Overview
- 12.1.8.2. Products
- 12.1.8.3. Company Financials
- 12.1.8.4. SWOT Analysis
- 12.1.9 Georg Fischer Ltd
- 12.1.9.1. Company Overview
- 12.1.9.2. Products
- 12.1.9.3. Company Financials
- 12.1.9.4. SWOT Analysis
- 12.1.10 NIBCO Inc
- 12.1.10.1. Company Overview
- 12.1.10.2. Products
- 12.1.10.3. Company Financials
- 12.1.10.4. SWOT Analysis
- 12.1.11 Baker Hughes
- 12.1.11.1. Company Overview
- 12.1.11.2. Products
- 12.1.11.3. Company Financials
- 12.1.11.4. SWOT Analysis
- 12.1.12 Hitachi Ltd
- 12.1.12.1. Company Overview
- 12.1.12.2. Products
- 12.1.12.3. Company Financials
- 12.1.12.4. SWOT Analysis
- 12.1.13 Xylem*List Not Exhaustive
- 12.1.13.1. Company Overview
- 12.1.13.2. Products
- 12.1.13.3. Company Financials
- 12.1.13.4. SWOT Analysis
- 12.1.14 Emerson Electric Co
- 12.1.14.1. Company Overview
- 12.1.14.2. Products
- 12.1.14.3. Company Financials
- 12.1.14.4. SWOT Analysis
- 12.1.15 Zhejiang Dunan Valve Co Ltd
- 12.1.15.1. Company Overview
- 12.1.15.2. Products
- 12.1.15.3. Company Financials
- 12.1.15.4. SWOT Analysis
- 12.1.16 CIRCOR International Inc
- 12.1.16.1. Company Overview
- 12.1.16.2. Products
- 12.1.16.3. Company Financials
- 12.1.16.4. SWOT Analysis
- 12.1.17 AVK Holding AS
- 12.1.17.1. Company Overview
- 12.1.17.2. Products
- 12.1.17.3. Company Financials
- 12.1.17.4. SWOT Analysis
- 12.1.18 ITT Inc
- 12.1.18.1. Company Overview
- 12.1.18.2. Products
- 12.1.18.3. Company Financials
- 12.1.18.4. SWOT Analysis
- 12.1.19 KLINGER Group
- 12.1.19.1. Company Overview
- 12.1.19.2. Products
- 12.1.19.3. Company Financials
- 12.1.19.4. SWOT Analysis
- 12.1.20 IMI
- 12.1.20.1. Company Overview
- 12.1.20.2. Products
- 12.1.20.3. Company Financials
- 12.1.20.4. SWOT Analysis
- 12.1.21 Crane Co
- 12.1.21.1. Company Overview
- 12.1.21.2. Products
- 12.1.21.3. Company Financials
- 12.1.21.4. SWOT Analysis
- 12.1.22 SLB
- 12.1.22.1. Company Overview
- 12.1.22.2. Products
- 12.1.22.3. Company Financials
- 12.1.22.4. SWOT Analysis
- 12.1.23 Valvitalia SpA
- 12.1.23.1. Company Overview
- 12.1.23.2. Products
- 12.1.23.3. Company Financials
- 12.1.23.4. SWOT Analysis
- 12.1.24 Curtiss-Wright Corporation
- 12.1.24.1. Company Overview
- 12.1.24.2. Products
- 12.1.24.3. Company Financials
- 12.1.24.4. SWOT Analysis
- 12.1.25 TechnipFMC PLC
- 12.1.25.1. Company Overview
- 12.1.25.2. Products
- 12.1.25.3. Company Financials
- 12.1.25.4. SWOT Analysis
- 12.1.26 KITZ Corporation
- 12.1.26.1. Company Overview
- 12.1.26.2. Products
- 12.1.26.3. Company Financials
- 12.1.26.4. SWOT Analysis
- 12.1.1 Honeywell International Inc
- 12.2. Market Entropy
- 12.2.1 Company's Key Areas Served
- 12.2.2 Recent Developments
- 12.3. Company Market Share Analysis 2025
- 12.3.1 Top 5 Companies Market Share Analysis
- 12.3.2 Top 3 Companies Market Share Analysis
- 12.4. List of Potential Customers
- 13. Research Methodology
List of Figures
- Figure 1: Global Industrial Valves Market Revenue Breakdown (Million, %) by Region 2025 & 2033
- Figure 2: Asia Pacific Industrial Valves Market Revenue (Million), by Type 2025 & 2033
- Figure 3: Asia Pacific Industrial Valves Market Revenue Share (%), by Type 2025 & 2033
- Figure 4: Asia Pacific Industrial Valves Market Revenue (Million), by Product 2025 & 2033
- Figure 5: Asia Pacific Industrial Valves Market Revenue Share (%), by Product 2025 & 2033
- Figure 6: Asia Pacific Industrial Valves Market Revenue (Million), by Application 2025 & 2033
- Figure 7: Asia Pacific Industrial Valves Market Revenue Share (%), by Application 2025 & 2033
- Figure 8: Asia Pacific Industrial Valves Market Revenue (Million), by Country 2025 & 2033
- Figure 9: Asia Pacific Industrial Valves Market Revenue Share (%), by Country 2025 & 2033
- Figure 10: North America Industrial Valves Market Revenue (Million), by Type 2025 & 2033
- Figure 11: North America Industrial Valves Market Revenue Share (%), by Type 2025 & 2033
- Figure 12: North America Industrial Valves Market Revenue (Million), by Product 2025 & 2033
- Figure 13: North America Industrial Valves Market Revenue Share (%), by Product 2025 & 2033
- Figure 14: North America Industrial Valves Market Revenue (Million), by Application 2025 & 2033
- Figure 15: North America Industrial Valves Market Revenue Share (%), by Application 2025 & 2033
- Figure 16: North America Industrial Valves Market Revenue (Million), by Country 2025 & 2033
- Figure 17: North America Industrial Valves Market Revenue Share (%), by Country 2025 & 2033
- Figure 18: Europe Industrial Valves Market Revenue (Million), by Type 2025 & 2033
- Figure 19: Europe Industrial Valves Market Revenue Share (%), by Type 2025 & 2033
- Figure 20: Europe Industrial Valves Market Revenue (Million), by Product 2025 & 2033
- Figure 21: Europe Industrial Valves Market Revenue Share (%), by Product 2025 & 2033
- Figure 22: Europe Industrial Valves Market Revenue (Million), by Application 2025 & 2033
- Figure 23: Europe Industrial Valves Market Revenue Share (%), by Application 2025 & 2033
- Figure 24: Europe Industrial Valves Market Revenue (Million), by Country 2025 & 2033
- Figure 25: Europe Industrial Valves Market Revenue Share (%), by Country 2025 & 2033
- Figure 26: South America Industrial Valves Market Revenue (Million), by Type 2025 & 2033
- Figure 27: South America Industrial Valves Market Revenue Share (%), by Type 2025 & 2033
- Figure 28: South America Industrial Valves Market Revenue (Million), by Product 2025 & 2033
- Figure 29: South America Industrial Valves Market Revenue Share (%), by Product 2025 & 2033
- Figure 30: South America Industrial Valves Market Revenue (Million), by Application 2025 & 2033
- Figure 31: South America Industrial Valves Market Revenue Share (%), by Application 2025 & 2033
- Figure 32: South America Industrial Valves Market Revenue (Million), by Country 2025 & 2033
- Figure 33: South America Industrial Valves Market Revenue Share (%), by Country 2025 & 2033
- Figure 34: Middle East and Africa Industrial Valves Market Revenue (Million), by Type 2025 & 2033
- Figure 35: Middle East and Africa Industrial Valves Market Revenue Share (%), by Type 2025 & 2033
- Figure 36: Middle East and Africa Industrial Valves Market Revenue (Million), by Product 2025 & 2033
- Figure 37: Middle East and Africa Industrial Valves Market Revenue Share (%), by Product 2025 & 2033
- Figure 38: Middle East and Africa Industrial Valves Market Revenue (Million), by Application 2025 & 2033
- Figure 39: Middle East and Africa Industrial Valves Market Revenue Share (%), by Application 2025 & 2033
- Figure 40: Middle East and Africa Industrial Valves Market Revenue (Million), by Country 2025 & 2033
- Figure 41: Middle East and Africa Industrial Valves Market Revenue Share (%), by Country 2025 & 2033
List of Tables
- Table 1: Global Industrial Valves Market Revenue Million Forecast, by Type 2020 & 2033
- Table 2: Global Industrial Valves Market Revenue Million Forecast, by Product 2020 & 2033
- Table 3: Global Industrial Valves Market Revenue Million Forecast, by Application 2020 & 2033
- Table 4: Global Industrial Valves Market Revenue Million Forecast, by Region 2020 & 2033
- Table 5: Global Industrial Valves Market Revenue Million Forecast, by Type 2020 & 2033
- Table 6: Global Industrial Valves Market Revenue Million Forecast, by Product 2020 & 2033
- Table 7: Global Industrial Valves Market Revenue Million Forecast, by Application 2020 & 2033
- Table 8: Global Industrial Valves Market Revenue Million Forecast, by Country 2020 & 2033
- Table 9: China Industrial Valves Market Revenue (Million) Forecast, by Application 2020 & 2033
- Table 10: India Industrial Valves Market Revenue (Million) Forecast, by Application 2020 & 2033
- Table 11: Japan Industrial Valves Market Revenue (Million) Forecast, by Application 2020 & 2033
- Table 12: South Korea Industrial Valves Market Revenue (Million) Forecast, by Application 2020 & 2033
- Table 13: Indonesia Industrial Valves Market Revenue (Million) Forecast, by Application 2020 & 2033
- Table 14: Vietnam Industrial Valves Market Revenue (Million) Forecast, by Application 2020 & 2033
- Table 15: Malaysia Industrial Valves Market Revenue (Million) Forecast, by Application 2020 & 2033
- Table 16: Thailand Industrial Valves Market Revenue (Million) Forecast, by Application 2020 & 2033
- Table 17: Rest of Asia Pacific Industrial Valves Market Revenue (Million) Forecast, by Application 2020 & 2033
- Table 18: Global Industrial Valves Market Revenue Million Forecast, by Type 2020 & 2033
- Table 19: Global Industrial Valves Market Revenue Million Forecast, by Product 2020 & 2033
- Table 20: Global Industrial Valves Market Revenue Million Forecast, by Application 2020 & 2033
- Table 21: Global Industrial Valves Market Revenue Million Forecast, by Country 2020 & 2033
- Table 22: United States Industrial Valves Market Revenue (Million) Forecast, by Application 2020 & 2033
- Table 23: Canada Industrial Valves Market Revenue (Million) Forecast, by Application 2020 & 2033
- Table 24: Mexico Industrial Valves Market Revenue (Million) Forecast, by Application 2020 & 2033
- Table 25: Global Industrial Valves Market Revenue Million Forecast, by Type 2020 & 2033
- Table 26: Global Industrial Valves Market Revenue Million Forecast, by Product 2020 & 2033
- Table 27: Global Industrial Valves Market Revenue Million Forecast, by Application 2020 & 2033
- Table 28: Global Industrial Valves Market Revenue Million Forecast, by Country 2020 & 2033
- Table 29: Germany Industrial Valves Market Revenue (Million) Forecast, by Application 2020 & 2033
- Table 30: United Kingdom Industrial Valves Market Revenue (Million) Forecast, by Application 2020 & 2033
- Table 31: Italy Industrial Valves Market Revenue (Million) Forecast, by Application 2020 & 2033
- Table 32: France Industrial Valves Market Revenue (Million) Forecast, by Application 2020 & 2033
- Table 33: NORDIC Industrial Valves Market Revenue (Million) Forecast, by Application 2020 & 2033
- Table 34: Turkey Industrial Valves Market Revenue (Million) Forecast, by Application 2020 & 2033
- Table 35: Russia Industrial Valves Market Revenue (Million) Forecast, by Application 2020 & 2033
- Table 36: Spain Industrial Valves Market Revenue (Million) Forecast, by Application 2020 & 2033
- Table 37: Rest of Europe Industrial Valves Market Revenue (Million) Forecast, by Application 2020 & 2033
- Table 38: Global Industrial Valves Market Revenue Million Forecast, by Type 2020 & 2033
- Table 39: Global Industrial Valves Market Revenue Million Forecast, by Product 2020 & 2033
- Table 40: Global Industrial Valves Market Revenue Million Forecast, by Application 2020 & 2033
- Table 41: Global Industrial Valves Market Revenue Million Forecast, by Country 2020 & 2033
- Table 42: Brazil Industrial Valves Market Revenue (Million) Forecast, by Application 2020 & 2033
- Table 43: Argentina Industrial Valves Market Revenue (Million) Forecast, by Application 2020 & 2033
- Table 44: Colombia Industrial Valves Market Revenue (Million) Forecast, by Application 2020 & 2033
- Table 45: Rest of South America Industrial Valves Market Revenue (Million) Forecast, by Application 2020 & 2033
- Table 46: Global Industrial Valves Market Revenue Million Forecast, by Type 2020 & 2033
- Table 47: Global Industrial Valves Market Revenue Million Forecast, by Product 2020 & 2033
- Table 48: Global Industrial Valves Market Revenue Million Forecast, by Application 2020 & 2033
- Table 49: Global Industrial Valves Market Revenue Million Forecast, by Country 2020 & 2033
- Table 50: Saudi Arabia Industrial Valves Market Revenue (Million) Forecast, by Application 2020 & 2033
- Table 51: South Africa Industrial Valves Market Revenue (Million) Forecast, by Application 2020 & 2033
- Table 52: United Arab Emirates Industrial Valves Market Revenue (Million) Forecast, by Application 2020 & 2033
- Table 53: Qatar Industrial Valves Market Revenue (Million) Forecast, by Application 2020 & 2033
- Table 54: Nigeria Industrial Valves Market Revenue (Million) Forecast, by Application 2020 & 2033
- Table 55: Egypt Industrial Valves Market Revenue (Million) Forecast, by Application 2020 & 2033
- Table 56: Rest of Middle East and Africa Industrial Valves Market Revenue (Million) Forecast, by Application 2020 & 2033
Frequently Asked Questions
1. What is the projected Compound Annual Growth Rate (CAGR) of the Industrial Valves Market?
The projected CAGR is approximately 4.52%.
2. Which companies are prominent players in the Industrial Valves Market?
Key companies in the market include Honeywell International Inc, Mueller Water Products Inc, Danfoss AS, Saint-Gobain, Okano Valve Mfg Co Ltd, ALFA LAVAL, Flowserve Corporation, The Weir Group PLC, Georg Fischer Ltd, NIBCO Inc, Baker Hughes, Hitachi Ltd, Xylem*List Not Exhaustive, Emerson Electric Co, Zhejiang Dunan Valve Co Ltd, CIRCOR International Inc, AVK Holding AS, ITT Inc, KLINGER Group, IMI, Crane Co, SLB, Valvitalia SpA, Curtiss-Wright Corporation, TechnipFMC PLC, KITZ Corporation.
3. What are the main segments of the Industrial Valves Market?
The market segments include Type, Product, Application.
4. Can you provide details about the market size?
The market size is estimated to be USD 70.97 Million as of 2022.
5. What are some drivers contributing to market growth?
Growing Demand from the Power and Chemical Industry; Increase in Demand for Desalination Activity.
6. What are the notable trends driving market growth?
Increasing Demand from the Power Industry.
7. Are there any restraints impacting market growth?
Stagnant Industrial Growth in Developed Countries; Other Restraints.
8. Can you provide examples of recent developments in the market?
September 2023: Danfoss India opened a new India distribution center in Chennai, India, that is spread over 43,000 square feet and has a 4,000 pallet position facility to support growth plans. This new distribution unit will likely aggregate Danfoss products from Asia, Europe, Latin America, and Denmark.
9. What pricing options are available for accessing the report?
Pricing options include single-user, multi-user, and enterprise licenses priced at USD 4750, USD 5250, and USD 8750 respectively.
10. Is the market size provided in terms of value or volume?
The market size is provided in terms of value, measured in Million.
11. Are there any specific market keywords associated with the report?
Yes, the market keyword associated with the report is "Industrial Valves Market," which aids in identifying and referencing the specific market segment covered.
12. How do I determine which pricing option suits my needs best?
The pricing options vary based on user requirements and access needs. Individual users may opt for single-user licenses, while businesses requiring broader access may choose multi-user or enterprise licenses for cost-effective access to the report.
13. Are there any additional resources or data provided in the Industrial Valves Market report?
While the report offers comprehensive insights, it's advisable to review the specific contents or supplementary materials provided to ascertain if additional resources or data are available.
14. How can I stay updated on further developments or reports in the Industrial Valves Market?
To stay informed about further developments, trends, and reports in the Industrial Valves Market, consider subscribing to industry newsletters, following relevant companies and organizations, or regularly checking reputable industry news sources and publications.
Methodology
Step 1 - Identification of Relevant Samples Size from Population Database


Step 2 - Approaches for Defining Global Market Size (Value, Volume* & Price*)

Note*: In applicable scenarios
Step 3 - Data Sources
Primary Research
- Web Analytics
- Survey Reports
- Research Institute
- Latest Research Reports
- Opinion Leaders
Secondary Research
- Annual Reports
- White Paper
- Latest Press Release
- Industry Association
- Paid Database
- Investor Presentations

Step 4 - Data Triangulation
Involves using different sources of information in order to increase the validity of a study
These sources are likely to be stakeholders in a program - participants, other researchers, program staff, other community members, and so on.
Then we put all data in single framework & apply various statistical tools to find out the dynamic on the market.
During the analysis stage, feedback from the stakeholder groups would be compared to determine areas of agreement as well as areas of divergence