

Key Insights
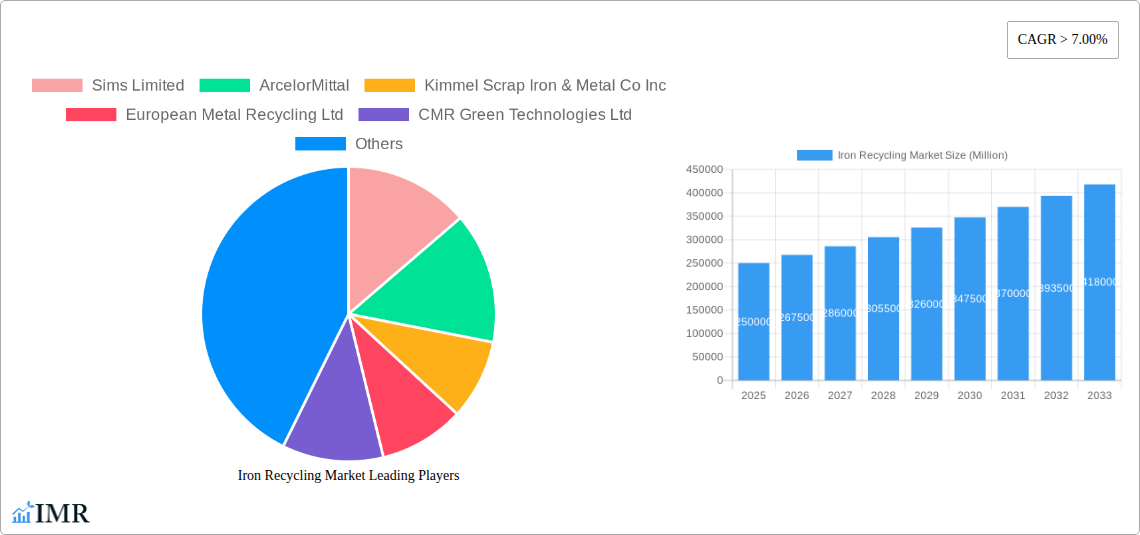
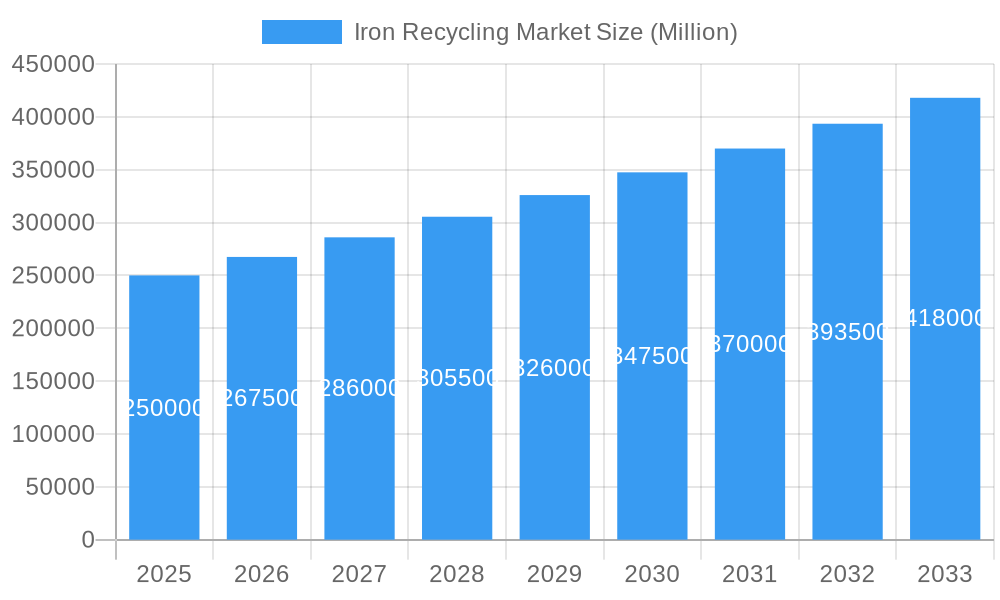
The global Iron Recycling Market is poised for substantial expansion, projected to reach a significant market size with a Compound Annual Growth Rate (CAGR) exceeding 7.00% over the forecast period of 2025-2033. This robust growth trajectory is primarily fueled by escalating environmental consciousness, stricter regulations governing waste management, and the ever-increasing demand for raw materials across various industrial sectors. The inherent sustainability and cost-effectiveness of recycled iron compared to virgin production are key drivers, making it an attractive option for manufacturers aiming to reduce their environmental footprint and operational expenses. The market's value unit is in millions, reflecting the substantial economic activity within this sector.
Iron Recycling Market Market Size (In Billion)
Several key drivers are propelling this market forward. The burgeoning building and construction industry, particularly in developing economies, necessitates vast quantities of steel, a significant portion of which is derived from recycled iron. Similarly, the automotive sector is increasingly adopting recycled materials to meet sustainability targets and improve fuel efficiency. The packaging industry, driven by a global shift towards more sustainable packaging solutions, also presents a growing demand for recycled iron. Furthermore, advancements in recycling technologies are enhancing the efficiency and purity of recycled iron, making it a viable and preferred alternative for high-end applications in shipbuilding and electronics. However, challenges such as fluctuating scrap metal prices, logistical complexities in collection and transportation, and the presence of impurities in certain scrap grades can act as restraints, although innovation and strategic partnerships are actively addressing these concerns. Key players like ArcelorMittal, Sims Limited, and Nucor Corporation are investing in advanced recycling infrastructure and technologies to capitalize on these growth opportunities.
Iron Recycling Market Company Market Share
Comprehensive Iron Recycling Market Report: Trends, Opportunities & Future Outlook (2019-2033)
This in-depth report delivers a thorough analysis of the global iron recycling market, exploring its intricate dynamics, growth trajectory, and future potential. Covering a comprehensive study period from 2019 to 2033, with a base year of 2025, this research provides invaluable insights for industry stakeholders, investors, and policymakers. We delve into the parent and child market segments, offering a granular view of this vital sector of the metal recycling industry. Leverage high-traffic keywords like steel scrap recycling, ferrous metal recycling, sustainable steel production, and circular economy metals to maximize your understanding and strategic positioning. All quantitative values are presented in Million units.
Iron Recycling Market Market Dynamics & Structure
The iron recycling market exhibits a moderately concentrated structure, with a few key players holding significant market share. Technological innovation is a primary driver, particularly advancements in sorting, processing, and melting technologies that improve efficiency and purity of recycled iron. Regulatory frameworks, including environmental protection laws and waste management directives, play a crucial role in shaping market practices and promoting sustainable ferrous scrap recycling. Competitive product substitutes, while present in some applications, are often outcompeted by the cost-effectiveness and environmental benefits of recycled iron. End-user demographics are shifting towards greater demand for sustainable materials, especially in construction and automotive sectors, influencing the circular economy for metals. Mergers and acquisitions (M&A) trends are indicative of consolidation and strategic expansion, aiming to enhance market presence and operational capabilities.
- Market Concentration: Dominated by a mix of large multinational corporations and specialized regional players.
- Technological Innovation: Focus on automated sorting, advanced smelting techniques, and impurity removal.
- Regulatory Frameworks: Driving adoption of higher recycled content mandates and stricter environmental standards.
- End-User Demographics: Growing preference for green building materials and eco-friendly automotive components.
- M&A Trends: Strategic acquisitions to expand geographic reach and enhance processing capabilities.
Iron Recycling Market Growth Trends & Insights
The iron recycling market is poised for robust growth, driven by increasing environmental consciousness, stringent regulations, and the inherent economic advantages of utilizing recycled materials. The market size is projected to expand significantly from its historical base in 2019-2024, fueled by escalating demand across major end-user industries. Adoption rates for recycled iron are accelerating as manufacturers recognize its role in reducing carbon footprints and achieving sustainability goals. Technological disruptions, such as enhanced beneficiation techniques and the development of higher-grade recycled iron products, are further propelling market penetration. Consumer behavior shifts towards purchasing products manufactured using sustainable materials are indirectly influencing the demand for recycled iron. For instance, the automotive sector's commitment to lightweighting and reduced emissions necessitates greater use of recycled ferrous metals. The packaging industry is also witnessing a surge in demand for eco-friendly solutions.
- Market Size Evolution: Expected to see a substantial Compound Annual Growth Rate (CAGR) of approximately 5.5% from 2025-2033.
- Adoption Rates: Increasing integration of recycled iron in manufacturing processes across diverse sectors.
- Technological Disruptions: Innovations in scrap processing and purification are enhancing the quality and applicability of recycled iron.
- Consumer Behavior Shifts: Growing preference for sustainably sourced products is a key indirect driver for iron recycling.
- Market Penetration: Forecasted to reach over 70% across key end-user industries by 2033.
Dominant Regions, Countries, or Segments in Iron Recycling Market
The Building and Construction sector stands as a dominant force in the iron recycling market. This segment's growth is intrinsically linked to global infrastructure development, urbanization, and the increasing adoption of sustainable building practices. The demand for steel in construction, a primary component for which recycled iron is a crucial feedstock, remains consistently high. Government initiatives promoting green building standards and the use of recycled materials further bolster this segment's dominance.
- Building and Construction: This segment is projected to account for over 35% of the total iron recycling market share by 2033.
- Key Drivers: Global infrastructure spending, urbanization trends in developing economies, and stringent building codes mandating recycled content.
- Growth Potential: Significant potential for increased utilization of recycled iron in structural elements, reinforcement bars, and pre-fabricated components.
- Automotive: The automotive industry is another major consumer, driven by the need for lightweight materials and reduced manufacturing emissions.
- Key Drivers: Evolving emissions regulations, increasing demand for electric vehicles (EVs) that require specialized steel grades, and a focus on circular economy principles in manufacturing.
- Growth Potential: The continuous push for fuel efficiency and reduced environmental impact in vehicle production bodes well for recycled iron demand.
- Other End-User Industries: Including Packaging, Shipbuilding, Electronics & Electrical Equipment, and Consumer Appliances, collectively contribute to the market's diversification.
- Key Drivers: Growing demand for durable and recyclable packaging solutions, expansion of shipbuilding activities, and the increasing production of consumer goods.
- Growth Potential: These segments, while individually smaller, represent significant opportunities for niche applications and specialized recycled iron products.
Iron Recycling Market Product Landscape
The iron recycling market product landscape is characterized by a diverse range of recycled iron grades tailored to specific applications. Innovations focus on improving the purity and consistency of processed scrap iron, enabling its use in higher-value applications. Key product innovations include the development of specialized ferrous alloys from recycled content and advancements in de-phosphorization and de-sulfurization processes. These technological advancements ensure that recycled iron meets stringent industry standards for strength, durability, and performance, making it a viable and often superior alternative to virgin iron ore in many applications.
Key Drivers, Barriers & Challenges in Iron Recycling Market
The iron recycling market is propelled by several key drivers, including the escalating cost of virgin iron ore, stringent environmental regulations pushing for reduced carbon emissions in steelmaking, and the growing demand for sustainable materials across industries. Technological advancements in scrap sorting and processing further enhance the efficiency and economic viability of recycling.
- Key Drivers:
- Environmental Regulations: Mandates for reduced carbon emissions and increased recycled content.
- Economic Viability: Cost-effectiveness compared to virgin iron production.
- Resource Scarcity: Growing awareness of finite natural resources.
- Technological Advancements: Improved processing and purification techniques.
Conversely, the market faces significant barriers and challenges. Inconsistent quality and availability of scrap metal feedstock, coupled with complex logistics and collection networks, can hinder smooth operations. Fluctuations in global commodity prices also impact profitability.
- Key Barriers & Challenges:
- Scrap Quality & Consistency: Variations in collected scrap can affect final product quality.
- Logistics & Collection: Inefficient collection networks and transportation costs.
- Price Volatility: Fluctuations in scrap and finished product prices.
- Contamination Issues: Presence of non-ferrous metals or other impurities requiring extensive processing.
Emerging Opportunities in Iron Recycling Market
Emerging opportunities in the iron recycling market lie in the development of advanced sorting technologies that can efficiently segregate various grades of ferrous scrap. Furthermore, there's a growing demand for high-purity recycled iron for specialized applications in sectors like aerospace and high-performance automotive components. The expansion of the circular economy model across more industries presents untapped markets for recycled ferrous materials.
Growth Accelerators in the Iron Recycling Market Industry
Growth accelerators for the iron recycling market include strategic partnerships between steel manufacturers and recycling companies to secure a stable supply of high-quality scrap. The ongoing development of cleaner steelmaking technologies, which heavily rely on recycled iron as a primary input, also acts as a significant growth catalyst. Furthermore, government incentives and policies promoting the use of recycled materials in large-scale infrastructure projects are expected to drive substantial market expansion.
Key Players Shaping the Iron Recycling Market Market
- Sims Limited
- ArcelorMittal
- Kimmel Scrap Iron & Metal Co Inc
- European Metal Recycling Ltd
- CMR Green Technologies Ltd
- CMC
- OmniSource LLC
- Schnitzer Steel Industries Inc
- Nucor Corporation
- Tata Steel
Notable Milestones in Iron Recycling Market Sector
- December 2022: Nucor Corporation partnered with green iron company, Electra, to utilize Electra's iron and further lower the carbon emissions of its sustainable steel products.
- March 2022: ArcelorMittal acquired Scottish steel recycling business John Lawrie Metals Ltd., reinforcing its strategy to increase scrap steel usage for reduced CO2 emissions in steelmaking.
In-Depth Iron Recycling Market Market Outlook
The future outlook for the iron recycling market is exceptionally positive, driven by a confluence of environmental imperatives and economic advantages. Growth accelerators, such as the increasing global emphasis on sustainability and the circular economy, are expected to propel demand for recycled iron significantly. Strategic partnerships and technological breakthroughs in processing ferrous scrap will further enhance efficiency and product quality. The steel scrap recycling industry is thus poised for sustained expansion, presenting considerable strategic opportunities for market participants.
Iron Recycling Market Segmentation
-
1. End-user Industry
- 1.1. Building and Construction
- 1.2. Automotive
- 1.3. Packaging
- 1.4. Shipbuilding
- 1.5. Electronics & Electrical Equipment
- 1.6. Consumer Appliances
- 1.7. Other End-User Industries
Iron Recycling Market Segmentation By Geography
-
1. Asia Pacific
- 1.1. China
- 1.2. India
- 1.3. Japan
- 1.4. South Korea
- 1.5. Rest of Asia Pacific
-
2. North America
- 2.1. United States
- 2.2. Canada
- 2.3. Mexico
-
3. Europe
- 3.1. Germany
- 3.2. United Kingdom
- 3.3. Italy
- 3.4. France
- 3.5. Rest of Europe
-
4. South America
- 4.1. Brazil
- 4.2. Argentina
- 4.3. Rest of South America
-
5. Middle East and Africa
- 5.1. Saudi Arabia
- 5.2. South Africa
- 5.3. Rest of Middle East and Africa
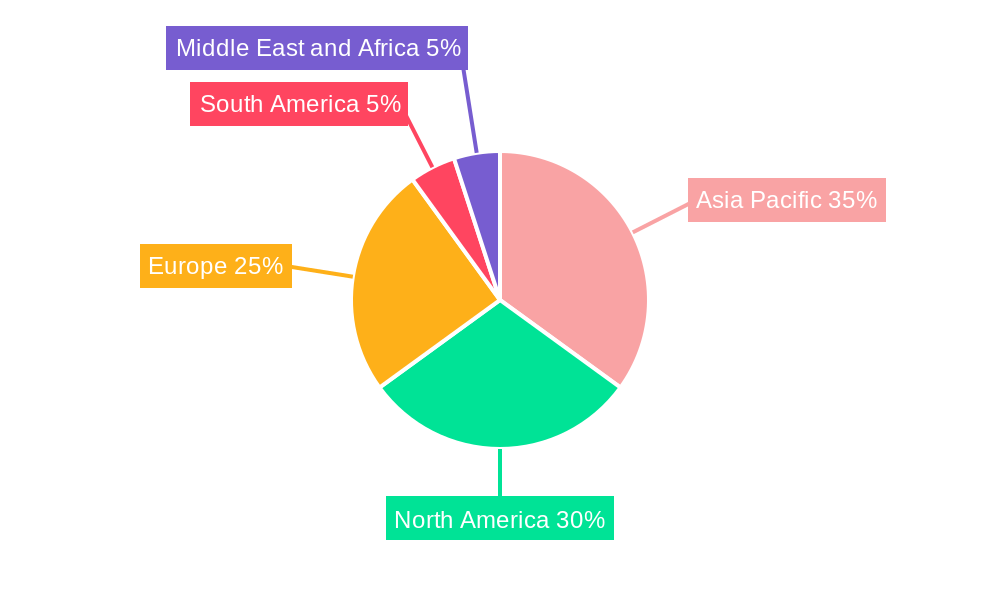
Iron Recycling Market Regional Market Share
Geographic Coverage of Iron Recycling Market
Iron Recycling Market REPORT HIGHLIGHTS
| Aspects | Details |
|---|---|
| Study Period | 2020-2034 |
| Base Year | 2025 |
| Estimated Year | 2026 |
| Forecast Period | 2026-2034 |
| Historical Period | 2020-2025 |
| Growth Rate | CAGR of 6.8% from 2020-2034 |
| Segmentation |
|
Table of Contents
- 1. Introduction
- 1.1. Research Scope
- 1.2. Market Segmentation
- 1.3. Research Objective
- 1.4. Definitions and Assumptions
- 2. Executive Summary
- 2.1. Market Snapshot
- 3. Market Dynamics
- 3.1. Market Drivers
- 3.2. Market Restrains
- 3.3. Market Trends
- 3.4. Market Opportunities
- 4. Market Factor Analysis
- 4.1. Porters Five Forces
- 4.1.1. Bargaining Power of Suppliers
- 4.1.2. Bargaining Power of Buyers
- 4.1.3. Threat of New Entrants
- 4.1.4. Threat of Substitutes
- 4.1.5. Competitive Rivalry
- 4.2. PESTEL analysis
- 4.3. BCG Analysis
- 4.3.1. Stars (High Growth, High Market Share)
- 4.3.2. Cash Cows (Low Growth, High Market Share)
- 4.3.3. Question Mark (High Growth, Low Market Share)
- 4.3.4. Dogs (Low Growth, Low Market Share)
- 4.4. Ansoff Matrix Analysis
- 4.5. Supply Chain Analysis
- 4.6. Regulatory Landscape
- 4.7. Current Market Potential and Opportunity Assessment (TAM–SAM–SOM Framework)
- 4.8. IMR Analyst Note
- 4.1. Porters Five Forces
- 5. Market Analysis, Insights and Forecast 2021-2033
- 5.1. Market Analysis, Insights and Forecast - by End-user Industry
- 5.1.1. Building and Construction
- 5.1.2. Automotive
- 5.1.3. Packaging
- 5.1.4. Shipbuilding
- 5.1.5. Electronics & Electrical Equipment
- 5.1.6. Consumer Appliances
- 5.1.7. Other End-User Industries
- 5.2. Market Analysis, Insights and Forecast - by Region
- 5.2.1. Asia Pacific
- 5.2.2. North America
- 5.2.3. Europe
- 5.2.4. South America
- 5.2.5. Middle East and Africa
- 5.1. Market Analysis, Insights and Forecast - by End-user Industry
- 6. Global Iron Recycling Market Analysis, Insights and Forecast, 2021-2033
- 6.1. Market Analysis, Insights and Forecast - by End-user Industry
- 6.1.1. Building and Construction
- 6.1.2. Automotive
- 6.1.3. Packaging
- 6.1.4. Shipbuilding
- 6.1.5. Electronics & Electrical Equipment
- 6.1.6. Consumer Appliances
- 6.1.7. Other End-User Industries
- 6.1. Market Analysis, Insights and Forecast - by End-user Industry
- 7. Asia Pacific Iron Recycling Market Analysis, Insights and Forecast, 2020-2032
- 7.1. Market Analysis, Insights and Forecast - by End-user Industry
- 7.1.1. Building and Construction
- 7.1.2. Automotive
- 7.1.3. Packaging
- 7.1.4. Shipbuilding
- 7.1.5. Electronics & Electrical Equipment
- 7.1.6. Consumer Appliances
- 7.1.7. Other End-User Industries
- 7.1. Market Analysis, Insights and Forecast - by End-user Industry
- 8. North America Iron Recycling Market Analysis, Insights and Forecast, 2020-2032
- 8.1. Market Analysis, Insights and Forecast - by End-user Industry
- 8.1.1. Building and Construction
- 8.1.2. Automotive
- 8.1.3. Packaging
- 8.1.4. Shipbuilding
- 8.1.5. Electronics & Electrical Equipment
- 8.1.6. Consumer Appliances
- 8.1.7. Other End-User Industries
- 8.1. Market Analysis, Insights and Forecast - by End-user Industry
- 9. Europe Iron Recycling Market Analysis, Insights and Forecast, 2020-2032
- 9.1. Market Analysis, Insights and Forecast - by End-user Industry
- 9.1.1. Building and Construction
- 9.1.2. Automotive
- 9.1.3. Packaging
- 9.1.4. Shipbuilding
- 9.1.5. Electronics & Electrical Equipment
- 9.1.6. Consumer Appliances
- 9.1.7. Other End-User Industries
- 9.1. Market Analysis, Insights and Forecast - by End-user Industry
- 10. South America Iron Recycling Market Analysis, Insights and Forecast, 2020-2032
- 10.1. Market Analysis, Insights and Forecast - by End-user Industry
- 10.1.1. Building and Construction
- 10.1.2. Automotive
- 10.1.3. Packaging
- 10.1.4. Shipbuilding
- 10.1.5. Electronics & Electrical Equipment
- 10.1.6. Consumer Appliances
- 10.1.7. Other End-User Industries
- 10.1. Market Analysis, Insights and Forecast - by End-user Industry
- 11. Middle East and Africa Iron Recycling Market Analysis, Insights and Forecast, 2020-2032
- 11.1. Market Analysis, Insights and Forecast - by End-user Industry
- 11.1.1. Building and Construction
- 11.1.2. Automotive
- 11.1.3. Packaging
- 11.1.4. Shipbuilding
- 11.1.5. Electronics & Electrical Equipment
- 11.1.6. Consumer Appliances
- 11.1.7. Other End-User Industries
- 11.1. Market Analysis, Insights and Forecast - by End-user Industry
- 12. Competitive Analysis
- 12.1. Company Profiles
- 12.1.1 Sims Limited
- 12.1.1.1. Company Overview
- 12.1.1.2. Products
- 12.1.1.3. Company Financials
- 12.1.1.4. SWOT Analysis
- 12.1.2 ArcelorMittal
- 12.1.2.1. Company Overview
- 12.1.2.2. Products
- 12.1.2.3. Company Financials
- 12.1.2.4. SWOT Analysis
- 12.1.3 Kimmel Scrap Iron & Metal Co Inc
- 12.1.3.1. Company Overview
- 12.1.3.2. Products
- 12.1.3.3. Company Financials
- 12.1.3.4. SWOT Analysis
- 12.1.4 European Metal Recycling Ltd
- 12.1.4.1. Company Overview
- 12.1.4.2. Products
- 12.1.4.3. Company Financials
- 12.1.4.4. SWOT Analysis
- 12.1.5 CMR Green Technologies Ltd
- 12.1.5.1. Company Overview
- 12.1.5.2. Products
- 12.1.5.3. Company Financials
- 12.1.5.4. SWOT Analysis
- 12.1.6 CMC
- 12.1.6.1. Company Overview
- 12.1.6.2. Products
- 12.1.6.3. Company Financials
- 12.1.6.4. SWOT Analysis
- 12.1.7 OmniSource LLC
- 12.1.7.1. Company Overview
- 12.1.7.2. Products
- 12.1.7.3. Company Financials
- 12.1.7.4. SWOT Analysis
- 12.1.8 Schnitzer Steel Industries Inc
- 12.1.8.1. Company Overview
- 12.1.8.2. Products
- 12.1.8.3. Company Financials
- 12.1.8.4. SWOT Analysis
- 12.1.9 Nucor Corporation
- 12.1.9.1. Company Overview
- 12.1.9.2. Products
- 12.1.9.3. Company Financials
- 12.1.9.4. SWOT Analysis
- 12.1.10 Tata Steel
- 12.1.10.1. Company Overview
- 12.1.10.2. Products
- 12.1.10.3. Company Financials
- 12.1.10.4. SWOT Analysis
- 12.1.1 Sims Limited
- 12.2. Market Entropy
- 12.2.1 Company's Key Areas Served
- 12.2.2 Recent Developments
- 12.3. Company Market Share Analysis 2025
- 12.3.1 Top 5 Companies Market Share Analysis
- 12.3.2 Top 3 Companies Market Share Analysis
- 12.4. List of Potential Customers
- 13. Research Methodology
List of Figures
- Figure 1: Global Iron Recycling Market Revenue Breakdown (billion, %) by Region 2025 & 2033
- Figure 2: Global Iron Recycling Market Volume Breakdown (K Tons, %) by Region 2025 & 2033
- Figure 3: Asia Pacific Iron Recycling Market Revenue (billion), by End-user Industry 2025 & 2033
- Figure 4: Asia Pacific Iron Recycling Market Volume (K Tons), by End-user Industry 2025 & 2033
- Figure 5: Asia Pacific Iron Recycling Market Revenue Share (%), by End-user Industry 2025 & 2033
- Figure 6: Asia Pacific Iron Recycling Market Volume Share (%), by End-user Industry 2025 & 2033
- Figure 7: Asia Pacific Iron Recycling Market Revenue (billion), by Country 2025 & 2033
- Figure 8: Asia Pacific Iron Recycling Market Volume (K Tons), by Country 2025 & 2033
- Figure 9: Asia Pacific Iron Recycling Market Revenue Share (%), by Country 2025 & 2033
- Figure 10: Asia Pacific Iron Recycling Market Volume Share (%), by Country 2025 & 2033
- Figure 11: North America Iron Recycling Market Revenue (billion), by End-user Industry 2025 & 2033
- Figure 12: North America Iron Recycling Market Volume (K Tons), by End-user Industry 2025 & 2033
- Figure 13: North America Iron Recycling Market Revenue Share (%), by End-user Industry 2025 & 2033
- Figure 14: North America Iron Recycling Market Volume Share (%), by End-user Industry 2025 & 2033
- Figure 15: North America Iron Recycling Market Revenue (billion), by Country 2025 & 2033
- Figure 16: North America Iron Recycling Market Volume (K Tons), by Country 2025 & 2033
- Figure 17: North America Iron Recycling Market Revenue Share (%), by Country 2025 & 2033
- Figure 18: North America Iron Recycling Market Volume Share (%), by Country 2025 & 2033
- Figure 19: Europe Iron Recycling Market Revenue (billion), by End-user Industry 2025 & 2033
- Figure 20: Europe Iron Recycling Market Volume (K Tons), by End-user Industry 2025 & 2033
- Figure 21: Europe Iron Recycling Market Revenue Share (%), by End-user Industry 2025 & 2033
- Figure 22: Europe Iron Recycling Market Volume Share (%), by End-user Industry 2025 & 2033
- Figure 23: Europe Iron Recycling Market Revenue (billion), by Country 2025 & 2033
- Figure 24: Europe Iron Recycling Market Volume (K Tons), by Country 2025 & 2033
- Figure 25: Europe Iron Recycling Market Revenue Share (%), by Country 2025 & 2033
- Figure 26: Europe Iron Recycling Market Volume Share (%), by Country 2025 & 2033
- Figure 27: South America Iron Recycling Market Revenue (billion), by End-user Industry 2025 & 2033
- Figure 28: South America Iron Recycling Market Volume (K Tons), by End-user Industry 2025 & 2033
- Figure 29: South America Iron Recycling Market Revenue Share (%), by End-user Industry 2025 & 2033
- Figure 30: South America Iron Recycling Market Volume Share (%), by End-user Industry 2025 & 2033
- Figure 31: South America Iron Recycling Market Revenue (billion), by Country 2025 & 2033
- Figure 32: South America Iron Recycling Market Volume (K Tons), by Country 2025 & 2033
- Figure 33: South America Iron Recycling Market Revenue Share (%), by Country 2025 & 2033
- Figure 34: South America Iron Recycling Market Volume Share (%), by Country 2025 & 2033
- Figure 35: Middle East and Africa Iron Recycling Market Revenue (billion), by End-user Industry 2025 & 2033
- Figure 36: Middle East and Africa Iron Recycling Market Volume (K Tons), by End-user Industry 2025 & 2033
- Figure 37: Middle East and Africa Iron Recycling Market Revenue Share (%), by End-user Industry 2025 & 2033
- Figure 38: Middle East and Africa Iron Recycling Market Volume Share (%), by End-user Industry 2025 & 2033
- Figure 39: Middle East and Africa Iron Recycling Market Revenue (billion), by Country 2025 & 2033
- Figure 40: Middle East and Africa Iron Recycling Market Volume (K Tons), by Country 2025 & 2033
- Figure 41: Middle East and Africa Iron Recycling Market Revenue Share (%), by Country 2025 & 2033
- Figure 42: Middle East and Africa Iron Recycling Market Volume Share (%), by Country 2025 & 2033
List of Tables
- Table 1: Global Iron Recycling Market Revenue billion Forecast, by End-user Industry 2020 & 2033
- Table 2: Global Iron Recycling Market Volume K Tons Forecast, by End-user Industry 2020 & 2033
- Table 3: Global Iron Recycling Market Revenue billion Forecast, by Region 2020 & 2033
- Table 4: Global Iron Recycling Market Volume K Tons Forecast, by Region 2020 & 2033
- Table 5: Global Iron Recycling Market Revenue billion Forecast, by End-user Industry 2020 & 2033
- Table 6: Global Iron Recycling Market Volume K Tons Forecast, by End-user Industry 2020 & 2033
- Table 7: Global Iron Recycling Market Revenue billion Forecast, by Country 2020 & 2033
- Table 8: Global Iron Recycling Market Volume K Tons Forecast, by Country 2020 & 2033
- Table 9: China Iron Recycling Market Revenue (billion) Forecast, by Application 2020 & 2033
- Table 10: China Iron Recycling Market Volume (K Tons) Forecast, by Application 2020 & 2033
- Table 11: India Iron Recycling Market Revenue (billion) Forecast, by Application 2020 & 2033
- Table 12: India Iron Recycling Market Volume (K Tons) Forecast, by Application 2020 & 2033
- Table 13: Japan Iron Recycling Market Revenue (billion) Forecast, by Application 2020 & 2033
- Table 14: Japan Iron Recycling Market Volume (K Tons) Forecast, by Application 2020 & 2033
- Table 15: South Korea Iron Recycling Market Revenue (billion) Forecast, by Application 2020 & 2033
- Table 16: South Korea Iron Recycling Market Volume (K Tons) Forecast, by Application 2020 & 2033
- Table 17: Rest of Asia Pacific Iron Recycling Market Revenue (billion) Forecast, by Application 2020 & 2033
- Table 18: Rest of Asia Pacific Iron Recycling Market Volume (K Tons) Forecast, by Application 2020 & 2033
- Table 19: Global Iron Recycling Market Revenue billion Forecast, by End-user Industry 2020 & 2033
- Table 20: Global Iron Recycling Market Volume K Tons Forecast, by End-user Industry 2020 & 2033
- Table 21: Global Iron Recycling Market Revenue billion Forecast, by Country 2020 & 2033
- Table 22: Global Iron Recycling Market Volume K Tons Forecast, by Country 2020 & 2033
- Table 23: United States Iron Recycling Market Revenue (billion) Forecast, by Application 2020 & 2033
- Table 24: United States Iron Recycling Market Volume (K Tons) Forecast, by Application 2020 & 2033
- Table 25: Canada Iron Recycling Market Revenue (billion) Forecast, by Application 2020 & 2033
- Table 26: Canada Iron Recycling Market Volume (K Tons) Forecast, by Application 2020 & 2033
- Table 27: Mexico Iron Recycling Market Revenue (billion) Forecast, by Application 2020 & 2033
- Table 28: Mexico Iron Recycling Market Volume (K Tons) Forecast, by Application 2020 & 2033
- Table 29: Global Iron Recycling Market Revenue billion Forecast, by End-user Industry 2020 & 2033
- Table 30: Global Iron Recycling Market Volume K Tons Forecast, by End-user Industry 2020 & 2033
- Table 31: Global Iron Recycling Market Revenue billion Forecast, by Country 2020 & 2033
- Table 32: Global Iron Recycling Market Volume K Tons Forecast, by Country 2020 & 2033
- Table 33: Germany Iron Recycling Market Revenue (billion) Forecast, by Application 2020 & 2033
- Table 34: Germany Iron Recycling Market Volume (K Tons) Forecast, by Application 2020 & 2033
- Table 35: United Kingdom Iron Recycling Market Revenue (billion) Forecast, by Application 2020 & 2033
- Table 36: United Kingdom Iron Recycling Market Volume (K Tons) Forecast, by Application 2020 & 2033
- Table 37: Italy Iron Recycling Market Revenue (billion) Forecast, by Application 2020 & 2033
- Table 38: Italy Iron Recycling Market Volume (K Tons) Forecast, by Application 2020 & 2033
- Table 39: France Iron Recycling Market Revenue (billion) Forecast, by Application 2020 & 2033
- Table 40: France Iron Recycling Market Volume (K Tons) Forecast, by Application 2020 & 2033
- Table 41: Rest of Europe Iron Recycling Market Revenue (billion) Forecast, by Application 2020 & 2033
- Table 42: Rest of Europe Iron Recycling Market Volume (K Tons) Forecast, by Application 2020 & 2033
- Table 43: Global Iron Recycling Market Revenue billion Forecast, by End-user Industry 2020 & 2033
- Table 44: Global Iron Recycling Market Volume K Tons Forecast, by End-user Industry 2020 & 2033
- Table 45: Global Iron Recycling Market Revenue billion Forecast, by Country 2020 & 2033
- Table 46: Global Iron Recycling Market Volume K Tons Forecast, by Country 2020 & 2033
- Table 47: Brazil Iron Recycling Market Revenue (billion) Forecast, by Application 2020 & 2033
- Table 48: Brazil Iron Recycling Market Volume (K Tons) Forecast, by Application 2020 & 2033
- Table 49: Argentina Iron Recycling Market Revenue (billion) Forecast, by Application 2020 & 2033
- Table 50: Argentina Iron Recycling Market Volume (K Tons) Forecast, by Application 2020 & 2033
- Table 51: Rest of South America Iron Recycling Market Revenue (billion) Forecast, by Application 2020 & 2033
- Table 52: Rest of South America Iron Recycling Market Volume (K Tons) Forecast, by Application 2020 & 2033
- Table 53: Global Iron Recycling Market Revenue billion Forecast, by End-user Industry 2020 & 2033
- Table 54: Global Iron Recycling Market Volume K Tons Forecast, by End-user Industry 2020 & 2033
- Table 55: Global Iron Recycling Market Revenue billion Forecast, by Country 2020 & 2033
- Table 56: Global Iron Recycling Market Volume K Tons Forecast, by Country 2020 & 2033
- Table 57: Saudi Arabia Iron Recycling Market Revenue (billion) Forecast, by Application 2020 & 2033
- Table 58: Saudi Arabia Iron Recycling Market Volume (K Tons) Forecast, by Application 2020 & 2033
- Table 59: South Africa Iron Recycling Market Revenue (billion) Forecast, by Application 2020 & 2033
- Table 60: South Africa Iron Recycling Market Volume (K Tons) Forecast, by Application 2020 & 2033
- Table 61: Rest of Middle East and Africa Iron Recycling Market Revenue (billion) Forecast, by Application 2020 & 2033
- Table 62: Rest of Middle East and Africa Iron Recycling Market Volume (K Tons) Forecast, by Application 2020 & 2033
Frequently Asked Questions
1. What is the projected Compound Annual Growth Rate (CAGR) of the Iron Recycling Market?
The projected CAGR is approximately 6.8%.
2. Which companies are prominent players in the Iron Recycling Market?
Key companies in the market include Sims Limited, ArcelorMittal, Kimmel Scrap Iron & Metal Co Inc, European Metal Recycling Ltd, CMR Green Technologies Ltd, CMC, OmniSource LLC, Schnitzer Steel Industries Inc, Nucor Corporation, Tata Steel.
3. What are the main segments of the Iron Recycling Market?
The market segments include End-user Industry.
4. Can you provide details about the market size?
The market size is estimated to be USD 551.9 billion as of 2022.
5. What are some drivers contributing to market growth?
Increase in Urbanization and Industrialization; Increasing Awareness regarding the Depletion of Metal Reserves; Other Drivers.
6. What are the notable trends driving market growth?
Building and Construction to Dominate the Market.
7. Are there any restraints impacting market growth?
Unorganised Flow of Waste Metals; Other Restraints.
8. Can you provide examples of recent developments in the market?
December 2022: Nucor Corporation, the largest U.S.-based steel producer announced its partnership with green iron company, Electra. Through this partnership, Nucor Corporation used Electra's iron to further lower the carbon emissions of its industry-leading sustainable steel and steel products.
9. What pricing options are available for accessing the report?
Pricing options include single-user, multi-user, and enterprise licenses priced at USD 4750, USD 5250, and USD 8750 respectively.
10. Is the market size provided in terms of value or volume?
The market size is provided in terms of value, measured in billion and volume, measured in K Tons.
11. Are there any specific market keywords associated with the report?
Yes, the market keyword associated with the report is "Iron Recycling Market," which aids in identifying and referencing the specific market segment covered.
12. How do I determine which pricing option suits my needs best?
The pricing options vary based on user requirements and access needs. Individual users may opt for single-user licenses, while businesses requiring broader access may choose multi-user or enterprise licenses for cost-effective access to the report.
13. Are there any additional resources or data provided in the Iron Recycling Market report?
While the report offers comprehensive insights, it's advisable to review the specific contents or supplementary materials provided to ascertain if additional resources or data are available.
14. How can I stay updated on further developments or reports in the Iron Recycling Market?
To stay informed about further developments, trends, and reports in the Iron Recycling Market, consider subscribing to industry newsletters, following relevant companies and organizations, or regularly checking reputable industry news sources and publications.
Methodology
Step 1 - Identification of Relevant Samples Size from Population Database


Step 2 - Approaches for Defining Global Market Size (Value, Volume* & Price*)

Note*: In applicable scenarios
Step 3 - Data Sources
Primary Research
- Web Analytics
- Survey Reports
- Research Institute
- Latest Research Reports
- Opinion Leaders
Secondary Research
- Annual Reports
- White Paper
- Latest Press Release
- Industry Association
- Paid Database
- Investor Presentations

Step 4 - Data Triangulation
Involves using different sources of information in order to increase the validity of a study
These sources are likely to be stakeholders in a program - participants, other researchers, program staff, other community members, and so on.
Then we put all data in single framework & apply various statistical tools to find out the dynamic on the market.
During the analysis stage, feedback from the stakeholder groups would be compared to determine areas of agreement as well as areas of divergence