

Key Insights
The Middle East and Africa (MEA) Membrane Water Treatment Chemicals market is projected for significant expansion, driven by escalating water scarcity, stringent environmental mandates, and the ongoing development of desalination and wastewater treatment facilities. This dynamic sector is expected to experience a Compound Annual Growth Rate (CAGR) of 6.1%, presenting substantial opportunities for chemical providers. Key growth catalysts include a rising population, increasing industrialization, and agricultural demands that place immense pressure on regional water resources. The widespread adoption of advanced membrane technologies such as Reverse Osmosis (RO) and Ultrafiltration (UF) in desalination plants and industrial processes further propels market growth. Substantial investments in water infrastructure projects, notably in Saudi Arabia and the UAE, are fostering robust demand for essential membrane cleaning and pretreatment chemicals. The market is strategically segmented by chemical type, including pretreatment chemicals, biocides, antiscalants, and cleaning agents, and by end-user industries such as desalination, power generation, food and beverage, and municipal water treatment. The MEA Membrane Water Treatment Chemicals market is estimated to reach approximately $2.4 billion by 2025.
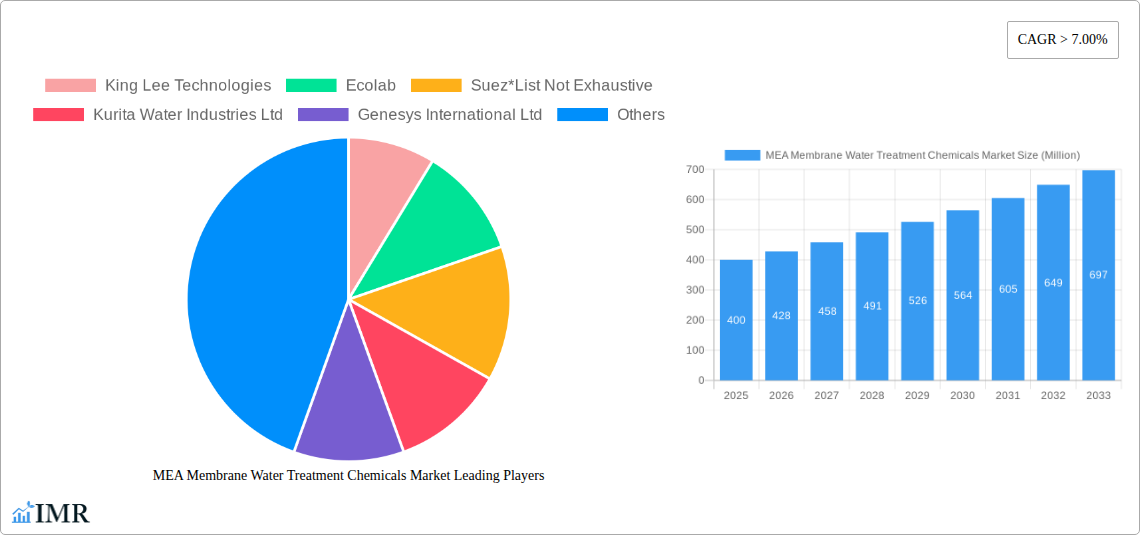
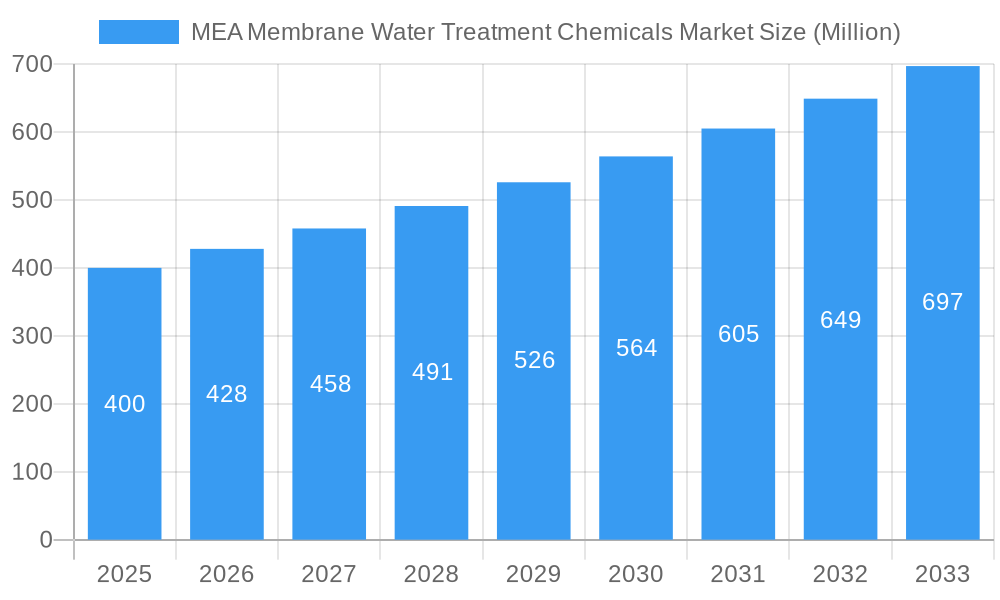
MEA Membrane Water Treatment Chemicals Market Market Size (In Billion)
Market growth within the MEA Membrane Water Treatment Chemicals sector is forecast to maintain its upward trajectory through the projection period (2025-2033). This sustained expansion will be fueled by proactive government initiatives promoting water security, ongoing technological advancements in membrane cleaning and biofouling control, and a heightened emphasis on sustainable water management practices. However, potential challenges such as volatile oil prices impacting project financing, the considerable initial investment for membrane-based systems, and the risk of supply chain disruptions warrant careful consideration. Notwithstanding these hurdles, the long-term market outlook remains highly optimistic, with the region poised for considerable growth as it addresses critical water scarcity issues through the implementation of efficient and sustainable water treatment solutions. Leading market participants are capitalizing on their technological expertise and established distribution channels to meet this escalating demand. Strategic collaborations and mergers and acquisitions are anticipated to play a crucial role in shaping the competitive landscape in the coming years.
MEA Membrane Water Treatment Chemicals Market Company Market Share
MEA Membrane Water Treatment Chemicals Market: A Comprehensive Report (2019-2033)
This comprehensive report provides an in-depth analysis of the MEA Membrane Water Treatment Chemicals market, encompassing market dynamics, growth trends, regional segmentation, product landscape, key players, and future outlook. The study period spans from 2019 to 2033, with 2025 serving as the base and estimated year. This report is crucial for industry professionals, investors, and stakeholders seeking a clear understanding of this rapidly evolving market. The parent market is the broader MEA Water Treatment Chemicals market, while the child market focuses specifically on membrane-based solutions. The market size is projected to reach xx Million by 2033.
MEA Membrane Water Treatment Chemicals Market Dynamics & Structure
This section analyzes the MEA Membrane Water Treatment Chemicals market's structure, focusing on concentration levels, technological advancements, regulatory landscapes, competitive substitutions, end-user demographics, and M&A activity.
The market exhibits a moderately concentrated structure, with key players holding significant market share. However, smaller, specialized companies are also actively innovating.
- Market Concentration: The top 5 players account for approximately xx% of the market share in 2025.
- Technological Innovation: Advancements in membrane technology, such as reverse osmosis and nanofiltration, are driving market growth. Innovation focuses on improving efficiency, reducing energy consumption, and enhancing chemical compatibility.
- Regulatory Framework: Stringent environmental regulations and water quality standards in various MEA countries are creating a favorable environment for membrane water treatment chemicals. These regulations vary by country and impact the choice of chemicals.
- Competitive Product Substitutes: Alternative water treatment methods, such as desalination and wastewater recycling, present some competitive pressure. However, membrane technology often provides a cost-effective and efficient solution, particularly for smaller-scale applications.
- End-User Demographics: The growth of industries like food and beverage processing, desalination, and power generation in the MEA region is driving market demand. Furthermore, increasing urbanization is increasing demand from the municipal sector.
- M&A Trends: The market has witnessed significant M&A activity in recent years, with larger companies acquiring smaller firms to expand their product portfolios and geographical reach. For instance, the 2021 acquisition of Solenis by Platinum Equity for USD 5.25 billion exemplifies this trend. The total value of M&A deals in the sector from 2019-2024 totalled approximately xx Million.
MEA Membrane Water Treatment Chemicals Market Growth Trends & Insights
The MEA Membrane Water Treatment Chemicals market is experiencing robust growth, driven by factors such as increasing water scarcity, rising industrialization, and growing awareness of water quality issues. The market is expected to exhibit a CAGR of xx% during the forecast period (2025-2033), reaching xx Million by 2033. This growth is fueled by several key trends:
- Market Size Evolution: The market has shown significant growth over the historical period (2019-2024). The market size in 2024 was estimated at xx Million.
- Adoption Rates: The adoption rate of membrane-based water treatment technologies is increasing steadily across various end-user industries in the MEA region. This is due to rising awareness of water scarcity and stricter regulatory standards on water quality.
- Technological Disruptions: Innovations in membrane materials, cleaning chemicals, and automation are improving efficiency and reducing costs, driving wider adoption.
- Consumer Behavior Shifts: Increased consumer awareness of water quality and sustainability is further boosting demand for high-quality, environmentally friendly water treatment solutions.
Dominant Regions, Countries, or Segments in MEA Membrane Water Treatment Chemicals Market
The MEA Membrane Water Treatment Chemicals market is characterized by diverse regional and segmental growth patterns. While specific market share data for each region is unavailable for public release at present (due to commercial sensitivity), the following insights are offered:
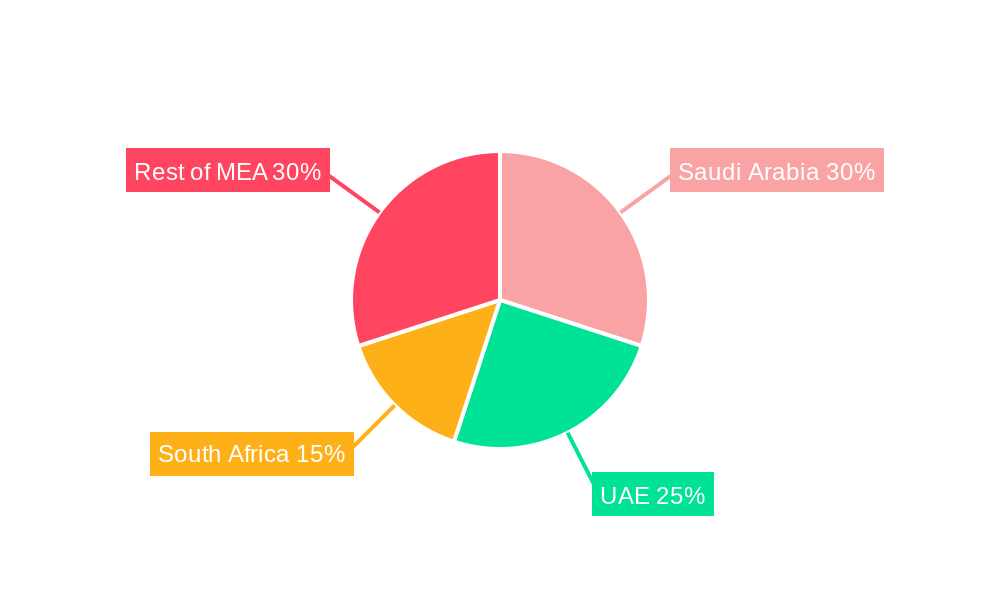
Leading Regions: The Gulf Cooperation Council (GCC) countries and North Africa are expected to dominate the market, driven by substantial investments in infrastructure development and large-scale desalination projects. This is coupled with the high concentration of industries requiring high-quality water, like oil & gas, power generation and industrial manufacturing.
Leading Segments (Chemical Type): Pre-treatment chemicals are currently the largest segment, accounting for approximately xx% of the market in 2025. This is primarily due to its application across various membrane processes to enhance the overall performance of filtration systems. However, Biological controllers are expected to show significant growth during the forecast period, fuelled by increasing concerns over biofouling.
Leading Segments (End-user Industry): The desalination sector is a significant driver of market growth, followed by the power generation and food and beverage processing sectors. This is driven by the high demand for pure water in desalination and stringent quality requirements in the food and beverage industry. The growth in municipal water treatment is also a significant factor.
Key Drivers: Strong economic growth, increasing urbanization, government initiatives promoting water security, and investments in infrastructure development are key drivers of market dominance in these regions/segments.
MEA Membrane Water Treatment Chemicals Market Product Landscape
The MEA Membrane Water Treatment Chemicals market offers a diverse range of products tailored to specific membrane types and applications. These chemicals are formulated to optimize membrane performance, minimize fouling, and ensure water quality. Innovations focus on developing environmentally friendly, high-efficiency chemicals with enhanced cleaning capabilities. Unique selling propositions often include extended membrane lifespan, reduced chemical consumption, and improved water quality.
Key Drivers, Barriers & Challenges in MEA Membrane Water Treatment Chemicals Market
Key Drivers: The increasing scarcity of freshwater resources, stringent environmental regulations, rising industrialization, and the growing demand for high-quality water across various sectors are major drivers of market growth. Government initiatives aimed at improving water infrastructure further accelerate market expansion.
Key Challenges & Restraints: High upfront capital costs associated with membrane installations can pose a barrier for smaller businesses and municipalities. Moreover, fluctuating raw material prices and potential supply chain disruptions can affect profitability. Furthermore, the proper disposal of spent chemicals presents a challenge, leading to concerns about environmental impact and driving a need for more sustainable solutions. Competition from alternative water treatment technologies and the complexity of regulatory compliance can also impact market growth. These factors combined are estimated to impede market growth by approximately xx% over the forecast period.
Emerging Opportunities in MEA Membrane Water Treatment Chemicals Market
Significant opportunities exist in untapped markets within the MEA region, particularly in smaller municipalities and rural areas with limited access to clean water. The development of advanced membrane technologies, such as forward osmosis and membrane distillation, presents opportunities for innovation. Moreover, the growing demand for sustainable and environmentally friendly water treatment solutions is driving the development of bio-based and less toxic chemicals.
Growth Accelerators in the MEA Membrane Water Treatment Chemicals Market Industry
Technological advancements in membrane materials and cleaning agents, strategic partnerships between chemical manufacturers and water treatment companies, and expansion into underserved markets will accelerate long-term growth. Furthermore, government support and investments in water infrastructure development are critical catalysts for the market's sustained expansion.
Notable Milestones in MEA Membrane Water Treatment Chemicals Market Sector
- November 2021: Platinum Equity's acquisition of Solenis significantly impacted the market landscape, expanding Solenis's global presence and product portfolio. This consolidation highlights the trend towards larger players acquiring smaller businesses to broaden their reach and product offerings.
In-Depth MEA Membrane Water Treatment Chemicals Market Outlook
The MEA Membrane Water Treatment Chemicals market is poised for significant growth over the next decade, driven by sustained investments in water infrastructure, technological innovation, and the growing awareness of water scarcity. Strategic partnerships, expansion into new markets, and the development of sustainable products will shape the industry's future. The market's potential is substantial, with numerous opportunities for both established players and new entrants.
MEA Membrane Water Treatment Chemicals Market Segmentation
-
1. Chemical Type
- 1.1. Pre-treatment
- 1.2. Biological Controllers
- 1.3. Other Chemical Types
-
2. End-user Industry
- 2.1. Food and Beverage Processing
- 2.2. Desalination
- 2.3. Healthcare
- 2.4. Municipal
- 2.5. Chemicals
- 2.6. Power
- 2.7. Other End-user Industries
-
3. Geography
- 3.1. Saudi Arabia
- 3.2. South Africa
- 3.3. Qatar
- 3.4. United Arab Emirates
- 3.5. Egypt
- 3.6. Rest of Middle-East and Africa
MEA Membrane Water Treatment Chemicals Market Segmentation By Geography
- 1. Saudi Arabia
- 2. South Africa
- 3. Qatar
- 4. United Arab Emirates
- 5. Egypt
- 6. Rest of Middle East and Africa
MEA Membrane Water Treatment Chemicals Market Regional Market Share
Geographic Coverage of MEA Membrane Water Treatment Chemicals Market
MEA Membrane Water Treatment Chemicals Market REPORT HIGHLIGHTS
| Aspects | Details |
|---|---|
| Study Period | 2020-2034 |
| Base Year | 2025 |
| Estimated Year | 2026 |
| Forecast Period | 2026-2034 |
| Historical Period | 2020-2025 |
| Growth Rate | CAGR of 6.1% from 2020-2034 |
| Segmentation |
|
Table of Contents
- 1. Introduction
- 1.1. Research Scope
- 1.2. Market Segmentation
- 1.3. Research Objective
- 1.4. Definitions and Assumptions
- 2. Executive Summary
- 2.1. Market Snapshot
- 3. Market Dynamics
- 3.1. Market Drivers
- 3.2. Market Restrains
- 3.3. Market Trends
- 3.4. Market Opportunities
- 4. Market Factor Analysis
- 4.1. Porters Five Forces
- 4.1.1. Bargaining Power of Suppliers
- 4.1.2. Bargaining Power of Buyers
- 4.1.3. Threat of New Entrants
- 4.1.4. Threat of Substitutes
- 4.1.5. Competitive Rivalry
- 4.2. PESTEL analysis
- 4.3. BCG Analysis
- 4.3.1. Stars (High Growth, High Market Share)
- 4.3.2. Cash Cows (Low Growth, High Market Share)
- 4.3.3. Question Mark (High Growth, Low Market Share)
- 4.3.4. Dogs (Low Growth, Low Market Share)
- 4.4. Ansoff Matrix Analysis
- 4.5. Supply Chain Analysis
- 4.6. Regulatory Landscape
- 4.7. Current Market Potential and Opportunity Assessment (TAM–SAM–SOM Framework)
- 4.8. IMR Analyst Note
- 4.1. Porters Five Forces
- 5. Market Analysis, Insights and Forecast 2021-2033
- 5.1. Market Analysis, Insights and Forecast - by Chemical Type
- 5.1.1. Pre-treatment
- 5.1.2. Biological Controllers
- 5.1.3. Other Chemical Types
- 5.2. Market Analysis, Insights and Forecast - by End-user Industry
- 5.2.1. Food and Beverage Processing
- 5.2.2. Desalination
- 5.2.3. Healthcare
- 5.2.4. Municipal
- 5.2.5. Chemicals
- 5.2.6. Power
- 5.2.7. Other End-user Industries
- 5.3. Market Analysis, Insights and Forecast - by Geography
- 5.3.1. Saudi Arabia
- 5.3.2. South Africa
- 5.3.3. Qatar
- 5.3.4. United Arab Emirates
- 5.3.5. Egypt
- 5.3.6. Rest of Middle-East and Africa
- 5.4. Market Analysis, Insights and Forecast - by Region
- 5.4.1. Saudi Arabia
- 5.4.2. South Africa
- 5.4.3. Qatar
- 5.4.4. United Arab Emirates
- 5.4.5. Egypt
- 5.4.6. Rest of Middle East and Africa
- 5.1. Market Analysis, Insights and Forecast - by Chemical Type
- 6. Global MEA Membrane Water Treatment Chemicals Market Analysis, Insights and Forecast, 2021-2033
- 6.1. Market Analysis, Insights and Forecast - by Chemical Type
- 6.1.1. Pre-treatment
- 6.1.2. Biological Controllers
- 6.1.3. Other Chemical Types
- 6.2. Market Analysis, Insights and Forecast - by End-user Industry
- 6.2.1. Food and Beverage Processing
- 6.2.2. Desalination
- 6.2.3. Healthcare
- 6.2.4. Municipal
- 6.2.5. Chemicals
- 6.2.6. Power
- 6.2.7. Other End-user Industries
- 6.3. Market Analysis, Insights and Forecast - by Geography
- 6.3.1. Saudi Arabia
- 6.3.2. South Africa
- 6.3.3. Qatar
- 6.3.4. United Arab Emirates
- 6.3.5. Egypt
- 6.3.6. Rest of Middle-East and Africa
- 6.1. Market Analysis, Insights and Forecast - by Chemical Type
- 7. Saudi Arabia MEA Membrane Water Treatment Chemicals Market Analysis, Insights and Forecast, 2020-2032
- 7.1. Market Analysis, Insights and Forecast - by Chemical Type
- 7.1.1. Pre-treatment
- 7.1.2. Biological Controllers
- 7.1.3. Other Chemical Types
- 7.2. Market Analysis, Insights and Forecast - by End-user Industry
- 7.2.1. Food and Beverage Processing
- 7.2.2. Desalination
- 7.2.3. Healthcare
- 7.2.4. Municipal
- 7.2.5. Chemicals
- 7.2.6. Power
- 7.2.7. Other End-user Industries
- 7.3. Market Analysis, Insights and Forecast - by Geography
- 7.3.1. Saudi Arabia
- 7.3.2. South Africa
- 7.3.3. Qatar
- 7.3.4. United Arab Emirates
- 7.3.5. Egypt
- 7.3.6. Rest of Middle-East and Africa
- 7.1. Market Analysis, Insights and Forecast - by Chemical Type
- 8. South Africa MEA Membrane Water Treatment Chemicals Market Analysis, Insights and Forecast, 2020-2032
- 8.1. Market Analysis, Insights and Forecast - by Chemical Type
- 8.1.1. Pre-treatment
- 8.1.2. Biological Controllers
- 8.1.3. Other Chemical Types
- 8.2. Market Analysis, Insights and Forecast - by End-user Industry
- 8.2.1. Food and Beverage Processing
- 8.2.2. Desalination
- 8.2.3. Healthcare
- 8.2.4. Municipal
- 8.2.5. Chemicals
- 8.2.6. Power
- 8.2.7. Other End-user Industries
- 8.3. Market Analysis, Insights and Forecast - by Geography
- 8.3.1. Saudi Arabia
- 8.3.2. South Africa
- 8.3.3. Qatar
- 8.3.4. United Arab Emirates
- 8.3.5. Egypt
- 8.3.6. Rest of Middle-East and Africa
- 8.1. Market Analysis, Insights and Forecast - by Chemical Type
- 9. Qatar MEA Membrane Water Treatment Chemicals Market Analysis, Insights and Forecast, 2020-2032
- 9.1. Market Analysis, Insights and Forecast - by Chemical Type
- 9.1.1. Pre-treatment
- 9.1.2. Biological Controllers
- 9.1.3. Other Chemical Types
- 9.2. Market Analysis, Insights and Forecast - by End-user Industry
- 9.2.1. Food and Beverage Processing
- 9.2.2. Desalination
- 9.2.3. Healthcare
- 9.2.4. Municipal
- 9.2.5. Chemicals
- 9.2.6. Power
- 9.2.7. Other End-user Industries
- 9.3. Market Analysis, Insights and Forecast - by Geography
- 9.3.1. Saudi Arabia
- 9.3.2. South Africa
- 9.3.3. Qatar
- 9.3.4. United Arab Emirates
- 9.3.5. Egypt
- 9.3.6. Rest of Middle-East and Africa
- 9.1. Market Analysis, Insights and Forecast - by Chemical Type
- 10. United Arab Emirates MEA Membrane Water Treatment Chemicals Market Analysis, Insights and Forecast, 2020-2032
- 10.1. Market Analysis, Insights and Forecast - by Chemical Type
- 10.1.1. Pre-treatment
- 10.1.2. Biological Controllers
- 10.1.3. Other Chemical Types
- 10.2. Market Analysis, Insights and Forecast - by End-user Industry
- 10.2.1. Food and Beverage Processing
- 10.2.2. Desalination
- 10.2.3. Healthcare
- 10.2.4. Municipal
- 10.2.5. Chemicals
- 10.2.6. Power
- 10.2.7. Other End-user Industries
- 10.3. Market Analysis, Insights and Forecast - by Geography
- 10.3.1. Saudi Arabia
- 10.3.2. South Africa
- 10.3.3. Qatar
- 10.3.4. United Arab Emirates
- 10.3.5. Egypt
- 10.3.6. Rest of Middle-East and Africa
- 10.1. Market Analysis, Insights and Forecast - by Chemical Type
- 11. Egypt MEA Membrane Water Treatment Chemicals Market Analysis, Insights and Forecast, 2020-2032
- 11.1. Market Analysis, Insights and Forecast - by Chemical Type
- 11.1.1. Pre-treatment
- 11.1.2. Biological Controllers
- 11.1.3. Other Chemical Types
- 11.2. Market Analysis, Insights and Forecast - by End-user Industry
- 11.2.1. Food and Beverage Processing
- 11.2.2. Desalination
- 11.2.3. Healthcare
- 11.2.4. Municipal
- 11.2.5. Chemicals
- 11.2.6. Power
- 11.2.7. Other End-user Industries
- 11.3. Market Analysis, Insights and Forecast - by Geography
- 11.3.1. Saudi Arabia
- 11.3.2. South Africa
- 11.3.3. Qatar
- 11.3.4. United Arab Emirates
- 11.3.5. Egypt
- 11.3.6. Rest of Middle-East and Africa
- 11.1. Market Analysis, Insights and Forecast - by Chemical Type
- 12. Rest of Middle East and Africa MEA Membrane Water Treatment Chemicals Market Analysis, Insights and Forecast, 2020-2032
- 12.1. Market Analysis, Insights and Forecast - by Chemical Type
- 12.1.1. Pre-treatment
- 12.1.2. Biological Controllers
- 12.1.3. Other Chemical Types
- 12.2. Market Analysis, Insights and Forecast - by End-user Industry
- 12.2.1. Food and Beverage Processing
- 12.2.2. Desalination
- 12.2.3. Healthcare
- 12.2.4. Municipal
- 12.2.5. Chemicals
- 12.2.6. Power
- 12.2.7. Other End-user Industries
- 12.3. Market Analysis, Insights and Forecast - by Geography
- 12.3.1. Saudi Arabia
- 12.3.2. South Africa
- 12.3.3. Qatar
- 12.3.4. United Arab Emirates
- 12.3.5. Egypt
- 12.3.6. Rest of Middle-East and Africa
- 12.1. Market Analysis, Insights and Forecast - by Chemical Type
- 13. Competitive Analysis
- 13.1. Company Profiles
- 13.1.1 King Lee Technologies
- 13.1.1.1. Company Overview
- 13.1.1.2. Products
- 13.1.1.3. Company Financials
- 13.1.1.4. SWOT Analysis
- 13.1.2 Ecolab
- 13.1.2.1. Company Overview
- 13.1.2.2. Products
- 13.1.2.3. Company Financials
- 13.1.2.4. SWOT Analysis
- 13.1.3 Suez*List Not Exhaustive
- 13.1.3.1. Company Overview
- 13.1.3.2. Products
- 13.1.3.3. Company Financials
- 13.1.3.4. SWOT Analysis
- 13.1.4 Kurita Water Industries Ltd
- 13.1.4.1. Company Overview
- 13.1.4.2. Products
- 13.1.4.3. Company Financials
- 13.1.4.4. SWOT Analysis
- 13.1.5 Genesys International Ltd
- 13.1.5.1. Company Overview
- 13.1.5.2. Products
- 13.1.5.3. Company Financials
- 13.1.5.4. SWOT Analysis
- 13.1.6 Italmatch Chemicals SpA
- 13.1.6.1. Company Overview
- 13.1.6.2. Products
- 13.1.6.3. Company Financials
- 13.1.6.4. SWOT Analysis
- 13.1.7 Kemira
- 13.1.7.1. Company Overview
- 13.1.7.2. Products
- 13.1.7.3. Company Financials
- 13.1.7.4. SWOT Analysis
- 13.1.8 Dow
- 13.1.8.1. Company Overview
- 13.1.8.2. Products
- 13.1.8.3. Company Financials
- 13.1.8.4. SWOT Analysis
- 13.1.9 Solenis
- 13.1.9.1. Company Overview
- 13.1.9.2. Products
- 13.1.9.3. Company Financials
- 13.1.9.4. SWOT Analysis
- 13.1.10 AES Arabia Ltd
- 13.1.10.1. Company Overview
- 13.1.10.2. Products
- 13.1.10.3. Company Financials
- 13.1.10.4. SWOT Analysis
- 13.1.11 Toray
- 13.1.11.1. Company Overview
- 13.1.11.2. Products
- 13.1.11.3. Company Financials
- 13.1.11.4. SWOT Analysis
- 13.1.1 King Lee Technologies
- 13.2. Market Entropy
- 13.2.1 Company's Key Areas Served
- 13.2.2 Recent Developments
- 13.3. Company Market Share Analysis 2025
- 13.3.1 Top 5 Companies Market Share Analysis
- 13.3.2 Top 3 Companies Market Share Analysis
- 13.4. List of Potential Customers
- 14. Research Methodology
List of Figures
- Figure 1: Global MEA Membrane Water Treatment Chemicals Market Revenue Breakdown (billion, %) by Region 2025 & 2033
- Figure 2: Saudi Arabia MEA Membrane Water Treatment Chemicals Market Revenue (billion), by Chemical Type 2025 & 2033
- Figure 3: Saudi Arabia MEA Membrane Water Treatment Chemicals Market Revenue Share (%), by Chemical Type 2025 & 2033
- Figure 4: Saudi Arabia MEA Membrane Water Treatment Chemicals Market Revenue (billion), by End-user Industry 2025 & 2033
- Figure 5: Saudi Arabia MEA Membrane Water Treatment Chemicals Market Revenue Share (%), by End-user Industry 2025 & 2033
- Figure 6: Saudi Arabia MEA Membrane Water Treatment Chemicals Market Revenue (billion), by Geography 2025 & 2033
- Figure 7: Saudi Arabia MEA Membrane Water Treatment Chemicals Market Revenue Share (%), by Geography 2025 & 2033
- Figure 8: Saudi Arabia MEA Membrane Water Treatment Chemicals Market Revenue (billion), by Country 2025 & 2033
- Figure 9: Saudi Arabia MEA Membrane Water Treatment Chemicals Market Revenue Share (%), by Country 2025 & 2033
- Figure 10: South Africa MEA Membrane Water Treatment Chemicals Market Revenue (billion), by Chemical Type 2025 & 2033
- Figure 11: South Africa MEA Membrane Water Treatment Chemicals Market Revenue Share (%), by Chemical Type 2025 & 2033
- Figure 12: South Africa MEA Membrane Water Treatment Chemicals Market Revenue (billion), by End-user Industry 2025 & 2033
- Figure 13: South Africa MEA Membrane Water Treatment Chemicals Market Revenue Share (%), by End-user Industry 2025 & 2033
- Figure 14: South Africa MEA Membrane Water Treatment Chemicals Market Revenue (billion), by Geography 2025 & 2033
- Figure 15: South Africa MEA Membrane Water Treatment Chemicals Market Revenue Share (%), by Geography 2025 & 2033
- Figure 16: South Africa MEA Membrane Water Treatment Chemicals Market Revenue (billion), by Country 2025 & 2033
- Figure 17: South Africa MEA Membrane Water Treatment Chemicals Market Revenue Share (%), by Country 2025 & 2033
- Figure 18: Qatar MEA Membrane Water Treatment Chemicals Market Revenue (billion), by Chemical Type 2025 & 2033
- Figure 19: Qatar MEA Membrane Water Treatment Chemicals Market Revenue Share (%), by Chemical Type 2025 & 2033
- Figure 20: Qatar MEA Membrane Water Treatment Chemicals Market Revenue (billion), by End-user Industry 2025 & 2033
- Figure 21: Qatar MEA Membrane Water Treatment Chemicals Market Revenue Share (%), by End-user Industry 2025 & 2033
- Figure 22: Qatar MEA Membrane Water Treatment Chemicals Market Revenue (billion), by Geography 2025 & 2033
- Figure 23: Qatar MEA Membrane Water Treatment Chemicals Market Revenue Share (%), by Geography 2025 & 2033
- Figure 24: Qatar MEA Membrane Water Treatment Chemicals Market Revenue (billion), by Country 2025 & 2033
- Figure 25: Qatar MEA Membrane Water Treatment Chemicals Market Revenue Share (%), by Country 2025 & 2033
- Figure 26: United Arab Emirates MEA Membrane Water Treatment Chemicals Market Revenue (billion), by Chemical Type 2025 & 2033
- Figure 27: United Arab Emirates MEA Membrane Water Treatment Chemicals Market Revenue Share (%), by Chemical Type 2025 & 2033
- Figure 28: United Arab Emirates MEA Membrane Water Treatment Chemicals Market Revenue (billion), by End-user Industry 2025 & 2033
- Figure 29: United Arab Emirates MEA Membrane Water Treatment Chemicals Market Revenue Share (%), by End-user Industry 2025 & 2033
- Figure 30: United Arab Emirates MEA Membrane Water Treatment Chemicals Market Revenue (billion), by Geography 2025 & 2033
- Figure 31: United Arab Emirates MEA Membrane Water Treatment Chemicals Market Revenue Share (%), by Geography 2025 & 2033
- Figure 32: United Arab Emirates MEA Membrane Water Treatment Chemicals Market Revenue (billion), by Country 2025 & 2033
- Figure 33: United Arab Emirates MEA Membrane Water Treatment Chemicals Market Revenue Share (%), by Country 2025 & 2033
- Figure 34: Egypt MEA Membrane Water Treatment Chemicals Market Revenue (billion), by Chemical Type 2025 & 2033
- Figure 35: Egypt MEA Membrane Water Treatment Chemicals Market Revenue Share (%), by Chemical Type 2025 & 2033
- Figure 36: Egypt MEA Membrane Water Treatment Chemicals Market Revenue (billion), by End-user Industry 2025 & 2033
- Figure 37: Egypt MEA Membrane Water Treatment Chemicals Market Revenue Share (%), by End-user Industry 2025 & 2033
- Figure 38: Egypt MEA Membrane Water Treatment Chemicals Market Revenue (billion), by Geography 2025 & 2033
- Figure 39: Egypt MEA Membrane Water Treatment Chemicals Market Revenue Share (%), by Geography 2025 & 2033
- Figure 40: Egypt MEA Membrane Water Treatment Chemicals Market Revenue (billion), by Country 2025 & 2033
- Figure 41: Egypt MEA Membrane Water Treatment Chemicals Market Revenue Share (%), by Country 2025 & 2033
- Figure 42: Rest of Middle East and Africa MEA Membrane Water Treatment Chemicals Market Revenue (billion), by Chemical Type 2025 & 2033
- Figure 43: Rest of Middle East and Africa MEA Membrane Water Treatment Chemicals Market Revenue Share (%), by Chemical Type 2025 & 2033
- Figure 44: Rest of Middle East and Africa MEA Membrane Water Treatment Chemicals Market Revenue (billion), by End-user Industry 2025 & 2033
- Figure 45: Rest of Middle East and Africa MEA Membrane Water Treatment Chemicals Market Revenue Share (%), by End-user Industry 2025 & 2033
- Figure 46: Rest of Middle East and Africa MEA Membrane Water Treatment Chemicals Market Revenue (billion), by Geography 2025 & 2033
- Figure 47: Rest of Middle East and Africa MEA Membrane Water Treatment Chemicals Market Revenue Share (%), by Geography 2025 & 2033
- Figure 48: Rest of Middle East and Africa MEA Membrane Water Treatment Chemicals Market Revenue (billion), by Country 2025 & 2033
- Figure 49: Rest of Middle East and Africa MEA Membrane Water Treatment Chemicals Market Revenue Share (%), by Country 2025 & 2033
List of Tables
- Table 1: Global MEA Membrane Water Treatment Chemicals Market Revenue billion Forecast, by Chemical Type 2020 & 2033
- Table 2: Global MEA Membrane Water Treatment Chemicals Market Revenue billion Forecast, by End-user Industry 2020 & 2033
- Table 3: Global MEA Membrane Water Treatment Chemicals Market Revenue billion Forecast, by Geography 2020 & 2033
- Table 4: Global MEA Membrane Water Treatment Chemicals Market Revenue billion Forecast, by Region 2020 & 2033
- Table 5: Global MEA Membrane Water Treatment Chemicals Market Revenue billion Forecast, by Chemical Type 2020 & 2033
- Table 6: Global MEA Membrane Water Treatment Chemicals Market Revenue billion Forecast, by End-user Industry 2020 & 2033
- Table 7: Global MEA Membrane Water Treatment Chemicals Market Revenue billion Forecast, by Geography 2020 & 2033
- Table 8: Global MEA Membrane Water Treatment Chemicals Market Revenue billion Forecast, by Country 2020 & 2033
- Table 9: Global MEA Membrane Water Treatment Chemicals Market Revenue billion Forecast, by Chemical Type 2020 & 2033
- Table 10: Global MEA Membrane Water Treatment Chemicals Market Revenue billion Forecast, by End-user Industry 2020 & 2033
- Table 11: Global MEA Membrane Water Treatment Chemicals Market Revenue billion Forecast, by Geography 2020 & 2033
- Table 12: Global MEA Membrane Water Treatment Chemicals Market Revenue billion Forecast, by Country 2020 & 2033
- Table 13: Global MEA Membrane Water Treatment Chemicals Market Revenue billion Forecast, by Chemical Type 2020 & 2033
- Table 14: Global MEA Membrane Water Treatment Chemicals Market Revenue billion Forecast, by End-user Industry 2020 & 2033
- Table 15: Global MEA Membrane Water Treatment Chemicals Market Revenue billion Forecast, by Geography 2020 & 2033
- Table 16: Global MEA Membrane Water Treatment Chemicals Market Revenue billion Forecast, by Country 2020 & 2033
- Table 17: Global MEA Membrane Water Treatment Chemicals Market Revenue billion Forecast, by Chemical Type 2020 & 2033
- Table 18: Global MEA Membrane Water Treatment Chemicals Market Revenue billion Forecast, by End-user Industry 2020 & 2033
- Table 19: Global MEA Membrane Water Treatment Chemicals Market Revenue billion Forecast, by Geography 2020 & 2033
- Table 20: Global MEA Membrane Water Treatment Chemicals Market Revenue billion Forecast, by Country 2020 & 2033
- Table 21: Global MEA Membrane Water Treatment Chemicals Market Revenue billion Forecast, by Chemical Type 2020 & 2033
- Table 22: Global MEA Membrane Water Treatment Chemicals Market Revenue billion Forecast, by End-user Industry 2020 & 2033
- Table 23: Global MEA Membrane Water Treatment Chemicals Market Revenue billion Forecast, by Geography 2020 & 2033
- Table 24: Global MEA Membrane Water Treatment Chemicals Market Revenue billion Forecast, by Country 2020 & 2033
- Table 25: Global MEA Membrane Water Treatment Chemicals Market Revenue billion Forecast, by Chemical Type 2020 & 2033
- Table 26: Global MEA Membrane Water Treatment Chemicals Market Revenue billion Forecast, by End-user Industry 2020 & 2033
- Table 27: Global MEA Membrane Water Treatment Chemicals Market Revenue billion Forecast, by Geography 2020 & 2033
- Table 28: Global MEA Membrane Water Treatment Chemicals Market Revenue billion Forecast, by Country 2020 & 2033
Frequently Asked Questions
1. What is the projected Compound Annual Growth Rate (CAGR) of the MEA Membrane Water Treatment Chemicals Market?
The projected CAGR is approximately 6.1%.
2. Which companies are prominent players in the MEA Membrane Water Treatment Chemicals Market?
Key companies in the market include King Lee Technologies, Ecolab, Suez*List Not Exhaustive, Kurita Water Industries Ltd, Genesys International Ltd, Italmatch Chemicals SpA, Kemira, Dow, Solenis, AES Arabia Ltd, Toray.
3. What are the main segments of the MEA Membrane Water Treatment Chemicals Market?
The market segments include Chemical Type, End-user Industry, Geography.
4. Can you provide details about the market size?
The market size is estimated to be USD 2.4 billion as of 2022.
5. What are some drivers contributing to market growth?
Growing Demand for Freshwater; Other Drivers.
6. What are the notable trends driving market growth?
The Desalination Industry is Expected to Dominate the Market.
7. Are there any restraints impacting market growth?
High Capital Cost; Other Restraints.
8. Can you provide examples of recent developments in the market?
In November 2021, Platinum Equity bought Solenis, a prominent worldwide manufacturer of specialty chemicals, from Clayton, Dubilier & Rice (CD&R) and BASF in a USD 5.25 billion deal. Solenis has been fully exited by both CD&R and BASF. Solenis has amalgamated with Sigura Water, an existing Platinum Equity portfolio firm, as part of the transaction. Solenis is expanding its portfolio by acquiring Sigura's residential and commercial pool water and spa treatment sectors. As a result of the transaction, Solenis will now have a worldwide presence of 120 countries, 47 production locations, and over 6,000 people.
9. What pricing options are available for accessing the report?
Pricing options include single-user, multi-user, and enterprise licenses priced at USD 4750, USD 5250, and USD 8750 respectively.
10. Is the market size provided in terms of value or volume?
The market size is provided in terms of value, measured in billion.
11. Are there any specific market keywords associated with the report?
Yes, the market keyword associated with the report is "MEA Membrane Water Treatment Chemicals Market," which aids in identifying and referencing the specific market segment covered.
12. How do I determine which pricing option suits my needs best?
The pricing options vary based on user requirements and access needs. Individual users may opt for single-user licenses, while businesses requiring broader access may choose multi-user or enterprise licenses for cost-effective access to the report.
13. Are there any additional resources or data provided in the MEA Membrane Water Treatment Chemicals Market report?
While the report offers comprehensive insights, it's advisable to review the specific contents or supplementary materials provided to ascertain if additional resources or data are available.
14. How can I stay updated on further developments or reports in the MEA Membrane Water Treatment Chemicals Market?
To stay informed about further developments, trends, and reports in the MEA Membrane Water Treatment Chemicals Market, consider subscribing to industry newsletters, following relevant companies and organizations, or regularly checking reputable industry news sources and publications.
Methodology
Step 1 - Identification of Relevant Samples Size from Population Database


Step 2 - Approaches for Defining Global Market Size (Value, Volume* & Price*)

Note*: In applicable scenarios
Step 3 - Data Sources
Primary Research
- Web Analytics
- Survey Reports
- Research Institute
- Latest Research Reports
- Opinion Leaders
Secondary Research
- Annual Reports
- White Paper
- Latest Press Release
- Industry Association
- Paid Database
- Investor Presentations

Step 4 - Data Triangulation
Involves using different sources of information in order to increase the validity of a study
These sources are likely to be stakeholders in a program - participants, other researchers, program staff, other community members, and so on.
Then we put all data in single framework & apply various statistical tools to find out the dynamic on the market.
During the analysis stage, feedback from the stakeholder groups would be compared to determine areas of agreement as well as areas of divergence