

Key Insights
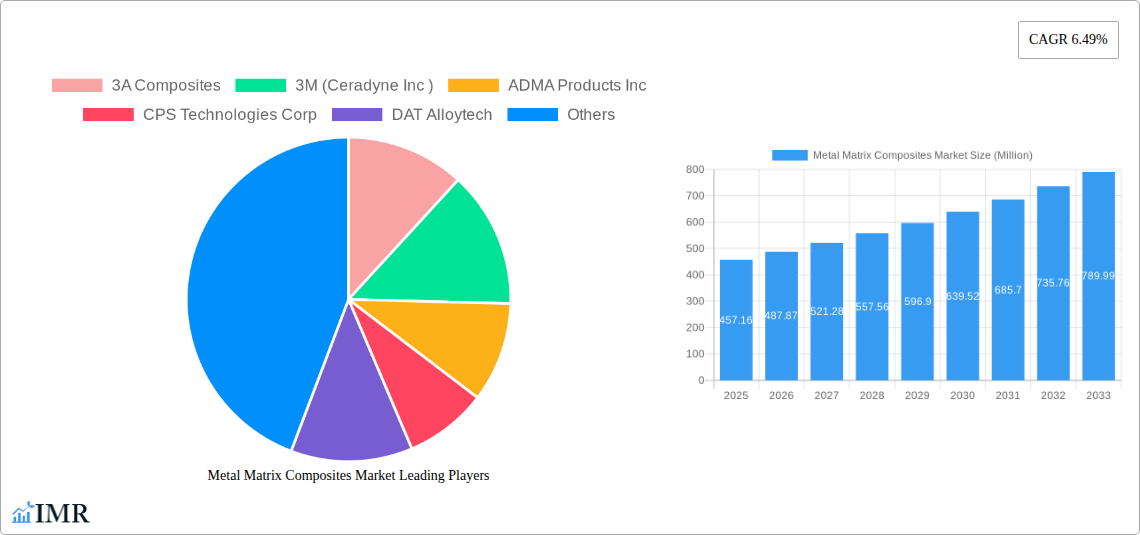
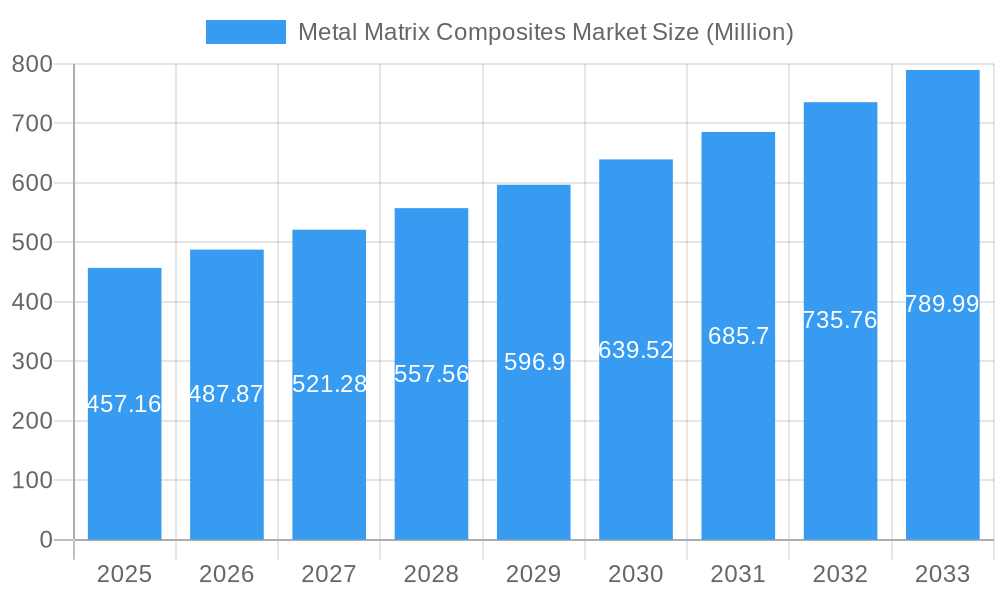
The Metal Matrix Composites (MMC) market is poised for robust growth, exhibiting a Compound Annual Growth Rate (CAGR) of 6.49% from 2019 to 2033. The market size in 2025 is estimated at $457.16 million. This expansion is driven by several key factors. Increasing demand for lightweight yet high-strength materials across diverse industries like aerospace, automotive, and electronics is a significant catalyst. Advancements in manufacturing techniques, leading to improved performance and cost-effectiveness of MMCs, further fuel market growth. The adoption of MMCs is also driven by stringent regulatory requirements for fuel efficiency and emission reduction in the automotive and aerospace sectors. Furthermore, the rising need for durable and high-performance components in demanding applications is contributing to the market's expansion. The market is segmented by material type (aluminum, titanium, magnesium, etc.), application (aerospace, automotive, electronics, etc.), and region. While precise segmental breakdown is unavailable, it's reasonable to anticipate that aerospace and automotive sectors currently dominate, given their historical dependence on lightweight, high-performance materials.
Metal Matrix Composites Market Market Size (In Million)
Competition within the MMC market is intense, with major players including 3A Composites, 3M (Ceradyne Inc), ADMA Products Inc, and others continuously innovating to enhance product offerings and expand their market share. Future market growth will be influenced by ongoing research and development efforts focused on enhancing material properties, reducing production costs, and exploring new applications. The potential integration of MMCs in emerging technologies like electric vehicles and renewable energy infrastructure could significantly impact market trajectory. However, challenges remain, including the relatively high cost of manufacturing MMCs compared to traditional materials and potential supply chain constraints related to raw materials. Overcoming these limitations through continued technological advancements and strategic partnerships will be crucial for sustained market growth.
Metal Matrix Composites Market Company Market Share
Metal Matrix Composites Market: A Comprehensive Analysis (2019-2033)
This in-depth report provides a comprehensive analysis of the Metal Matrix Composites (MMC) market, encompassing market dynamics, growth trends, regional segmentation, product landscape, key players, and future outlook. The study period covers 2019-2033, with 2025 serving as the base and estimated year. This report is essential for industry professionals, investors, and researchers seeking a detailed understanding of this dynamic sector, including its parent market (advanced materials) and child markets (aerospace, automotive, etc.). The total market size is projected to reach xx Million by 2033.
Metal Matrix Composites Market Dynamics & Structure
The Metal Matrix Composites market is characterized by moderate concentration, with several key players dominating significant market share. Technological innovation, particularly in materials science and manufacturing processes, is a primary growth driver. Stringent regulatory frameworks regarding material safety and performance influence market dynamics. Competitive substitutes, such as polymer composites and advanced ceramics, pose challenges. The end-user demographics are diverse, spanning aerospace, automotive, energy, and electronics sectors. Mergers and acquisitions (M&A) activity is relatively frequent, reflecting industry consolidation and expansion efforts.
- Market Concentration: Moderately concentrated, with top 5 players holding approximately xx% market share in 2025.
- Technological Innovation: Focus on enhanced strength-to-weight ratios, improved thermal conductivity, and cost-effective manufacturing processes.
- Regulatory Frameworks: Compliance with safety and performance standards (e.g., aerospace certifications) crucial for market entry.
- Competitive Substitutes: Polymer composites and advanced ceramics offer competing material properties, impacting MMC market share.
- End-User Demographics: Aerospace, automotive, energy, electronics, and defense industries are major consumers.
- M&A Trends: Increased M&A activity indicates industry consolidation and expansion into new markets (e.g., Plansee Group’s acquisition of Mi-Tech Tungsten Metals). An estimated xx M&A deals occurred between 2019 and 2024.
Metal Matrix Composites Market Growth Trends & Insights
The Metal Matrix Composites market experienced significant growth during the historical period (2019-2024), driven by increasing demand from key industries like aerospace and automotive. The market size expanded from xx Million in 2019 to xx Million in 2024, exhibiting a CAGR of xx%. Technological advancements, including the development of novel MMC materials with superior properties, have fueled adoption rates. Shifting consumer preferences towards lightweight and high-performance materials further propel market growth. Disruptive technologies, such as additive manufacturing (3D printing) for MMCs, are expected to significantly influence market dynamics in the forecast period (2025-2033). Market penetration in emerging economies is projected to increase significantly, driven by infrastructure development and industrialization. The market is expected to reach xx Million by 2033, with a CAGR of xx% during the forecast period.
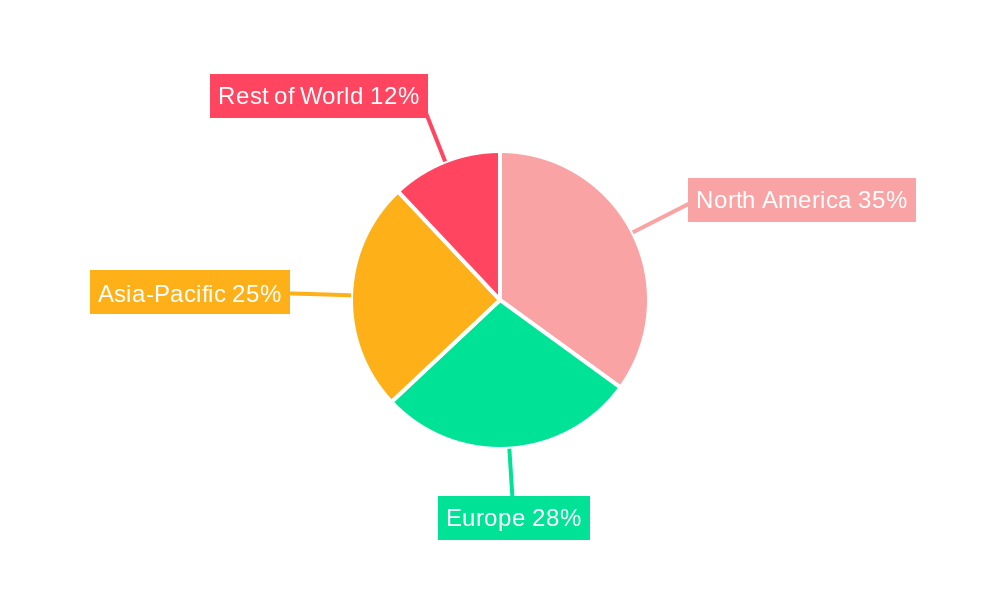
Dominant Regions, Countries, or Segments in Metal Matrix Composites Market
North America currently holds the leading position in the Metal Matrix Composites market, driven by strong aerospace and defense industries. Europe follows closely, fueled by automotive and renewable energy sectors. The Asia-Pacific region exhibits high growth potential due to increasing industrialization and infrastructure development.
- North America: Dominance driven by robust aerospace and defense industries, substantial R&D investment, and established manufacturing capabilities. Market share is approximately xx% in 2025.
- Europe: Significant automotive and renewable energy sectors contribute to market growth. Market share is approximately xx% in 2025.
- Asia-Pacific: High growth potential due to industrialization, infrastructure development, and increasing demand from various end-use sectors. Market share is approximately xx% in 2025.
- Key Drivers: Favorable government policies, technological advancements, and increasing investments in infrastructure development.
Metal Matrix Composites Market Product Landscape
Metal Matrix Composites encompass a diverse range of materials, including aluminum matrix composites (AMCs), titanium matrix composites (TMCs), and others. Product innovations focus on enhancing mechanical properties, such as tensile strength, fatigue resistance, and creep strength. Applications span diverse sectors, including aerospace (aircraft components), automotive (lightweight parts), and energy (high-temperature applications). Unique selling propositions include superior strength-to-weight ratios, high thermal conductivity, and improved corrosion resistance compared to traditional materials. Technological advancements in manufacturing processes, such as powder metallurgy and liquid metal infiltration, enable production of high-quality, complex-shaped MMC parts.
Key Drivers, Barriers & Challenges in Metal Matrix Composites Market
Key Drivers:
- Increasing demand from aerospace and automotive industries for lightweight and high-performance materials.
- Advancements in manufacturing technologies enabling cost-effective production of complex MMC parts.
- Government initiatives promoting the adoption of sustainable and high-performance materials.
Challenges & Restraints:
- High production costs compared to traditional materials.
- Complex manufacturing processes leading to longer lead times.
- Potential supply chain disruptions impacting raw material availability. This is projected to impact production by xx% by 2030.
Emerging Opportunities in Metal Matrix Composites Market
- Untapped markets in developing economies with growing infrastructure development.
- Innovative applications in areas such as biomedical implants and advanced electronics.
- Growing demand for sustainable and recyclable composite materials.
Growth Accelerators in the Metal Matrix Composites Market Industry
Technological breakthroughs in materials science and manufacturing processes, such as additive manufacturing, will drive long-term market growth. Strategic partnerships and collaborations between material suppliers and end-users will accelerate innovation and market adoption. Expanding into new applications and emerging markets will create further growth opportunities.
Key Players Shaping the Metal Matrix Composites Market Market
- 3A Composites
- 3M (Ceradyne Inc)
- ADMA Products Inc
- CPS Technologies Corp
- DAT Alloytech
- Denka Company Limited
- GKN Sinter Metals Engineering GmbH
- Hitachi Metals Ltd
- Materion Corporation
- MTC Powder Solutions AB
- Plansee Group
- Sumitomo Electric Industries Ltd
- Thermal Transfer Composites LLC
- TISICS Ltd
- *List Not Exhaustive
Notable Milestones in Metal Matrix Composites Market Sector
- January 2022: Plansee Group acquired Mi-Tech Tungsten Metals, expanding its market position for tungsten products in North America.
- March 2021: Alvant and 3M formed a strategic partnership to advance metal matrix composite technology.
In-Depth Metal Matrix Composites Market Market Outlook
The Metal Matrix Composites market is poised for significant growth in the coming years, driven by continued technological advancements, increasing demand from key industries, and expansion into new applications. Strategic investments in R&D, along with collaborative efforts between industry players, will further propel market growth. The market's future potential is substantial, presenting significant opportunities for both established players and new entrants.
Metal Matrix Composites Market Segmentation
-
1. Type
- 1.1. Nickel
- 1.2. Aluminium
- 1.3. Refractory
- 1.4. Other Types
-
2. Fillers
- 2.1. Silicon Carbide
- 2.2. Aluminum Oxide
- 2.3. Titanium Carbide
- 2.4. Other Fillers
-
3. End-user Industry
- 3.1. Automotive and Locomotive
- 3.2. Electrical and Electronics
- 3.3. Aerospace and Defense
- 3.4. Industrial
- 3.5. Other End-user Industries
Metal Matrix Composites Market Segmentation By Geography
-
1. Asia Pacific
- 1.1. China
- 1.2. India
- 1.3. Japan
- 1.4. South Korea
- 1.5. Rest of Asia Pacific
-
2. North America
- 2.1. United States
- 2.2. Canada
- 2.3. Mexico
-
3. Europe
- 3.1. Germany
- 3.2. United Kingdom
- 3.3. Italy
- 3.4. France
- 3.5. Spain
- 3.6. Rest of Europe
-
4. South America
- 4.1. Brazil
- 4.2. Argentina
- 4.3. Rest of South America
-
5. Middle East and Africa
- 5.1. Saudi Arabia
- 5.2. South Africa
- 5.3. Rest of Middle East and Africa
Metal Matrix Composites Market Regional Market Share
Geographic Coverage of Metal Matrix Composites Market
Metal Matrix Composites Market REPORT HIGHLIGHTS
| Aspects | Details |
|---|---|
| Study Period | 2020-2034 |
| Base Year | 2025 |
| Estimated Year | 2026 |
| Forecast Period | 2026-2034 |
| Historical Period | 2020-2025 |
| Growth Rate | CAGR of 6.49% from 2020-2034 |
| Segmentation |
|
Table of Contents
- 1. Introduction
- 1.1. Research Scope
- 1.2. Market Segmentation
- 1.3. Research Objective
- 1.4. Definitions and Assumptions
- 2. Executive Summary
- 2.1. Market Snapshot
- 3. Market Dynamics
- 3.1. Market Drivers
- 3.2. Market Restrains
- 3.3. Market Trends
- 3.4. Market Opportunities
- 4. Market Factor Analysis
- 4.1. Porters Five Forces
- 4.1.1. Bargaining Power of Suppliers
- 4.1.2. Bargaining Power of Buyers
- 4.1.3. Threat of New Entrants
- 4.1.4. Threat of Substitutes
- 4.1.5. Competitive Rivalry
- 4.2. PESTEL analysis
- 4.3. BCG Analysis
- 4.3.1. Stars (High Growth, High Market Share)
- 4.3.2. Cash Cows (Low Growth, High Market Share)
- 4.3.3. Question Mark (High Growth, Low Market Share)
- 4.3.4. Dogs (Low Growth, Low Market Share)
- 4.4. Ansoff Matrix Analysis
- 4.5. Supply Chain Analysis
- 4.6. Regulatory Landscape
- 4.7. Current Market Potential and Opportunity Assessment (TAM–SAM–SOM Framework)
- 4.8. IMR Analyst Note
- 4.1. Porters Five Forces
- 5. Market Analysis, Insights and Forecast 2021-2033
- 5.1. Market Analysis, Insights and Forecast - by Type
- 5.1.1. Nickel
- 5.1.2. Aluminium
- 5.1.3. Refractory
- 5.1.4. Other Types
- 5.2. Market Analysis, Insights and Forecast - by Fillers
- 5.2.1. Silicon Carbide
- 5.2.2. Aluminum Oxide
- 5.2.3. Titanium Carbide
- 5.2.4. Other Fillers
- 5.3. Market Analysis, Insights and Forecast - by End-user Industry
- 5.3.1. Automotive and Locomotive
- 5.3.2. Electrical and Electronics
- 5.3.3. Aerospace and Defense
- 5.3.4. Industrial
- 5.3.5. Other End-user Industries
- 5.4. Market Analysis, Insights and Forecast - by Region
- 5.4.1. Asia Pacific
- 5.4.2. North America
- 5.4.3. Europe
- 5.4.4. South America
- 5.4.5. Middle East and Africa
- 5.1. Market Analysis, Insights and Forecast - by Type
- 6. Global Metal Matrix Composites Market Analysis, Insights and Forecast, 2021-2033
- 6.1. Market Analysis, Insights and Forecast - by Type
- 6.1.1. Nickel
- 6.1.2. Aluminium
- 6.1.3. Refractory
- 6.1.4. Other Types
- 6.2. Market Analysis, Insights and Forecast - by Fillers
- 6.2.1. Silicon Carbide
- 6.2.2. Aluminum Oxide
- 6.2.3. Titanium Carbide
- 6.2.4. Other Fillers
- 6.3. Market Analysis, Insights and Forecast - by End-user Industry
- 6.3.1. Automotive and Locomotive
- 6.3.2. Electrical and Electronics
- 6.3.3. Aerospace and Defense
- 6.3.4. Industrial
- 6.3.5. Other End-user Industries
- 6.1. Market Analysis, Insights and Forecast - by Type
- 7. Asia Pacific Metal Matrix Composites Market Analysis, Insights and Forecast, 2020-2032
- 7.1. Market Analysis, Insights and Forecast - by Type
- 7.1.1. Nickel
- 7.1.2. Aluminium
- 7.1.3. Refractory
- 7.1.4. Other Types
- 7.2. Market Analysis, Insights and Forecast - by Fillers
- 7.2.1. Silicon Carbide
- 7.2.2. Aluminum Oxide
- 7.2.3. Titanium Carbide
- 7.2.4. Other Fillers
- 7.3. Market Analysis, Insights and Forecast - by End-user Industry
- 7.3.1. Automotive and Locomotive
- 7.3.2. Electrical and Electronics
- 7.3.3. Aerospace and Defense
- 7.3.4. Industrial
- 7.3.5. Other End-user Industries
- 7.1. Market Analysis, Insights and Forecast - by Type
- 8. North America Metal Matrix Composites Market Analysis, Insights and Forecast, 2020-2032
- 8.1. Market Analysis, Insights and Forecast - by Type
- 8.1.1. Nickel
- 8.1.2. Aluminium
- 8.1.3. Refractory
- 8.1.4. Other Types
- 8.2. Market Analysis, Insights and Forecast - by Fillers
- 8.2.1. Silicon Carbide
- 8.2.2. Aluminum Oxide
- 8.2.3. Titanium Carbide
- 8.2.4. Other Fillers
- 8.3. Market Analysis, Insights and Forecast - by End-user Industry
- 8.3.1. Automotive and Locomotive
- 8.3.2. Electrical and Electronics
- 8.3.3. Aerospace and Defense
- 8.3.4. Industrial
- 8.3.5. Other End-user Industries
- 8.1. Market Analysis, Insights and Forecast - by Type
- 9. Europe Metal Matrix Composites Market Analysis, Insights and Forecast, 2020-2032
- 9.1. Market Analysis, Insights and Forecast - by Type
- 9.1.1. Nickel
- 9.1.2. Aluminium
- 9.1.3. Refractory
- 9.1.4. Other Types
- 9.2. Market Analysis, Insights and Forecast - by Fillers
- 9.2.1. Silicon Carbide
- 9.2.2. Aluminum Oxide
- 9.2.3. Titanium Carbide
- 9.2.4. Other Fillers
- 9.3. Market Analysis, Insights and Forecast - by End-user Industry
- 9.3.1. Automotive and Locomotive
- 9.3.2. Electrical and Electronics
- 9.3.3. Aerospace and Defense
- 9.3.4. Industrial
- 9.3.5. Other End-user Industries
- 9.1. Market Analysis, Insights and Forecast - by Type
- 10. South America Metal Matrix Composites Market Analysis, Insights and Forecast, 2020-2032
- 10.1. Market Analysis, Insights and Forecast - by Type
- 10.1.1. Nickel
- 10.1.2. Aluminium
- 10.1.3. Refractory
- 10.1.4. Other Types
- 10.2. Market Analysis, Insights and Forecast - by Fillers
- 10.2.1. Silicon Carbide
- 10.2.2. Aluminum Oxide
- 10.2.3. Titanium Carbide
- 10.2.4. Other Fillers
- 10.3. Market Analysis, Insights and Forecast - by End-user Industry
- 10.3.1. Automotive and Locomotive
- 10.3.2. Electrical and Electronics
- 10.3.3. Aerospace and Defense
- 10.3.4. Industrial
- 10.3.5. Other End-user Industries
- 10.1. Market Analysis, Insights and Forecast - by Type
- 11. Middle East and Africa Metal Matrix Composites Market Analysis, Insights and Forecast, 2020-2032
- 11.1. Market Analysis, Insights and Forecast - by Type
- 11.1.1. Nickel
- 11.1.2. Aluminium
- 11.1.3. Refractory
- 11.1.4. Other Types
- 11.2. Market Analysis, Insights and Forecast - by Fillers
- 11.2.1. Silicon Carbide
- 11.2.2. Aluminum Oxide
- 11.2.3. Titanium Carbide
- 11.2.4. Other Fillers
- 11.3. Market Analysis, Insights and Forecast - by End-user Industry
- 11.3.1. Automotive and Locomotive
- 11.3.2. Electrical and Electronics
- 11.3.3. Aerospace and Defense
- 11.3.4. Industrial
- 11.3.5. Other End-user Industries
- 11.1. Market Analysis, Insights and Forecast - by Type
- 12. Competitive Analysis
- 12.1. Company Profiles
- 12.1.1 3A Composites
- 12.1.1.1. Company Overview
- 12.1.1.2. Products
- 12.1.1.3. Company Financials
- 12.1.1.4. SWOT Analysis
- 12.1.2 3M (Ceradyne Inc )
- 12.1.2.1. Company Overview
- 12.1.2.2. Products
- 12.1.2.3. Company Financials
- 12.1.2.4. SWOT Analysis
- 12.1.3 ADMA Products Inc
- 12.1.3.1. Company Overview
- 12.1.3.2. Products
- 12.1.3.3. Company Financials
- 12.1.3.4. SWOT Analysis
- 12.1.4 CPS Technologies Corp
- 12.1.4.1. Company Overview
- 12.1.4.2. Products
- 12.1.4.3. Company Financials
- 12.1.4.4. SWOT Analysis
- 12.1.5 DAT Alloytech
- 12.1.5.1. Company Overview
- 12.1.5.2. Products
- 12.1.5.3. Company Financials
- 12.1.5.4. SWOT Analysis
- 12.1.6 Denka Company Limited
- 12.1.6.1. Company Overview
- 12.1.6.2. Products
- 12.1.6.3. Company Financials
- 12.1.6.4. SWOT Analysis
- 12.1.7 GKN Sinter Metals Engineering GmbH
- 12.1.7.1. Company Overview
- 12.1.7.2. Products
- 12.1.7.3. Company Financials
- 12.1.7.4. SWOT Analysis
- 12.1.8 Hitachi Metals Ltd
- 12.1.8.1. Company Overview
- 12.1.8.2. Products
- 12.1.8.3. Company Financials
- 12.1.8.4. SWOT Analysis
- 12.1.9 Materion Corporation
- 12.1.9.1. Company Overview
- 12.1.9.2. Products
- 12.1.9.3. Company Financials
- 12.1.9.4. SWOT Analysis
- 12.1.10 MTC Powder Solutions AB
- 12.1.10.1. Company Overview
- 12.1.10.2. Products
- 12.1.10.3. Company Financials
- 12.1.10.4. SWOT Analysis
- 12.1.11 Plansee Group
- 12.1.11.1. Company Overview
- 12.1.11.2. Products
- 12.1.11.3. Company Financials
- 12.1.11.4. SWOT Analysis
- 12.1.12 Sumitomo Electric Industries Ltd
- 12.1.12.1. Company Overview
- 12.1.12.2. Products
- 12.1.12.3. Company Financials
- 12.1.12.4. SWOT Analysis
- 12.1.13 Thermal Transfer Composites LLC
- 12.1.13.1. Company Overview
- 12.1.13.2. Products
- 12.1.13.3. Company Financials
- 12.1.13.4. SWOT Analysis
- 12.1.14 TISICS Ltd*List Not Exhaustive
- 12.1.14.1. Company Overview
- 12.1.14.2. Products
- 12.1.14.3. Company Financials
- 12.1.14.4. SWOT Analysis
- 12.1.1 3A Composites
- 12.2. Market Entropy
- 12.2.1 Company's Key Areas Served
- 12.2.2 Recent Developments
- 12.3. Company Market Share Analysis 2025
- 12.3.1 Top 5 Companies Market Share Analysis
- 12.3.2 Top 3 Companies Market Share Analysis
- 12.4. List of Potential Customers
- 13. Research Methodology
List of Figures
- Figure 1: Global Metal Matrix Composites Market Revenue Breakdown (Million, %) by Region 2025 & 2033
- Figure 2: Global Metal Matrix Composites Market Volume Breakdown (Million, %) by Region 2025 & 2033
- Figure 3: Asia Pacific Metal Matrix Composites Market Revenue (Million), by Type 2025 & 2033
- Figure 4: Asia Pacific Metal Matrix Composites Market Volume (Million), by Type 2025 & 2033
- Figure 5: Asia Pacific Metal Matrix Composites Market Revenue Share (%), by Type 2025 & 2033
- Figure 6: Asia Pacific Metal Matrix Composites Market Volume Share (%), by Type 2025 & 2033
- Figure 7: Asia Pacific Metal Matrix Composites Market Revenue (Million), by Fillers 2025 & 2033
- Figure 8: Asia Pacific Metal Matrix Composites Market Volume (Million), by Fillers 2025 & 2033
- Figure 9: Asia Pacific Metal Matrix Composites Market Revenue Share (%), by Fillers 2025 & 2033
- Figure 10: Asia Pacific Metal Matrix Composites Market Volume Share (%), by Fillers 2025 & 2033
- Figure 11: Asia Pacific Metal Matrix Composites Market Revenue (Million), by End-user Industry 2025 & 2033
- Figure 12: Asia Pacific Metal Matrix Composites Market Volume (Million), by End-user Industry 2025 & 2033
- Figure 13: Asia Pacific Metal Matrix Composites Market Revenue Share (%), by End-user Industry 2025 & 2033
- Figure 14: Asia Pacific Metal Matrix Composites Market Volume Share (%), by End-user Industry 2025 & 2033
- Figure 15: Asia Pacific Metal Matrix Composites Market Revenue (Million), by Country 2025 & 2033
- Figure 16: Asia Pacific Metal Matrix Composites Market Volume (Million), by Country 2025 & 2033
- Figure 17: Asia Pacific Metal Matrix Composites Market Revenue Share (%), by Country 2025 & 2033
- Figure 18: Asia Pacific Metal Matrix Composites Market Volume Share (%), by Country 2025 & 2033
- Figure 19: North America Metal Matrix Composites Market Revenue (Million), by Type 2025 & 2033
- Figure 20: North America Metal Matrix Composites Market Volume (Million), by Type 2025 & 2033
- Figure 21: North America Metal Matrix Composites Market Revenue Share (%), by Type 2025 & 2033
- Figure 22: North America Metal Matrix Composites Market Volume Share (%), by Type 2025 & 2033
- Figure 23: North America Metal Matrix Composites Market Revenue (Million), by Fillers 2025 & 2033
- Figure 24: North America Metal Matrix Composites Market Volume (Million), by Fillers 2025 & 2033
- Figure 25: North America Metal Matrix Composites Market Revenue Share (%), by Fillers 2025 & 2033
- Figure 26: North America Metal Matrix Composites Market Volume Share (%), by Fillers 2025 & 2033
- Figure 27: North America Metal Matrix Composites Market Revenue (Million), by End-user Industry 2025 & 2033
- Figure 28: North America Metal Matrix Composites Market Volume (Million), by End-user Industry 2025 & 2033
- Figure 29: North America Metal Matrix Composites Market Revenue Share (%), by End-user Industry 2025 & 2033
- Figure 30: North America Metal Matrix Composites Market Volume Share (%), by End-user Industry 2025 & 2033
- Figure 31: North America Metal Matrix Composites Market Revenue (Million), by Country 2025 & 2033
- Figure 32: North America Metal Matrix Composites Market Volume (Million), by Country 2025 & 2033
- Figure 33: North America Metal Matrix Composites Market Revenue Share (%), by Country 2025 & 2033
- Figure 34: North America Metal Matrix Composites Market Volume Share (%), by Country 2025 & 2033
- Figure 35: Europe Metal Matrix Composites Market Revenue (Million), by Type 2025 & 2033
- Figure 36: Europe Metal Matrix Composites Market Volume (Million), by Type 2025 & 2033
- Figure 37: Europe Metal Matrix Composites Market Revenue Share (%), by Type 2025 & 2033
- Figure 38: Europe Metal Matrix Composites Market Volume Share (%), by Type 2025 & 2033
- Figure 39: Europe Metal Matrix Composites Market Revenue (Million), by Fillers 2025 & 2033
- Figure 40: Europe Metal Matrix Composites Market Volume (Million), by Fillers 2025 & 2033
- Figure 41: Europe Metal Matrix Composites Market Revenue Share (%), by Fillers 2025 & 2033
- Figure 42: Europe Metal Matrix Composites Market Volume Share (%), by Fillers 2025 & 2033
- Figure 43: Europe Metal Matrix Composites Market Revenue (Million), by End-user Industry 2025 & 2033
- Figure 44: Europe Metal Matrix Composites Market Volume (Million), by End-user Industry 2025 & 2033
- Figure 45: Europe Metal Matrix Composites Market Revenue Share (%), by End-user Industry 2025 & 2033
- Figure 46: Europe Metal Matrix Composites Market Volume Share (%), by End-user Industry 2025 & 2033
- Figure 47: Europe Metal Matrix Composites Market Revenue (Million), by Country 2025 & 2033
- Figure 48: Europe Metal Matrix Composites Market Volume (Million), by Country 2025 & 2033
- Figure 49: Europe Metal Matrix Composites Market Revenue Share (%), by Country 2025 & 2033
- Figure 50: Europe Metal Matrix Composites Market Volume Share (%), by Country 2025 & 2033
- Figure 51: South America Metal Matrix Composites Market Revenue (Million), by Type 2025 & 2033
- Figure 52: South America Metal Matrix Composites Market Volume (Million), by Type 2025 & 2033
- Figure 53: South America Metal Matrix Composites Market Revenue Share (%), by Type 2025 & 2033
- Figure 54: South America Metal Matrix Composites Market Volume Share (%), by Type 2025 & 2033
- Figure 55: South America Metal Matrix Composites Market Revenue (Million), by Fillers 2025 & 2033
- Figure 56: South America Metal Matrix Composites Market Volume (Million), by Fillers 2025 & 2033
- Figure 57: South America Metal Matrix Composites Market Revenue Share (%), by Fillers 2025 & 2033
- Figure 58: South America Metal Matrix Composites Market Volume Share (%), by Fillers 2025 & 2033
- Figure 59: South America Metal Matrix Composites Market Revenue (Million), by End-user Industry 2025 & 2033
- Figure 60: South America Metal Matrix Composites Market Volume (Million), by End-user Industry 2025 & 2033
- Figure 61: South America Metal Matrix Composites Market Revenue Share (%), by End-user Industry 2025 & 2033
- Figure 62: South America Metal Matrix Composites Market Volume Share (%), by End-user Industry 2025 & 2033
- Figure 63: South America Metal Matrix Composites Market Revenue (Million), by Country 2025 & 2033
- Figure 64: South America Metal Matrix Composites Market Volume (Million), by Country 2025 & 2033
- Figure 65: South America Metal Matrix Composites Market Revenue Share (%), by Country 2025 & 2033
- Figure 66: South America Metal Matrix Composites Market Volume Share (%), by Country 2025 & 2033
- Figure 67: Middle East and Africa Metal Matrix Composites Market Revenue (Million), by Type 2025 & 2033
- Figure 68: Middle East and Africa Metal Matrix Composites Market Volume (Million), by Type 2025 & 2033
- Figure 69: Middle East and Africa Metal Matrix Composites Market Revenue Share (%), by Type 2025 & 2033
- Figure 70: Middle East and Africa Metal Matrix Composites Market Volume Share (%), by Type 2025 & 2033
- Figure 71: Middle East and Africa Metal Matrix Composites Market Revenue (Million), by Fillers 2025 & 2033
- Figure 72: Middle East and Africa Metal Matrix Composites Market Volume (Million), by Fillers 2025 & 2033
- Figure 73: Middle East and Africa Metal Matrix Composites Market Revenue Share (%), by Fillers 2025 & 2033
- Figure 74: Middle East and Africa Metal Matrix Composites Market Volume Share (%), by Fillers 2025 & 2033
- Figure 75: Middle East and Africa Metal Matrix Composites Market Revenue (Million), by End-user Industry 2025 & 2033
- Figure 76: Middle East and Africa Metal Matrix Composites Market Volume (Million), by End-user Industry 2025 & 2033
- Figure 77: Middle East and Africa Metal Matrix Composites Market Revenue Share (%), by End-user Industry 2025 & 2033
- Figure 78: Middle East and Africa Metal Matrix Composites Market Volume Share (%), by End-user Industry 2025 & 2033
- Figure 79: Middle East and Africa Metal Matrix Composites Market Revenue (Million), by Country 2025 & 2033
- Figure 80: Middle East and Africa Metal Matrix Composites Market Volume (Million), by Country 2025 & 2033
- Figure 81: Middle East and Africa Metal Matrix Composites Market Revenue Share (%), by Country 2025 & 2033
- Figure 82: Middle East and Africa Metal Matrix Composites Market Volume Share (%), by Country 2025 & 2033
List of Tables
- Table 1: Global Metal Matrix Composites Market Revenue Million Forecast, by Type 2020 & 2033
- Table 2: Global Metal Matrix Composites Market Volume Million Forecast, by Type 2020 & 2033
- Table 3: Global Metal Matrix Composites Market Revenue Million Forecast, by Fillers 2020 & 2033
- Table 4: Global Metal Matrix Composites Market Volume Million Forecast, by Fillers 2020 & 2033
- Table 5: Global Metal Matrix Composites Market Revenue Million Forecast, by End-user Industry 2020 & 2033
- Table 6: Global Metal Matrix Composites Market Volume Million Forecast, by End-user Industry 2020 & 2033
- Table 7: Global Metal Matrix Composites Market Revenue Million Forecast, by Region 2020 & 2033
- Table 8: Global Metal Matrix Composites Market Volume Million Forecast, by Region 2020 & 2033
- Table 9: Global Metal Matrix Composites Market Revenue Million Forecast, by Type 2020 & 2033
- Table 10: Global Metal Matrix Composites Market Volume Million Forecast, by Type 2020 & 2033
- Table 11: Global Metal Matrix Composites Market Revenue Million Forecast, by Fillers 2020 & 2033
- Table 12: Global Metal Matrix Composites Market Volume Million Forecast, by Fillers 2020 & 2033
- Table 13: Global Metal Matrix Composites Market Revenue Million Forecast, by End-user Industry 2020 & 2033
- Table 14: Global Metal Matrix Composites Market Volume Million Forecast, by End-user Industry 2020 & 2033
- Table 15: Global Metal Matrix Composites Market Revenue Million Forecast, by Country 2020 & 2033
- Table 16: Global Metal Matrix Composites Market Volume Million Forecast, by Country 2020 & 2033
- Table 17: China Metal Matrix Composites Market Revenue (Million) Forecast, by Application 2020 & 2033
- Table 18: China Metal Matrix Composites Market Volume (Million) Forecast, by Application 2020 & 2033
- Table 19: India Metal Matrix Composites Market Revenue (Million) Forecast, by Application 2020 & 2033
- Table 20: India Metal Matrix Composites Market Volume (Million) Forecast, by Application 2020 & 2033
- Table 21: Japan Metal Matrix Composites Market Revenue (Million) Forecast, by Application 2020 & 2033
- Table 22: Japan Metal Matrix Composites Market Volume (Million) Forecast, by Application 2020 & 2033
- Table 23: South Korea Metal Matrix Composites Market Revenue (Million) Forecast, by Application 2020 & 2033
- Table 24: South Korea Metal Matrix Composites Market Volume (Million) Forecast, by Application 2020 & 2033
- Table 25: Rest of Asia Pacific Metal Matrix Composites Market Revenue (Million) Forecast, by Application 2020 & 2033
- Table 26: Rest of Asia Pacific Metal Matrix Composites Market Volume (Million) Forecast, by Application 2020 & 2033
- Table 27: Global Metal Matrix Composites Market Revenue Million Forecast, by Type 2020 & 2033
- Table 28: Global Metal Matrix Composites Market Volume Million Forecast, by Type 2020 & 2033
- Table 29: Global Metal Matrix Composites Market Revenue Million Forecast, by Fillers 2020 & 2033
- Table 30: Global Metal Matrix Composites Market Volume Million Forecast, by Fillers 2020 & 2033
- Table 31: Global Metal Matrix Composites Market Revenue Million Forecast, by End-user Industry 2020 & 2033
- Table 32: Global Metal Matrix Composites Market Volume Million Forecast, by End-user Industry 2020 & 2033
- Table 33: Global Metal Matrix Composites Market Revenue Million Forecast, by Country 2020 & 2033
- Table 34: Global Metal Matrix Composites Market Volume Million Forecast, by Country 2020 & 2033
- Table 35: United States Metal Matrix Composites Market Revenue (Million) Forecast, by Application 2020 & 2033
- Table 36: United States Metal Matrix Composites Market Volume (Million) Forecast, by Application 2020 & 2033
- Table 37: Canada Metal Matrix Composites Market Revenue (Million) Forecast, by Application 2020 & 2033
- Table 38: Canada Metal Matrix Composites Market Volume (Million) Forecast, by Application 2020 & 2033
- Table 39: Mexico Metal Matrix Composites Market Revenue (Million) Forecast, by Application 2020 & 2033
- Table 40: Mexico Metal Matrix Composites Market Volume (Million) Forecast, by Application 2020 & 2033
- Table 41: Global Metal Matrix Composites Market Revenue Million Forecast, by Type 2020 & 2033
- Table 42: Global Metal Matrix Composites Market Volume Million Forecast, by Type 2020 & 2033
- Table 43: Global Metal Matrix Composites Market Revenue Million Forecast, by Fillers 2020 & 2033
- Table 44: Global Metal Matrix Composites Market Volume Million Forecast, by Fillers 2020 & 2033
- Table 45: Global Metal Matrix Composites Market Revenue Million Forecast, by End-user Industry 2020 & 2033
- Table 46: Global Metal Matrix Composites Market Volume Million Forecast, by End-user Industry 2020 & 2033
- Table 47: Global Metal Matrix Composites Market Revenue Million Forecast, by Country 2020 & 2033
- Table 48: Global Metal Matrix Composites Market Volume Million Forecast, by Country 2020 & 2033
- Table 49: Germany Metal Matrix Composites Market Revenue (Million) Forecast, by Application 2020 & 2033
- Table 50: Germany Metal Matrix Composites Market Volume (Million) Forecast, by Application 2020 & 2033
- Table 51: United Kingdom Metal Matrix Composites Market Revenue (Million) Forecast, by Application 2020 & 2033
- Table 52: United Kingdom Metal Matrix Composites Market Volume (Million) Forecast, by Application 2020 & 2033
- Table 53: Italy Metal Matrix Composites Market Revenue (Million) Forecast, by Application 2020 & 2033
- Table 54: Italy Metal Matrix Composites Market Volume (Million) Forecast, by Application 2020 & 2033
- Table 55: France Metal Matrix Composites Market Revenue (Million) Forecast, by Application 2020 & 2033
- Table 56: France Metal Matrix Composites Market Volume (Million) Forecast, by Application 2020 & 2033
- Table 57: Spain Metal Matrix Composites Market Revenue (Million) Forecast, by Application 2020 & 2033
- Table 58: Spain Metal Matrix Composites Market Volume (Million) Forecast, by Application 2020 & 2033
- Table 59: Rest of Europe Metal Matrix Composites Market Revenue (Million) Forecast, by Application 2020 & 2033
- Table 60: Rest of Europe Metal Matrix Composites Market Volume (Million) Forecast, by Application 2020 & 2033
- Table 61: Global Metal Matrix Composites Market Revenue Million Forecast, by Type 2020 & 2033
- Table 62: Global Metal Matrix Composites Market Volume Million Forecast, by Type 2020 & 2033
- Table 63: Global Metal Matrix Composites Market Revenue Million Forecast, by Fillers 2020 & 2033
- Table 64: Global Metal Matrix Composites Market Volume Million Forecast, by Fillers 2020 & 2033
- Table 65: Global Metal Matrix Composites Market Revenue Million Forecast, by End-user Industry 2020 & 2033
- Table 66: Global Metal Matrix Composites Market Volume Million Forecast, by End-user Industry 2020 & 2033
- Table 67: Global Metal Matrix Composites Market Revenue Million Forecast, by Country 2020 & 2033
- Table 68: Global Metal Matrix Composites Market Volume Million Forecast, by Country 2020 & 2033
- Table 69: Brazil Metal Matrix Composites Market Revenue (Million) Forecast, by Application 2020 & 2033
- Table 70: Brazil Metal Matrix Composites Market Volume (Million) Forecast, by Application 2020 & 2033
- Table 71: Argentina Metal Matrix Composites Market Revenue (Million) Forecast, by Application 2020 & 2033
- Table 72: Argentina Metal Matrix Composites Market Volume (Million) Forecast, by Application 2020 & 2033
- Table 73: Rest of South America Metal Matrix Composites Market Revenue (Million) Forecast, by Application 2020 & 2033
- Table 74: Rest of South America Metal Matrix Composites Market Volume (Million) Forecast, by Application 2020 & 2033
- Table 75: Global Metal Matrix Composites Market Revenue Million Forecast, by Type 2020 & 2033
- Table 76: Global Metal Matrix Composites Market Volume Million Forecast, by Type 2020 & 2033
- Table 77: Global Metal Matrix Composites Market Revenue Million Forecast, by Fillers 2020 & 2033
- Table 78: Global Metal Matrix Composites Market Volume Million Forecast, by Fillers 2020 & 2033
- Table 79: Global Metal Matrix Composites Market Revenue Million Forecast, by End-user Industry 2020 & 2033
- Table 80: Global Metal Matrix Composites Market Volume Million Forecast, by End-user Industry 2020 & 2033
- Table 81: Global Metal Matrix Composites Market Revenue Million Forecast, by Country 2020 & 2033
- Table 82: Global Metal Matrix Composites Market Volume Million Forecast, by Country 2020 & 2033
- Table 83: Saudi Arabia Metal Matrix Composites Market Revenue (Million) Forecast, by Application 2020 & 2033
- Table 84: Saudi Arabia Metal Matrix Composites Market Volume (Million) Forecast, by Application 2020 & 2033
- Table 85: South Africa Metal Matrix Composites Market Revenue (Million) Forecast, by Application 2020 & 2033
- Table 86: South Africa Metal Matrix Composites Market Volume (Million) Forecast, by Application 2020 & 2033
- Table 87: Rest of Middle East and Africa Metal Matrix Composites Market Revenue (Million) Forecast, by Application 2020 & 2033
- Table 88: Rest of Middle East and Africa Metal Matrix Composites Market Volume (Million) Forecast, by Application 2020 & 2033
Frequently Asked Questions
1. What is the projected Compound Annual Growth Rate (CAGR) of the Metal Matrix Composites Market?
The projected CAGR is approximately 6.49%.
2. Which companies are prominent players in the Metal Matrix Composites Market?
Key companies in the market include 3A Composites, 3M (Ceradyne Inc ), ADMA Products Inc, CPS Technologies Corp, DAT Alloytech, Denka Company Limited, GKN Sinter Metals Engineering GmbH, Hitachi Metals Ltd, Materion Corporation, MTC Powder Solutions AB, Plansee Group, Sumitomo Electric Industries Ltd, Thermal Transfer Composites LLC, TISICS Ltd*List Not Exhaustive.
3. What are the main segments of the Metal Matrix Composites Market?
The market segments include Type, Fillers, End-user Industry.
4. Can you provide details about the market size?
The market size is estimated to be USD 457.16 Million as of 2022.
5. What are some drivers contributing to market growth?
Increasing Demand for Lightweight Materials in Aerospace and Defense Industry; Superior Properties of Metal Matrix Composites over Metals.
6. What are the notable trends driving market growth?
Electrical and Electronics Segment to Register Fastest Growth.
7. Are there any restraints impacting market growth?
Increasing Demand for Lightweight Materials in Aerospace and Defense Industry; Superior Properties of Metal Matrix Composites over Metals.
8. Can you provide examples of recent developments in the market?
In January 2022, Plansee Group signed a definitive agreement to acquire Mi-Tech Tungsten Metals. The acquisition will help Plansee Group expand its market position for tungsten products in North America.
9. What pricing options are available for accessing the report?
Pricing options include single-user, multi-user, and enterprise licenses priced at USD 4750, USD 5250, and USD 8750 respectively.
10. Is the market size provided in terms of value or volume?
The market size is provided in terms of value, measured in Million and volume, measured in Million.
11. Are there any specific market keywords associated with the report?
Yes, the market keyword associated with the report is "Metal Matrix Composites Market," which aids in identifying and referencing the specific market segment covered.
12. How do I determine which pricing option suits my needs best?
The pricing options vary based on user requirements and access needs. Individual users may opt for single-user licenses, while businesses requiring broader access may choose multi-user or enterprise licenses for cost-effective access to the report.
13. Are there any additional resources or data provided in the Metal Matrix Composites Market report?
While the report offers comprehensive insights, it's advisable to review the specific contents or supplementary materials provided to ascertain if additional resources or data are available.
14. How can I stay updated on further developments or reports in the Metal Matrix Composites Market?
To stay informed about further developments, trends, and reports in the Metal Matrix Composites Market, consider subscribing to industry newsletters, following relevant companies and organizations, or regularly checking reputable industry news sources and publications.
Methodology
Step 1 - Identification of Relevant Samples Size from Population Database


Step 2 - Approaches for Defining Global Market Size (Value, Volume* & Price*)

Note*: In applicable scenarios
Step 3 - Data Sources
Primary Research
- Web Analytics
- Survey Reports
- Research Institute
- Latest Research Reports
- Opinion Leaders
Secondary Research
- Annual Reports
- White Paper
- Latest Press Release
- Industry Association
- Paid Database
- Investor Presentations

Step 4 - Data Triangulation
Involves using different sources of information in order to increase the validity of a study
These sources are likely to be stakeholders in a program - participants, other researchers, program staff, other community members, and so on.
Then we put all data in single framework & apply various statistical tools to find out the dynamic on the market.
During the analysis stage, feedback from the stakeholder groups would be compared to determine areas of agreement as well as areas of divergence