

Key Insights
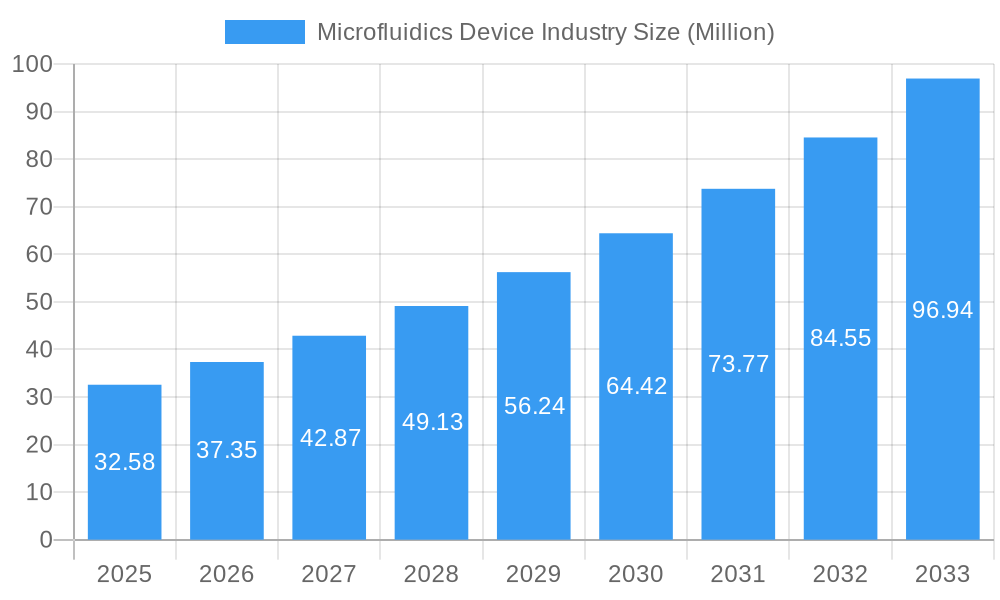
The global Microfluidics Device Industry is experiencing robust expansion, projected to reach a substantial market size of USD 32.58 million. This growth is underpinned by an impressive Compound Annual Growth Rate (CAGR) of 14.79%, indicating a dynamic and rapidly evolving sector. Key drivers fueling this expansion include the escalating demand for miniaturized and integrated systems in drug delivery, enabling more precise and targeted therapeutic interventions. Furthermore, the burgeoning need for rapid and accessible point-of-care diagnostics, particularly in remote or resource-limited settings, is a significant catalyst. The pharmaceutical and biotechnology research sectors are also heavily contributing, leveraging microfluidic devices for high-throughput screening, cell-based assays, and advanced genetic analysis, all of which accelerate discovery and development timelines. These applications are driving innovation across various product types, from sophisticated microfluidic-based devices to essential components like microfluidic chips, micro pumps, and microneedles, with polymer and silicone materials seeing significant adoption due to their cost-effectiveness and biocompatibility.
Microfluidics Device Industry Market Size (In Million)
The market's trajectory is further shaped by several prominent trends. The integration of artificial intelligence (AI) and machine learning (ML) with microfluidic platforms is revolutionizing data analysis and experimental design, leading to enhanced efficiency and predictive capabilities. The increasing focus on personalized medicine is also a major trend, as microfluidics allows for the development of lab-on-a-chip devices capable of analyzing individual patient samples with high specificity. While the market exhibits strong growth, certain restraints exist. The high initial cost of research and development for novel microfluidic technologies and the need for specialized expertise for operation and maintenance can pose barriers to widespread adoption, particularly for smaller research institutions or companies. However, ongoing technological advancements, material innovations, and increasing government funding for life sciences research are expected to mitigate these challenges, paving the way for sustained and accelerated market growth in the coming years.
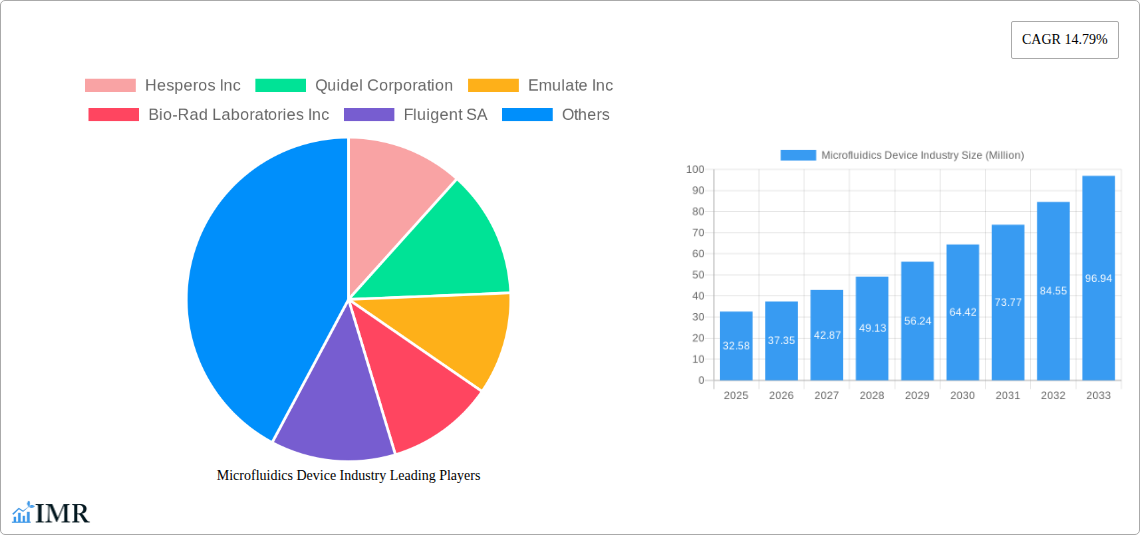
Microfluidics Device Industry Company Market Share
Microfluidics Device Industry Report: Precision Engineering for Tomorrow's Innovations
This comprehensive report offers an in-depth analysis of the global Microfluidics Device Industry, projecting its trajectory from 2019 to 2033, with a base year of 2025. We delve into the intricate market dynamics, growth trends, regional dominance, and the innovative product landscape, providing actionable insights for stakeholders. Leveraging critical keywords such as "microfluidic chips," "lab-on-a-chip," "point-of-care diagnostics," and "drug delivery systems," this report is optimized for maximum search engine visibility, attracting industry professionals and researchers. We explore the parent market's influence and child market opportunities, highlighting the exponential growth of microfluidics in diverse applications.
Microfluidics Device Industry Market Dynamics & Structure
The microfluidics device industry is characterized by a moderately concentrated market, with a handful of key players like Agilent Technologies Inc., Illumina Inc., and PerkinElmer Inc. leading innovation and market share. Technological advancements in miniaturization, precise fluid control, and sophisticated detection methods are the primary drivers of growth, enabling novel applications in pharmaceuticals, biotechnology, and diagnostics. Stringent regulatory frameworks for medical devices, particularly in point-of-care diagnostics and drug delivery, necessitate rigorous validation and compliance, acting as both a barrier and a quality differentiator. Competitive product substitutes, while emerging, are yet to fully replicate the precision and efficiency offered by microfluidic solutions. End-user demographics are increasingly sophisticated, with a growing demand for personalized medicine, rapid diagnostics, and more efficient research tools. Mergers and acquisitions (M&A) are a recurring theme, as larger corporations seek to integrate innovative microfluidic technologies into their portfolios, evidenced by an estimated 8-12 M&A deals annually over the historical period.
- Market Concentration: Moderately concentrated, with key players holding significant market share.
- Technological Innovation Drivers: Miniaturization, precision fluid control, advanced detection, integration capabilities.
- Regulatory Frameworks: High impact, requiring rigorous compliance for medical applications.
- Competitive Product Substitutes: Emerging but not yet fully competitive across all applications.
- End-User Demographics: Growing demand for precision, speed, and personalized solutions.
- M&A Trends: Active consolidation to acquire advanced microfluidic capabilities.
Microfluidics Device Industry Growth Trends & Insights
The global microfluidics device industry is poised for remarkable expansion, driven by the convergence of technological innovation and critical market needs. Over the forecast period of 2025–2033, the market is anticipated to witness a robust Compound Annual Growth Rate (CAGR) of approximately 15.2%, propelling its market size from an estimated $6,500 million units in the base year of 2025 to a projected $19,000 million units by 2033. This impressive growth is fueled by increasing adoption rates in pharmaceutical research and development, where microfluidic platforms are revolutionizing drug discovery by enabling high-throughput screening and complex biological simulations. The burgeoning field of point-of-care diagnostics is another significant contributor, with microfluidic devices facilitating rapid, accurate, and accessible diagnostic tests directly at the patient's bedside, reducing turnaround times and improving patient outcomes.
Technological disruptions, such as the development of more sophisticated microfluidic chips and advanced detection systems, are continuously expanding the application spectrum. The increasing demand for personalized medicine, requiring smaller sample volumes and higher analytical precision, further accelerates the penetration of microfluidic technologies. Consumer behavior is shifting towards proactive health management and accessible healthcare solutions, directly benefiting the demand for point-of-care diagnostics facilitated by microfluidics. The integration of artificial intelligence and machine learning with microfluidic platforms is opening new avenues for predictive diagnostics and treatment optimization. For instance, the ability to precisely control cellular environments on-chip is crucial for advancements in organ-on-a-chip technologies, a rapidly evolving segment of the biotechnology research application, which is itself a significant child market within the broader microfluidics landscape. The decreasing cost of microfluidic component manufacturing, particularly for polymer-based chips, is also contributing to wider market accessibility and adoption rates, especially in research settings and early-stage diagnostic development. The parent market for advanced analytical instruments and laboratory equipment provides a foundational ecosystem for microfluidics to thrive, with synergistic growth observed in these interconnected sectors.
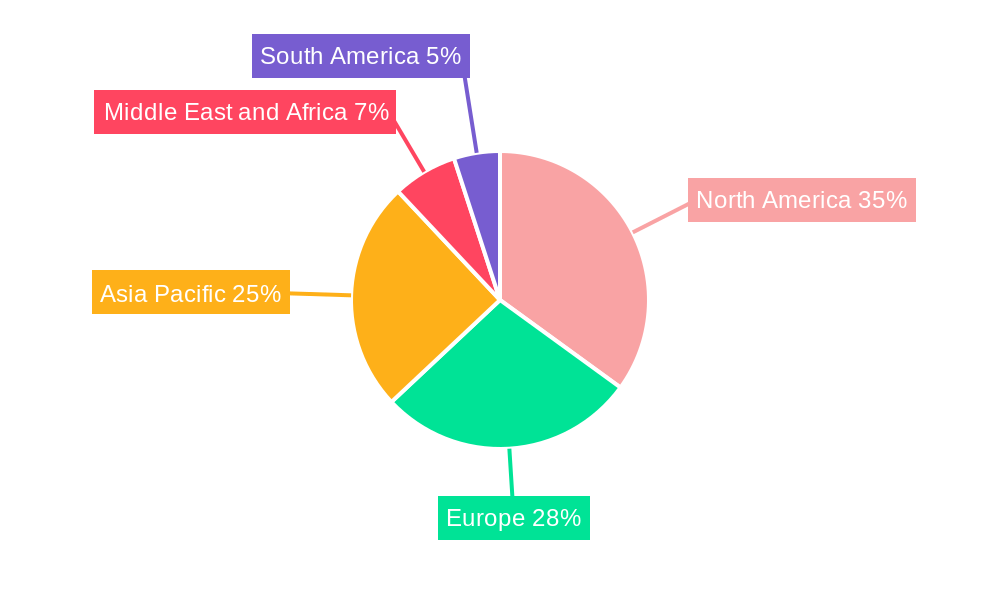
Dominant Regions, Countries, or Segments in Microfluidics Device Industry
North America, led by the United States, is a dominant force in the global microfluidics device industry, driven by substantial investments in biotechnology research, a robust pharmaceutical sector, and a high prevalence of chronic diseases fueling the demand for point-of-care diagnostics. The region’s advanced healthcare infrastructure, strong government funding for scientific research, and the presence of leading academic institutions and technology companies like Emulate Inc., Bio-Rad Laboratories Inc., and Agilent Technologies Inc. create a fertile ground for microfluidics innovation and adoption. The application segment of Pharmaceutical and Biotechnology Research is a significant contributor to North America's dominance, with microfluidic devices playing a crucial role in drug discovery, genomics, proteomics, and cell-based assays. The market size for this segment in North America is estimated to be around 45% of the global total.
The Product Type segment of Microfluidic-based Devices, encompassing sophisticated lab-on-a-chip systems and integrated analytical platforms, holds a commanding market share, estimated at 60% of the overall microfluidics market in the region. This is closely followed by Microfluidic Components, particularly Microfluidic Chips, which are essential building blocks for these advanced devices. The Material segment sees a strong preference for Polymer materials due to their cost-effectiveness, ease of fabrication, and biocompatibility, making them ideal for disposable microfluidic consumables used in diagnostics and research. The economic policies encouraging R&D, coupled with a mature market for advanced medical devices, further solidify North America's leading position.
Europe, particularly Germany, the United Kingdom, and Switzerland, also represents a significant market, driven by a strong pharmaceutical industry and a growing emphasis on personalized medicine and advanced diagnostics. The Asia-Pacific region, led by China and Japan, is emerging as a rapidly growing market, fueled by increasing healthcare expenditure, a large patient population, and a growing focus on domestic manufacturing of advanced medical technologies. The development of cost-effective microfluidic solutions in this region is accelerating adoption in point-of-care diagnostics and research applications.
- Dominant Region: North America (particularly the United States).
- Key Drivers (North America): High R&D investment, advanced healthcare infrastructure, leading pharmaceutical and biotech companies, government funding.
- Dominant Product Type Segment: Microfluidic-based Devices (Lab-on-a-chip, integrated systems).
- Dominant Application Segment: Pharmaceutical and Biotechnology Research, Point-of-care Diagnostics.
- Dominant Material Segment: Polymer.
- Growth Potential: High growth in Asia-Pacific due to expanding healthcare access and increasing R&D focus.
Microfluidics Device Industry Product Landscape
The product landscape of the microfluidics device industry is defined by continuous innovation in precision fluid handling and miniaturization. Companies like Fluigent SA and Dolomite Microfluidics are at the forefront of developing advanced microfluidic components, including highly precise micro pumps and sophisticated microfluidic chips tailored for specific research and diagnostic needs. These products enable unprecedented control over fluid volumes, flow rates, and mixing ratios, crucial for applications ranging from cell culture and single-cell analysis to droplet generation for high-throughput screening. The integration of novel materials and advanced fabrication techniques, such as 3D printing and soft lithography, is leading to the development of more complex and functional microfluidic systems. Key selling propositions include enhanced sensitivity, reduced sample and reagent consumption, faster assay times, and the potential for multiplexed analysis on a single chip. Innovations are increasingly focused on user-friendliness and automation, making microfluidic technologies more accessible to a wider range of researchers and clinicians.
Key Drivers, Barriers & Challenges in Microfluidics Device Industry
The microfluidics device industry is propelled by several key drivers. Technological advancements in material science and nanofabrication enable the creation of more intricate and functional microfluidic devices. The growing demand for rapid and accurate point-of-care diagnostics, driven by healthcare accessibility initiatives and the need for early disease detection, is a significant growth accelerator. Furthermore, the increasing R&D investments in pharmaceuticals and biotechnology, particularly in areas like personalized medicine and drug discovery, create substantial opportunities for microfluidic platforms. The development of organ-on-a-chip technologies, for instance, offers a more predictive and cost-effective alternative to traditional animal testing.
However, the industry faces several challenges and barriers. The high initial cost of research and development for novel microfluidic devices can be substantial, particularly for complex integrated systems. Regulatory hurdles for medical device approval, especially for diagnostic applications, can be time-consuming and costly, requiring extensive validation and clinical trials. Supply chain issues for specialized microfluidic components and materials can also impact production timelines and costs. Finally, the need for specialized expertise in microfluidics design, fabrication, and operation can limit widespread adoption among less specialized laboratories. Competitive pressures from established diagnostic and analytical technologies also necessitate continuous innovation to demonstrate clear advantages in performance and cost-effectiveness.
Emerging Opportunities in Microfluidics Device Industry
Emerging opportunities in the microfluidics device industry are abundant and diverse. The burgeoning field of personalized medicine presents a significant avenue, with microfluidics enabling the precise analysis of individual patient samples for tailored treatment strategies. The integration of microfluidics with artificial intelligence and machine learning is unlocking new potential in predictive diagnostics and therapeutic monitoring, creating sophisticated "smart" diagnostic devices. The expansion of point-of-care testing into remote and underserved areas, facilitated by the miniaturization and portability of microfluidic solutions, offers a vast untapped market. Furthermore, advancements in microfluidic applications for environmental monitoring and food safety testing, detecting contaminants and pathogens with high sensitivity and speed, represent another promising growth area. The development of cost-effective, mass-producible microfluidic chips for emerging markets also holds immense potential for global health impact and commercial expansion.
Growth Accelerators in the Microfluidics Device Industry Industry
The long-term growth of the microfluidics device industry is being significantly accelerated by several catalysts. Technological breakthroughs in areas like advanced polymer fabrication, 3D microprinting, and integrated sensing technologies are continually enhancing the capabilities and reducing the cost of microfluidic devices. Strategic partnerships between microfluidics companies and larger pharmaceutical, biotechnology, and diagnostic firms are crucial for accelerating product development, market penetration, and commercialization. These collaborations often involve co-development agreements, licensing deals, and strategic investments, leveraging complementary expertise and market access. Market expansion strategies, including the development of user-friendly, automated microfluidic platforms and targeting emerging economies with tailored solutions, are also playing a vital role in driving sustained growth. The increasing focus on point-of-care diagnostics and precision medicine further fuels demand, creating a positive feedback loop for innovation and investment.
Key Players Shaping the Microfluidics Device Industry Market
- Hesperos Inc.
- Quidel Corporation
- Emulate Inc.
- Bio-Rad Laboratories Inc.
- Fluigent SA
- ZEON CORPORATION
- Dolomite Microfluidics (Blacktrace Holdings Ltd)
- Micronit Microfluidics
- Biosurfit SA
- Bartels-Mikrotechnik
- Sphere Fluidics Limited
- Agilent Technologies Inc.
- UFluidix
- PerkinElmer Inc.
- Illumina Inc.
- Fluidigm Corporation
- Nanomix Inc.
Notable Milestones in Microfluidics Device Industry Sector
- November 2023: Microfluidics, a unit of IDEX Material Processing Technology (MPT), launched Microfluidics’ newest processor, designed for production-scale cell disruption, crucial for manufacturing biological products like vaccine antigens and viral vectors.
- January 2023: SCIEX launched the Intabio ZT system, a fully-integrated microfluidic chip-based platform combining imaged capillary isoelectric focusing (icIEF) separation and UV detection, enhancing analytical capabilities.
In-Depth Microfluidics Device Industry Market Outlook
The future market outlook for the microfluidics device industry is exceptionally promising, driven by relentless innovation and expanding applications. Growth accelerators, including the maturation of organ-on-a-chip technologies for drug development and the widespread adoption of microfluidics in personalized medicine, will continue to fuel market expansion. Strategic partnerships between established industry giants and agile microfluidics startups are anticipated to lead to more integrated and sophisticated solutions, enhancing market reach and impact. The increasing global emphasis on accessible and rapid healthcare, particularly in diagnostics, presents a substantial opportunity for microfluidic-based point-of-care devices. Furthermore, ongoing advancements in materials science and fabrication techniques will likely lead to more cost-effective and user-friendly microfluidic systems, democratizing their use across research, clinical, and potentially even consumer health applications. The market is set to witness a paradigm shift towards miniaturized, highly efficient, and data-rich analytical and diagnostic tools.
Microfluidics Device Industry Segmentation
-
1. Product Type
- 1.1. Microfluidic-based Devices
-
1.2. Microfluidic Components
- 1.2.1. Microfluidic Chips
- 1.2.2. Micro Pumps
- 1.2.3. Microneedles
- 1.2.4. Other Product Types
-
2. Application
- 2.1. Drug Delivery
- 2.2. Point-of-care Diagnostics
- 2.3. Pharmaceutical and Biotechnology Research
-
3. Material
- 3.1. Polymer
- 3.2. Silicone
- 3.3. Glass
Microfluidics Device Industry Segmentation By Geography
-
1. North America
- 1.1. United States
- 1.2. Canada
- 1.3. Mexico
-
2. Europe
- 2.1. France
- 2.2. United Kingdom
- 2.3. Germany
- 2.4. Italy
- 2.5. Spain
- 2.6. Rest of Europe
-
3. Asia Pacific
- 3.1. China
- 3.2. Japan
- 3.3. India
- 3.4. Australia
- 3.5. South Korea
- 3.6. Rest of Asia Pacific
-
4. Middle East and Africa
- 4.1. GCC
- 4.2. South Africa
- 4.3. Rest of Middle East and Africa
-
5. South America
- 5.1. Brazil
- 5.2. Argentina
- 5.3. Rest of South America
Microfluidics Device Industry Regional Market Share
Geographic Coverage of Microfluidics Device Industry
Microfluidics Device Industry REPORT HIGHLIGHTS
| Aspects | Details |
|---|---|
| Study Period | 2020-2034 |
| Base Year | 2025 |
| Estimated Year | 2026 |
| Forecast Period | 2026-2034 |
| Historical Period | 2020-2025 |
| Growth Rate | CAGR of 14.79% from 2020-2034 |
| Segmentation |
|
Table of Contents
- 1. Introduction
- 1.1. Research Scope
- 1.2. Market Segmentation
- 1.3. Research Objective
- 1.4. Definitions and Assumptions
- 2. Executive Summary
- 2.1. Market Snapshot
- 3. Market Dynamics
- 3.1. Market Drivers
- 3.2. Market Restrains
- 3.3. Market Trends
- 3.4. Market Opportunities
- 4. Market Factor Analysis
- 4.1. Porters Five Forces
- 4.1.1. Bargaining Power of Suppliers
- 4.1.2. Bargaining Power of Buyers
- 4.1.3. Threat of New Entrants
- 4.1.4. Threat of Substitutes
- 4.1.5. Competitive Rivalry
- 4.2. PESTEL analysis
- 4.3. BCG Analysis
- 4.3.1. Stars (High Growth, High Market Share)
- 4.3.2. Cash Cows (Low Growth, High Market Share)
- 4.3.3. Question Mark (High Growth, Low Market Share)
- 4.3.4. Dogs (Low Growth, Low Market Share)
- 4.4. Ansoff Matrix Analysis
- 4.5. Supply Chain Analysis
- 4.6. Regulatory Landscape
- 4.7. Current Market Potential and Opportunity Assessment (TAM–SAM–SOM Framework)
- 4.8. IMR Analyst Note
- 4.1. Porters Five Forces
- 5. Market Analysis, Insights and Forecast 2021-2033
- 5.1. Market Analysis, Insights and Forecast - by Product Type
- 5.1.1. Microfluidic-based Devices
- 5.1.2. Microfluidic Components
- 5.1.2.1. Microfluidic Chips
- 5.1.2.2. Micro Pumps
- 5.1.2.3. Microneedles
- 5.1.2.4. Other Product Types
- 5.2. Market Analysis, Insights and Forecast - by Application
- 5.2.1. Drug Delivery
- 5.2.2. Point-of-care Diagnostics
- 5.2.3. Pharmaceutical and Biotechnology Research
- 5.3. Market Analysis, Insights and Forecast - by Material
- 5.3.1. Polymer
- 5.3.2. Silicone
- 5.3.3. Glass
- 5.4. Market Analysis, Insights and Forecast - by Region
- 5.4.1. North America
- 5.4.2. Europe
- 5.4.3. Asia Pacific
- 5.4.4. Middle East and Africa
- 5.4.5. South America
- 5.1. Market Analysis, Insights and Forecast - by Product Type
- 6. Global Microfluidics Device Industry Analysis, Insights and Forecast, 2021-2033
- 6.1. Market Analysis, Insights and Forecast - by Product Type
- 6.1.1. Microfluidic-based Devices
- 6.1.2. Microfluidic Components
- 6.1.2.1. Microfluidic Chips
- 6.1.2.2. Micro Pumps
- 6.1.2.3. Microneedles
- 6.1.2.4. Other Product Types
- 6.2. Market Analysis, Insights and Forecast - by Application
- 6.2.1. Drug Delivery
- 6.2.2. Point-of-care Diagnostics
- 6.2.3. Pharmaceutical and Biotechnology Research
- 6.3. Market Analysis, Insights and Forecast - by Material
- 6.3.1. Polymer
- 6.3.2. Silicone
- 6.3.3. Glass
- 6.1. Market Analysis, Insights and Forecast - by Product Type
- 7. North America Microfluidics Device Industry Analysis, Insights and Forecast, 2020-2032
- 7.1. Market Analysis, Insights and Forecast - by Product Type
- 7.1.1. Microfluidic-based Devices
- 7.1.2. Microfluidic Components
- 7.1.2.1. Microfluidic Chips
- 7.1.2.2. Micro Pumps
- 7.1.2.3. Microneedles
- 7.1.2.4. Other Product Types
- 7.2. Market Analysis, Insights and Forecast - by Application
- 7.2.1. Drug Delivery
- 7.2.2. Point-of-care Diagnostics
- 7.2.3. Pharmaceutical and Biotechnology Research
- 7.3. Market Analysis, Insights and Forecast - by Material
- 7.3.1. Polymer
- 7.3.2. Silicone
- 7.3.3. Glass
- 7.1. Market Analysis, Insights and Forecast - by Product Type
- 8. Europe Microfluidics Device Industry Analysis, Insights and Forecast, 2020-2032
- 8.1. Market Analysis, Insights and Forecast - by Product Type
- 8.1.1. Microfluidic-based Devices
- 8.1.2. Microfluidic Components
- 8.1.2.1. Microfluidic Chips
- 8.1.2.2. Micro Pumps
- 8.1.2.3. Microneedles
- 8.1.2.4. Other Product Types
- 8.2. Market Analysis, Insights and Forecast - by Application
- 8.2.1. Drug Delivery
- 8.2.2. Point-of-care Diagnostics
- 8.2.3. Pharmaceutical and Biotechnology Research
- 8.3. Market Analysis, Insights and Forecast - by Material
- 8.3.1. Polymer
- 8.3.2. Silicone
- 8.3.3. Glass
- 8.1. Market Analysis, Insights and Forecast - by Product Type
- 9. Asia Pacific Microfluidics Device Industry Analysis, Insights and Forecast, 2020-2032
- 9.1. Market Analysis, Insights and Forecast - by Product Type
- 9.1.1. Microfluidic-based Devices
- 9.1.2. Microfluidic Components
- 9.1.2.1. Microfluidic Chips
- 9.1.2.2. Micro Pumps
- 9.1.2.3. Microneedles
- 9.1.2.4. Other Product Types
- 9.2. Market Analysis, Insights and Forecast - by Application
- 9.2.1. Drug Delivery
- 9.2.2. Point-of-care Diagnostics
- 9.2.3. Pharmaceutical and Biotechnology Research
- 9.3. Market Analysis, Insights and Forecast - by Material
- 9.3.1. Polymer
- 9.3.2. Silicone
- 9.3.3. Glass
- 9.1. Market Analysis, Insights and Forecast - by Product Type
- 10. Middle East and Africa Microfluidics Device Industry Analysis, Insights and Forecast, 2020-2032
- 10.1. Market Analysis, Insights and Forecast - by Product Type
- 10.1.1. Microfluidic-based Devices
- 10.1.2. Microfluidic Components
- 10.1.2.1. Microfluidic Chips
- 10.1.2.2. Micro Pumps
- 10.1.2.3. Microneedles
- 10.1.2.4. Other Product Types
- 10.2. Market Analysis, Insights and Forecast - by Application
- 10.2.1. Drug Delivery
- 10.2.2. Point-of-care Diagnostics
- 10.2.3. Pharmaceutical and Biotechnology Research
- 10.3. Market Analysis, Insights and Forecast - by Material
- 10.3.1. Polymer
- 10.3.2. Silicone
- 10.3.3. Glass
- 10.1. Market Analysis, Insights and Forecast - by Product Type
- 11. South America Microfluidics Device Industry Analysis, Insights and Forecast, 2020-2032
- 11.1. Market Analysis, Insights and Forecast - by Product Type
- 11.1.1. Microfluidic-based Devices
- 11.1.2. Microfluidic Components
- 11.1.2.1. Microfluidic Chips
- 11.1.2.2. Micro Pumps
- 11.1.2.3. Microneedles
- 11.1.2.4. Other Product Types
- 11.2. Market Analysis, Insights and Forecast - by Application
- 11.2.1. Drug Delivery
- 11.2.2. Point-of-care Diagnostics
- 11.2.3. Pharmaceutical and Biotechnology Research
- 11.3. Market Analysis, Insights and Forecast - by Material
- 11.3.1. Polymer
- 11.3.2. Silicone
- 11.3.3. Glass
- 11.1. Market Analysis, Insights and Forecast - by Product Type
- 12. Competitive Analysis
- 12.1. Company Profiles
- 12.1.1 Hesperos Inc
- 12.1.1.1. Company Overview
- 12.1.1.2. Products
- 12.1.1.3. Company Financials
- 12.1.1.4. SWOT Analysis
- 12.1.2 Quidel Corporation
- 12.1.2.1. Company Overview
- 12.1.2.2. Products
- 12.1.2.3. Company Financials
- 12.1.2.4. SWOT Analysis
- 12.1.3 Emulate Inc
- 12.1.3.1. Company Overview
- 12.1.3.2. Products
- 12.1.3.3. Company Financials
- 12.1.3.4. SWOT Analysis
- 12.1.4 Bio-Rad Laboratories Inc
- 12.1.4.1. Company Overview
- 12.1.4.2. Products
- 12.1.4.3. Company Financials
- 12.1.4.4. SWOT Analysis
- 12.1.5 Fluigent SA
- 12.1.5.1. Company Overview
- 12.1.5.2. Products
- 12.1.5.3. Company Financials
- 12.1.5.4. SWOT Analysis
- 12.1.6 ZEON CORPORATION
- 12.1.6.1. Company Overview
- 12.1.6.2. Products
- 12.1.6.3. Company Financials
- 12.1.6.4. SWOT Analysis
- 12.1.7 Dolomite Microfluidics (Blacktrace Holdings Ltd)
- 12.1.7.1. Company Overview
- 12.1.7.2. Products
- 12.1.7.3. Company Financials
- 12.1.7.4. SWOT Analysis
- 12.1.8 Micronit Microfluidics
- 12.1.8.1. Company Overview
- 12.1.8.2. Products
- 12.1.8.3. Company Financials
- 12.1.8.4. SWOT Analysis
- 12.1.9 Biosurfit SA
- 12.1.9.1. Company Overview
- 12.1.9.2. Products
- 12.1.9.3. Company Financials
- 12.1.9.4. SWOT Analysis
- 12.1.10 Bartels-Mikrotechnik
- 12.1.10.1. Company Overview
- 12.1.10.2. Products
- 12.1.10.3. Company Financials
- 12.1.10.4. SWOT Analysis
- 12.1.11 Sphere Fluidics Limited
- 12.1.11.1. Company Overview
- 12.1.11.2. Products
- 12.1.11.3. Company Financials
- 12.1.11.4. SWOT Analysis
- 12.1.12 Agilent Technologies Inc
- 12.1.12.1. Company Overview
- 12.1.12.2. Products
- 12.1.12.3. Company Financials
- 12.1.12.4. SWOT Analysis
- 12.1.13 UFluidix
- 12.1.13.1. Company Overview
- 12.1.13.2. Products
- 12.1.13.3. Company Financials
- 12.1.13.4. SWOT Analysis
- 12.1.14 PerkinElmer Inc
- 12.1.14.1. Company Overview
- 12.1.14.2. Products
- 12.1.14.3. Company Financials
- 12.1.14.4. SWOT Analysis
- 12.1.15 Illumina Inc
- 12.1.15.1. Company Overview
- 12.1.15.2. Products
- 12.1.15.3. Company Financials
- 12.1.15.4. SWOT Analysis
- 12.1.16 FluIdigm Corporation
- 12.1.16.1. Company Overview
- 12.1.16.2. Products
- 12.1.16.3. Company Financials
- 12.1.16.4. SWOT Analysis
- 12.1.17 Nanomix Inc
- 12.1.17.1. Company Overview
- 12.1.17.2. Products
- 12.1.17.3. Company Financials
- 12.1.17.4. SWOT Analysis
- 12.1.1 Hesperos Inc
- 12.2. Market Entropy
- 12.2.1 Company's Key Areas Served
- 12.2.2 Recent Developments
- 12.3. Company Market Share Analysis 2025
- 12.3.1 Top 5 Companies Market Share Analysis
- 12.3.2 Top 3 Companies Market Share Analysis
- 12.4. List of Potential Customers
- 13. Research Methodology
List of Figures
- Figure 1: Global Microfluidics Device Industry Revenue Breakdown (Million, %) by Region 2025 & 2033
- Figure 2: Global Microfluidics Device Industry Volume Breakdown (K Unit, %) by Region 2025 & 2033
- Figure 3: North America Microfluidics Device Industry Revenue (Million), by Product Type 2025 & 2033
- Figure 4: North America Microfluidics Device Industry Volume (K Unit), by Product Type 2025 & 2033
- Figure 5: North America Microfluidics Device Industry Revenue Share (%), by Product Type 2025 & 2033
- Figure 6: North America Microfluidics Device Industry Volume Share (%), by Product Type 2025 & 2033
- Figure 7: North America Microfluidics Device Industry Revenue (Million), by Application 2025 & 2033
- Figure 8: North America Microfluidics Device Industry Volume (K Unit), by Application 2025 & 2033
- Figure 9: North America Microfluidics Device Industry Revenue Share (%), by Application 2025 & 2033
- Figure 10: North America Microfluidics Device Industry Volume Share (%), by Application 2025 & 2033
- Figure 11: North America Microfluidics Device Industry Revenue (Million), by Material 2025 & 2033
- Figure 12: North America Microfluidics Device Industry Volume (K Unit), by Material 2025 & 2033
- Figure 13: North America Microfluidics Device Industry Revenue Share (%), by Material 2025 & 2033
- Figure 14: North America Microfluidics Device Industry Volume Share (%), by Material 2025 & 2033
- Figure 15: North America Microfluidics Device Industry Revenue (Million), by Country 2025 & 2033
- Figure 16: North America Microfluidics Device Industry Volume (K Unit), by Country 2025 & 2033
- Figure 17: North America Microfluidics Device Industry Revenue Share (%), by Country 2025 & 2033
- Figure 18: North America Microfluidics Device Industry Volume Share (%), by Country 2025 & 2033
- Figure 19: Europe Microfluidics Device Industry Revenue (Million), by Product Type 2025 & 2033
- Figure 20: Europe Microfluidics Device Industry Volume (K Unit), by Product Type 2025 & 2033
- Figure 21: Europe Microfluidics Device Industry Revenue Share (%), by Product Type 2025 & 2033
- Figure 22: Europe Microfluidics Device Industry Volume Share (%), by Product Type 2025 & 2033
- Figure 23: Europe Microfluidics Device Industry Revenue (Million), by Application 2025 & 2033
- Figure 24: Europe Microfluidics Device Industry Volume (K Unit), by Application 2025 & 2033
- Figure 25: Europe Microfluidics Device Industry Revenue Share (%), by Application 2025 & 2033
- Figure 26: Europe Microfluidics Device Industry Volume Share (%), by Application 2025 & 2033
- Figure 27: Europe Microfluidics Device Industry Revenue (Million), by Material 2025 & 2033
- Figure 28: Europe Microfluidics Device Industry Volume (K Unit), by Material 2025 & 2033
- Figure 29: Europe Microfluidics Device Industry Revenue Share (%), by Material 2025 & 2033
- Figure 30: Europe Microfluidics Device Industry Volume Share (%), by Material 2025 & 2033
- Figure 31: Europe Microfluidics Device Industry Revenue (Million), by Country 2025 & 2033
- Figure 32: Europe Microfluidics Device Industry Volume (K Unit), by Country 2025 & 2033
- Figure 33: Europe Microfluidics Device Industry Revenue Share (%), by Country 2025 & 2033
- Figure 34: Europe Microfluidics Device Industry Volume Share (%), by Country 2025 & 2033
- Figure 35: Asia Pacific Microfluidics Device Industry Revenue (Million), by Product Type 2025 & 2033
- Figure 36: Asia Pacific Microfluidics Device Industry Volume (K Unit), by Product Type 2025 & 2033
- Figure 37: Asia Pacific Microfluidics Device Industry Revenue Share (%), by Product Type 2025 & 2033
- Figure 38: Asia Pacific Microfluidics Device Industry Volume Share (%), by Product Type 2025 & 2033
- Figure 39: Asia Pacific Microfluidics Device Industry Revenue (Million), by Application 2025 & 2033
- Figure 40: Asia Pacific Microfluidics Device Industry Volume (K Unit), by Application 2025 & 2033
- Figure 41: Asia Pacific Microfluidics Device Industry Revenue Share (%), by Application 2025 & 2033
- Figure 42: Asia Pacific Microfluidics Device Industry Volume Share (%), by Application 2025 & 2033
- Figure 43: Asia Pacific Microfluidics Device Industry Revenue (Million), by Material 2025 & 2033
- Figure 44: Asia Pacific Microfluidics Device Industry Volume (K Unit), by Material 2025 & 2033
- Figure 45: Asia Pacific Microfluidics Device Industry Revenue Share (%), by Material 2025 & 2033
- Figure 46: Asia Pacific Microfluidics Device Industry Volume Share (%), by Material 2025 & 2033
- Figure 47: Asia Pacific Microfluidics Device Industry Revenue (Million), by Country 2025 & 2033
- Figure 48: Asia Pacific Microfluidics Device Industry Volume (K Unit), by Country 2025 & 2033
- Figure 49: Asia Pacific Microfluidics Device Industry Revenue Share (%), by Country 2025 & 2033
- Figure 50: Asia Pacific Microfluidics Device Industry Volume Share (%), by Country 2025 & 2033
- Figure 51: Middle East and Africa Microfluidics Device Industry Revenue (Million), by Product Type 2025 & 2033
- Figure 52: Middle East and Africa Microfluidics Device Industry Volume (K Unit), by Product Type 2025 & 2033
- Figure 53: Middle East and Africa Microfluidics Device Industry Revenue Share (%), by Product Type 2025 & 2033
- Figure 54: Middle East and Africa Microfluidics Device Industry Volume Share (%), by Product Type 2025 & 2033
- Figure 55: Middle East and Africa Microfluidics Device Industry Revenue (Million), by Application 2025 & 2033
- Figure 56: Middle East and Africa Microfluidics Device Industry Volume (K Unit), by Application 2025 & 2033
- Figure 57: Middle East and Africa Microfluidics Device Industry Revenue Share (%), by Application 2025 & 2033
- Figure 58: Middle East and Africa Microfluidics Device Industry Volume Share (%), by Application 2025 & 2033
- Figure 59: Middle East and Africa Microfluidics Device Industry Revenue (Million), by Material 2025 & 2033
- Figure 60: Middle East and Africa Microfluidics Device Industry Volume (K Unit), by Material 2025 & 2033
- Figure 61: Middle East and Africa Microfluidics Device Industry Revenue Share (%), by Material 2025 & 2033
- Figure 62: Middle East and Africa Microfluidics Device Industry Volume Share (%), by Material 2025 & 2033
- Figure 63: Middle East and Africa Microfluidics Device Industry Revenue (Million), by Country 2025 & 2033
- Figure 64: Middle East and Africa Microfluidics Device Industry Volume (K Unit), by Country 2025 & 2033
- Figure 65: Middle East and Africa Microfluidics Device Industry Revenue Share (%), by Country 2025 & 2033
- Figure 66: Middle East and Africa Microfluidics Device Industry Volume Share (%), by Country 2025 & 2033
- Figure 67: South America Microfluidics Device Industry Revenue (Million), by Product Type 2025 & 2033
- Figure 68: South America Microfluidics Device Industry Volume (K Unit), by Product Type 2025 & 2033
- Figure 69: South America Microfluidics Device Industry Revenue Share (%), by Product Type 2025 & 2033
- Figure 70: South America Microfluidics Device Industry Volume Share (%), by Product Type 2025 & 2033
- Figure 71: South America Microfluidics Device Industry Revenue (Million), by Application 2025 & 2033
- Figure 72: South America Microfluidics Device Industry Volume (K Unit), by Application 2025 & 2033
- Figure 73: South America Microfluidics Device Industry Revenue Share (%), by Application 2025 & 2033
- Figure 74: South America Microfluidics Device Industry Volume Share (%), by Application 2025 & 2033
- Figure 75: South America Microfluidics Device Industry Revenue (Million), by Material 2025 & 2033
- Figure 76: South America Microfluidics Device Industry Volume (K Unit), by Material 2025 & 2033
- Figure 77: South America Microfluidics Device Industry Revenue Share (%), by Material 2025 & 2033
- Figure 78: South America Microfluidics Device Industry Volume Share (%), by Material 2025 & 2033
- Figure 79: South America Microfluidics Device Industry Revenue (Million), by Country 2025 & 2033
- Figure 80: South America Microfluidics Device Industry Volume (K Unit), by Country 2025 & 2033
- Figure 81: South America Microfluidics Device Industry Revenue Share (%), by Country 2025 & 2033
- Figure 82: South America Microfluidics Device Industry Volume Share (%), by Country 2025 & 2033
List of Tables
- Table 1: Global Microfluidics Device Industry Revenue Million Forecast, by Product Type 2020 & 2033
- Table 2: Global Microfluidics Device Industry Volume K Unit Forecast, by Product Type 2020 & 2033
- Table 3: Global Microfluidics Device Industry Revenue Million Forecast, by Application 2020 & 2033
- Table 4: Global Microfluidics Device Industry Volume K Unit Forecast, by Application 2020 & 2033
- Table 5: Global Microfluidics Device Industry Revenue Million Forecast, by Material 2020 & 2033
- Table 6: Global Microfluidics Device Industry Volume K Unit Forecast, by Material 2020 & 2033
- Table 7: Global Microfluidics Device Industry Revenue Million Forecast, by Region 2020 & 2033
- Table 8: Global Microfluidics Device Industry Volume K Unit Forecast, by Region 2020 & 2033
- Table 9: Global Microfluidics Device Industry Revenue Million Forecast, by Product Type 2020 & 2033
- Table 10: Global Microfluidics Device Industry Volume K Unit Forecast, by Product Type 2020 & 2033
- Table 11: Global Microfluidics Device Industry Revenue Million Forecast, by Application 2020 & 2033
- Table 12: Global Microfluidics Device Industry Volume K Unit Forecast, by Application 2020 & 2033
- Table 13: Global Microfluidics Device Industry Revenue Million Forecast, by Material 2020 & 2033
- Table 14: Global Microfluidics Device Industry Volume K Unit Forecast, by Material 2020 & 2033
- Table 15: Global Microfluidics Device Industry Revenue Million Forecast, by Country 2020 & 2033
- Table 16: Global Microfluidics Device Industry Volume K Unit Forecast, by Country 2020 & 2033
- Table 17: United States Microfluidics Device Industry Revenue (Million) Forecast, by Application 2020 & 2033
- Table 18: United States Microfluidics Device Industry Volume (K Unit) Forecast, by Application 2020 & 2033
- Table 19: Canada Microfluidics Device Industry Revenue (Million) Forecast, by Application 2020 & 2033
- Table 20: Canada Microfluidics Device Industry Volume (K Unit) Forecast, by Application 2020 & 2033
- Table 21: Mexico Microfluidics Device Industry Revenue (Million) Forecast, by Application 2020 & 2033
- Table 22: Mexico Microfluidics Device Industry Volume (K Unit) Forecast, by Application 2020 & 2033
- Table 23: Global Microfluidics Device Industry Revenue Million Forecast, by Product Type 2020 & 2033
- Table 24: Global Microfluidics Device Industry Volume K Unit Forecast, by Product Type 2020 & 2033
- Table 25: Global Microfluidics Device Industry Revenue Million Forecast, by Application 2020 & 2033
- Table 26: Global Microfluidics Device Industry Volume K Unit Forecast, by Application 2020 & 2033
- Table 27: Global Microfluidics Device Industry Revenue Million Forecast, by Material 2020 & 2033
- Table 28: Global Microfluidics Device Industry Volume K Unit Forecast, by Material 2020 & 2033
- Table 29: Global Microfluidics Device Industry Revenue Million Forecast, by Country 2020 & 2033
- Table 30: Global Microfluidics Device Industry Volume K Unit Forecast, by Country 2020 & 2033
- Table 31: France Microfluidics Device Industry Revenue (Million) Forecast, by Application 2020 & 2033
- Table 32: France Microfluidics Device Industry Volume (K Unit) Forecast, by Application 2020 & 2033
- Table 33: United Kingdom Microfluidics Device Industry Revenue (Million) Forecast, by Application 2020 & 2033
- Table 34: United Kingdom Microfluidics Device Industry Volume (K Unit) Forecast, by Application 2020 & 2033
- Table 35: Germany Microfluidics Device Industry Revenue (Million) Forecast, by Application 2020 & 2033
- Table 36: Germany Microfluidics Device Industry Volume (K Unit) Forecast, by Application 2020 & 2033
- Table 37: Italy Microfluidics Device Industry Revenue (Million) Forecast, by Application 2020 & 2033
- Table 38: Italy Microfluidics Device Industry Volume (K Unit) Forecast, by Application 2020 & 2033
- Table 39: Spain Microfluidics Device Industry Revenue (Million) Forecast, by Application 2020 & 2033
- Table 40: Spain Microfluidics Device Industry Volume (K Unit) Forecast, by Application 2020 & 2033
- Table 41: Rest of Europe Microfluidics Device Industry Revenue (Million) Forecast, by Application 2020 & 2033
- Table 42: Rest of Europe Microfluidics Device Industry Volume (K Unit) Forecast, by Application 2020 & 2033
- Table 43: Global Microfluidics Device Industry Revenue Million Forecast, by Product Type 2020 & 2033
- Table 44: Global Microfluidics Device Industry Volume K Unit Forecast, by Product Type 2020 & 2033
- Table 45: Global Microfluidics Device Industry Revenue Million Forecast, by Application 2020 & 2033
- Table 46: Global Microfluidics Device Industry Volume K Unit Forecast, by Application 2020 & 2033
- Table 47: Global Microfluidics Device Industry Revenue Million Forecast, by Material 2020 & 2033
- Table 48: Global Microfluidics Device Industry Volume K Unit Forecast, by Material 2020 & 2033
- Table 49: Global Microfluidics Device Industry Revenue Million Forecast, by Country 2020 & 2033
- Table 50: Global Microfluidics Device Industry Volume K Unit Forecast, by Country 2020 & 2033
- Table 51: China Microfluidics Device Industry Revenue (Million) Forecast, by Application 2020 & 2033
- Table 52: China Microfluidics Device Industry Volume (K Unit) Forecast, by Application 2020 & 2033
- Table 53: Japan Microfluidics Device Industry Revenue (Million) Forecast, by Application 2020 & 2033
- Table 54: Japan Microfluidics Device Industry Volume (K Unit) Forecast, by Application 2020 & 2033
- Table 55: India Microfluidics Device Industry Revenue (Million) Forecast, by Application 2020 & 2033
- Table 56: India Microfluidics Device Industry Volume (K Unit) Forecast, by Application 2020 & 2033
- Table 57: Australia Microfluidics Device Industry Revenue (Million) Forecast, by Application 2020 & 2033
- Table 58: Australia Microfluidics Device Industry Volume (K Unit) Forecast, by Application 2020 & 2033
- Table 59: South Korea Microfluidics Device Industry Revenue (Million) Forecast, by Application 2020 & 2033
- Table 60: South Korea Microfluidics Device Industry Volume (K Unit) Forecast, by Application 2020 & 2033
- Table 61: Rest of Asia Pacific Microfluidics Device Industry Revenue (Million) Forecast, by Application 2020 & 2033
- Table 62: Rest of Asia Pacific Microfluidics Device Industry Volume (K Unit) Forecast, by Application 2020 & 2033
- Table 63: Global Microfluidics Device Industry Revenue Million Forecast, by Product Type 2020 & 2033
- Table 64: Global Microfluidics Device Industry Volume K Unit Forecast, by Product Type 2020 & 2033
- Table 65: Global Microfluidics Device Industry Revenue Million Forecast, by Application 2020 & 2033
- Table 66: Global Microfluidics Device Industry Volume K Unit Forecast, by Application 2020 & 2033
- Table 67: Global Microfluidics Device Industry Revenue Million Forecast, by Material 2020 & 2033
- Table 68: Global Microfluidics Device Industry Volume K Unit Forecast, by Material 2020 & 2033
- Table 69: Global Microfluidics Device Industry Revenue Million Forecast, by Country 2020 & 2033
- Table 70: Global Microfluidics Device Industry Volume K Unit Forecast, by Country 2020 & 2033
- Table 71: GCC Microfluidics Device Industry Revenue (Million) Forecast, by Application 2020 & 2033
- Table 72: GCC Microfluidics Device Industry Volume (K Unit) Forecast, by Application 2020 & 2033
- Table 73: South Africa Microfluidics Device Industry Revenue (Million) Forecast, by Application 2020 & 2033
- Table 74: South Africa Microfluidics Device Industry Volume (K Unit) Forecast, by Application 2020 & 2033
- Table 75: Rest of Middle East and Africa Microfluidics Device Industry Revenue (Million) Forecast, by Application 2020 & 2033
- Table 76: Rest of Middle East and Africa Microfluidics Device Industry Volume (K Unit) Forecast, by Application 2020 & 2033
- Table 77: Global Microfluidics Device Industry Revenue Million Forecast, by Product Type 2020 & 2033
- Table 78: Global Microfluidics Device Industry Volume K Unit Forecast, by Product Type 2020 & 2033
- Table 79: Global Microfluidics Device Industry Revenue Million Forecast, by Application 2020 & 2033
- Table 80: Global Microfluidics Device Industry Volume K Unit Forecast, by Application 2020 & 2033
- Table 81: Global Microfluidics Device Industry Revenue Million Forecast, by Material 2020 & 2033
- Table 82: Global Microfluidics Device Industry Volume K Unit Forecast, by Material 2020 & 2033
- Table 83: Global Microfluidics Device Industry Revenue Million Forecast, by Country 2020 & 2033
- Table 84: Global Microfluidics Device Industry Volume K Unit Forecast, by Country 2020 & 2033
- Table 85: Brazil Microfluidics Device Industry Revenue (Million) Forecast, by Application 2020 & 2033
- Table 86: Brazil Microfluidics Device Industry Volume (K Unit) Forecast, by Application 2020 & 2033
- Table 87: Argentina Microfluidics Device Industry Revenue (Million) Forecast, by Application 2020 & 2033
- Table 88: Argentina Microfluidics Device Industry Volume (K Unit) Forecast, by Application 2020 & 2033
- Table 89: Rest of South America Microfluidics Device Industry Revenue (Million) Forecast, by Application 2020 & 2033
- Table 90: Rest of South America Microfluidics Device Industry Volume (K Unit) Forecast, by Application 2020 & 2033
Frequently Asked Questions
1. What is the projected Compound Annual Growth Rate (CAGR) of the Microfluidics Device Industry?
The projected CAGR is approximately 14.79%.
2. Which companies are prominent players in the Microfluidics Device Industry?
Key companies in the market include Hesperos Inc, Quidel Corporation, Emulate Inc, Bio-Rad Laboratories Inc, Fluigent SA, ZEON CORPORATION, Dolomite Microfluidics (Blacktrace Holdings Ltd), Micronit Microfluidics, Biosurfit SA, Bartels-Mikrotechnik, Sphere Fluidics Limited, Agilent Technologies Inc, UFluidix, PerkinElmer Inc, Illumina Inc, FluIdigm Corporation, Nanomix Inc.
3. What are the main segments of the Microfluidics Device Industry?
The market segments include Product Type, Application, Material.
4. Can you provide details about the market size?
The market size is estimated to be USD 32.58 Million as of 2022.
5. What are some drivers contributing to market growth?
Increasing Demand for Point-of-care Testing; Increasing Incidences of Various Diseases; Faster Turn-around Time for Analysis and Improved Portability of Devices.
6. What are the notable trends driving market growth?
The Point-of-Care Diagnostics Segment is Expected to Witness Considerable Growth During the Forecast Period.
7. Are there any restraints impacting market growth?
Integration of Microfluidics Technology with Existing Workflows; Low Adoption in Developing Countries Due to High Prices.
8. Can you provide examples of recent developments in the market?
November 2023: Microfluidics, a unit of IDEX Material Processing Technology (MPT), launched Microfluidics’ newest processor, which is designed for production scale cell disruption, which is used in the manufacturing of many biological products such as antigens for vaccines and viral vectors that deliver genes for next-generation gene therapy.
9. What pricing options are available for accessing the report?
Pricing options include single-user, multi-user, and enterprise licenses priced at USD 4750, USD 5250, and USD 8750 respectively.
10. Is the market size provided in terms of value or volume?
The market size is provided in terms of value, measured in Million and volume, measured in K Unit.
11. Are there any specific market keywords associated with the report?
Yes, the market keyword associated with the report is "Microfluidics Device Industry," which aids in identifying and referencing the specific market segment covered.
12. How do I determine which pricing option suits my needs best?
The pricing options vary based on user requirements and access needs. Individual users may opt for single-user licenses, while businesses requiring broader access may choose multi-user or enterprise licenses for cost-effective access to the report.
13. Are there any additional resources or data provided in the Microfluidics Device Industry report?
While the report offers comprehensive insights, it's advisable to review the specific contents or supplementary materials provided to ascertain if additional resources or data are available.
14. How can I stay updated on further developments or reports in the Microfluidics Device Industry?
To stay informed about further developments, trends, and reports in the Microfluidics Device Industry, consider subscribing to industry newsletters, following relevant companies and organizations, or regularly checking reputable industry news sources and publications.
Methodology
Step 1 - Identification of Relevant Samples Size from Population Database


Step 2 - Approaches for Defining Global Market Size (Value, Volume* & Price*)

Note*: In applicable scenarios
Step 3 - Data Sources
Primary Research
- Web Analytics
- Survey Reports
- Research Institute
- Latest Research Reports
- Opinion Leaders
Secondary Research
- Annual Reports
- White Paper
- Latest Press Release
- Industry Association
- Paid Database
- Investor Presentations

Step 4 - Data Triangulation
Involves using different sources of information in order to increase the validity of a study
These sources are likely to be stakeholders in a program - participants, other researchers, program staff, other community members, and so on.
Then we put all data in single framework & apply various statistical tools to find out the dynamic on the market.
During the analysis stage, feedback from the stakeholder groups would be compared to determine areas of agreement as well as areas of divergence