

Key Insights
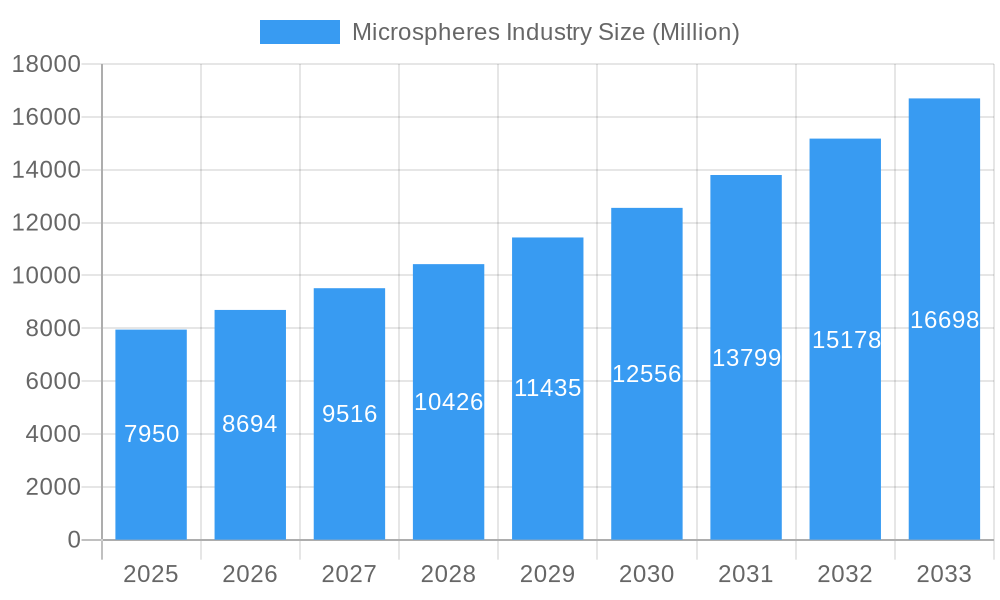
The global microspheres market, valued at $7.95 billion in 2025, is projected to experience robust growth, driven by increasing demand across diverse sectors. A compound annual growth rate (CAGR) of 9.10% from 2025 to 2033 indicates a significant expansion, reaching an estimated market size exceeding $18 billion by 2033. This growth is fueled by several key factors. The automotive and aerospace industries are major consumers, utilizing microspheres for lightweighting and enhanced material properties. The burgeoning medical technology sector leverages microspheres for drug delivery and diagnostic applications, while the cosmetics and paints & coatings industries utilize them for texture enhancement and improved performance. Technological advancements in microsphere production, leading to improved control over size, morphology, and surface functionality, further contribute to market expansion. The rising adoption of sustainable materials, including fly ash-based microspheres, is also a contributing factor, aligning with growing environmental concerns. Regional variations exist, with Asia Pacific, particularly China and India, expected to exhibit substantial growth due to rapid industrialization and increasing investment in advanced technologies.
Microspheres Industry Market Size (In Billion)
However, certain restraints could potentially impact market growth. Fluctuations in raw material prices, particularly for polymers and metals, can affect manufacturing costs and profitability. Furthermore, the stringent regulatory landscape in certain sectors, particularly medical and pharmaceutical, necessitates rigorous quality control and compliance, presenting a potential challenge for smaller market players. Despite these factors, the overall outlook for the microspheres market remains positive, driven by sustained demand across various application areas and ongoing technological innovations. The continued development of novel microsphere materials with tailored properties will likely fuel market expansion in the coming years. Competitive landscape analysis indicates a presence of both large multinational corporations and specialized niche players. Strategic partnerships and mergers and acquisitions are expected to shape the competitive dynamics in the coming years.
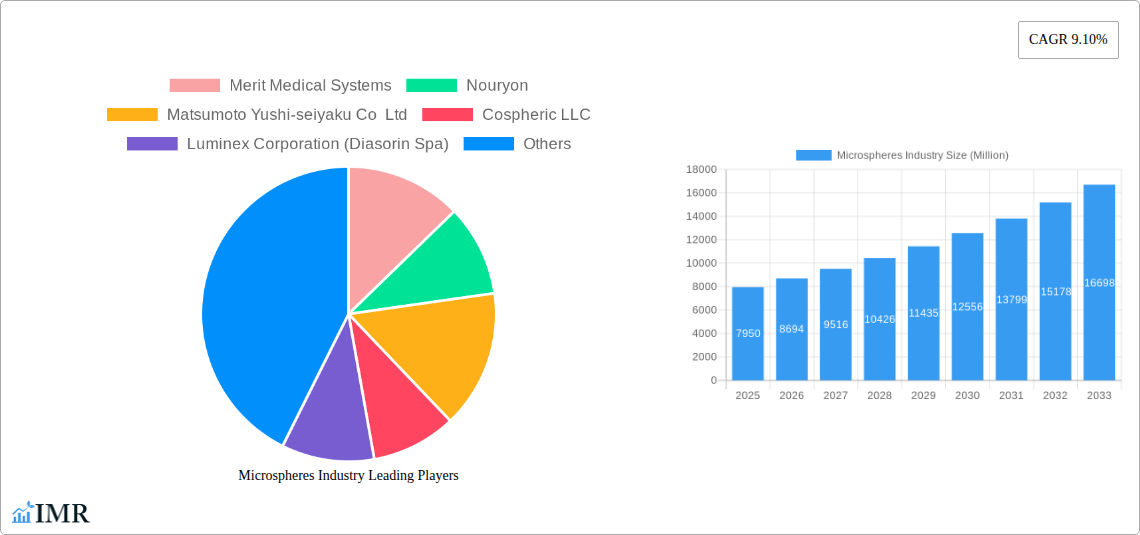
Microspheres Industry Company Market Share
Microspheres Industry Market Report: 2019-2033
This comprehensive report provides an in-depth analysis of the global microspheres market, encompassing historical data (2019-2024), current estimates (2025), and future projections (2025-2033). It segments the market by raw material (glass, polymer, ceramic, fly ash, metallic, and others), type (hollow and solid), and application (automotive, aerospace, cosmetics, oil and gas, paints and coatings, medical technology, composites, and others). This report is essential for industry professionals, investors, and researchers seeking a comprehensive understanding of this dynamic market.
Microspheres Industry Market Dynamics & Structure
The global microspheres market is characterized by moderate concentration, with several key players holding significant market share. Technological innovation, particularly in material science and manufacturing processes, is a crucial driver. Stringent regulatory frameworks, especially in sectors like medical technology and aerospace, influence product development and adoption. Competitive substitutes exist, such as alternative lightweight fillers, but microspheres’ unique properties often provide a competitive advantage. The end-user demographics are diverse, spanning numerous industries, creating varied market dynamics. M&A activity has been moderate, with strategic acquisitions aiming to expand product portfolios and market reach.
- Market Concentration: Moderately concentrated, with top 10 players holding approximately xx% of the market share in 2024.
- Technological Innovation: Focus on developing higher-strength, lighter-weight, and more cost-effective microspheres.
- Regulatory Landscape: Stringent regulations in specific industries (e.g., medical, aerospace) drive product standardization and safety testing.
- Competitive Substitutes: Alternative lightweight fillers pose some competition, particularly in price-sensitive applications.
- M&A Activity: A moderate number of mergers and acquisitions aimed at expanding product lines and geographical reach, with xx deals recorded between 2019 and 2024. xx Million in total deal value.
- Innovation Barriers: High R&D costs and stringent regulatory approvals can hinder innovation.
Microspheres Industry Growth Trends & Insights
The global microspheres market is projected to witness robust growth during the forecast period (2025-2033), driven by rising demand across various end-use sectors. The market size is estimated at xx Million units in 2025 and is projected to reach xx Million units by 2033, exhibiting a CAGR of xx% during the forecast period. Increased adoption of lightweight materials in the automotive and aerospace industries is a primary growth driver. Technological advancements, such as the development of novel microsphere materials with enhanced properties, are fueling market expansion. Consumer preference for sustainable and eco-friendly products is also positively impacting market growth. However, fluctuations in raw material prices and economic downturns may pose challenges to market expansion.
Dominant Regions, Countries, or Segments in Microspheres Industry
North America and Europe currently lead the global microspheres market, propelled by robust demand from the automotive, aerospace, and medical technology sectors. These regions benefit from established industries and significant investment in advanced materials. Concurrently, the Asia-Pacific region is projected to experience substantial growth in the coming years, driven by rapid industrialization, expanding infrastructure development, and a burgeoning manufacturing base. Within the material segments, glass microspheres maintain the largest market share, a testament to their superior mechanical properties, chemical inertness, and cost-effectiveness compared to alternative materials. The hollow microsphere type commands a dominant position due to its inherent lightweight characteristics and widespread application in sectors prioritizing weight reduction. The automotive industry stands as the primary application segment, leveraging microspheres for enhanced fuel efficiency and performance, followed closely by the aerospace and medical technology sectors, which utilize microspheres for their unique functionalities in specialized applications.
-
Key Regional Drivers:
- North America: Sustained high demand from advanced automotive manufacturing and the cutting-edge aerospace sector, complemented by continuous technological innovation and early adoption of novel materials.
- Europe: Extensive adoption of microspheres in the construction industry for insulation and lightweighting, alongside significant utilization in the automotive sector for performance enhancement and emissions reduction.
- Asia-Pacific: Phenomenal growth fueled by rapid industrialization, large-scale infrastructural development projects, and the expansion of manufacturing hubs, creating a substantial demand pipeline.
-
Dominant Segments:
- Raw Material: Glass (estimated 45-50% market share in 2024)
- Type: Hollow (estimated 60-65% market share in 2024)
- Application: Automotive (estimated 30-35% market share in 2024)
Microspheres Industry Product Landscape
The microspheres market showcases a diverse range of products tailored to specific applications. Innovations focus on enhancing properties like strength, density, and surface modification for improved compatibility with various matrices. Hollow microspheres are preferred for lightweighting, while solid microspheres find use in applications requiring high density. Performance metrics such as compressive strength, density, and particle size distribution are key parameters influencing product selection. Unique selling propositions often revolve around enhanced performance, tailored material properties, and cost-effectiveness.
Key Drivers, Barriers & Challenges in Microspheres Industry
Key Drivers: The escalating demand for lightweight materials across the automotive and aerospace industries, driven by a global focus on fuel efficiency and reduced emissions, is a primary market growth catalyst. Concurrent advancements in material science and sophisticated manufacturing processes enable the development of high-performance microspheres tailored to specific needs. Furthermore, increasingly stringent environmental regulations worldwide are promoting the adoption of sustainable and energy-efficient materials, with microspheres often fitting this profile. Government initiatives and incentives aimed at fostering the adoption of lightweight technologies in transportation, construction, and other key sectors further accelerate market expansion.
Key Challenges: Market growth can be moderated by significant challenges. Fluctuations in the prices of key raw materials, such as glass and polymers, can impact manufacturing costs and profit margins. Economic downturns and global recessions can lead to reduced demand from end-user industries. Intense competition among a growing number of manufacturers, both established and emerging, can lead to price pressures and reduced market share. Furthermore, disruptions in global supply chains and the complex, stringent regulatory requirements in highly specialized industries like medical devices and aerospace present significant hurdles for market entry and sustained operations.
Emerging Opportunities in Microspheres Industry
Untapped markets in developing economies, characterized by rapid industrial growth and increasing disposable incomes, present significant opportunities for market expansion and penetration. Innovative applications in emerging fields such as advanced 3D printing, where microspheres can enhance material properties, and energy storage technologies, where they can improve efficiency and safety, hold substantial untapped growth potential. Evolving consumer preferences worldwide are increasingly leaning towards sustainable, eco-friendly, and bio-based products, creating new avenues for the development and market penetration of green microsphere solutions. The ongoing development of microspheres with precisely engineered and tailored properties for niche applications, such as advanced drug delivery systems or specialized coatings, also opens new and lucrative market avenues.
Growth Accelerators in the Microspheres Industry
Significant growth in the microspheres industry is being propelled by continuous technological advancements in material science. These advancements are enabling the development of novel microsphere materials with enhanced and specialized properties, such as improved thermal insulation, higher strength-to-weight ratios, and unique optical characteristics. Strategic partnerships and collaborative efforts between microsphere manufacturers and key end-users are crucial growth accelerators, facilitating co-development of bespoke solutions, accelerating product innovation, and improving market access. The strategic expansion into new and emerging geographical markets, coupled with the diversification into burgeoning applications beyond traditional sectors, further propels overall market growth and resilience.
Key Players Shaping the Microspheres Industry Market
- Merit Medical Systems
- Nouryon
- Matsumoto Yushi-seiyaku Co Ltd
- Cospheric LLC
- Luminex Corporation (Diasorin Spa)
- Bangs Laboratories Inc
- 3M
- Chase Corporation
- Momentive
- Potters Industries LLC
- Siemens Healthineers AG
- Mo-sci Corporation (Heraeus Holdings)
- Kureha Corporation
- Trelleborg AB
Notable Milestones in Microspheres Industry Sector
- June 2022: Nouryon introduces expancel HP92 microspheres for automotive underbody coatings.
- February 2022: 3M glass bubbles used in NASA's liquid hydrogen storage tank insulation.
- 2021: 3M begins supplying glass bubbles to NASA Kennedy Space Center for the tank project.
In-Depth Microspheres Industry Market Outlook
The global microspheres market is firmly poised for sustained and robust growth in the foreseeable future. This positive trajectory is underpinned by continued, unwavering demand from critical industries such as automotive, aerospace, construction, and medical technology, alongside the relentless pace of technological advancements. Strategic investments in research and development (R&D) by leading market players, aimed at innovating new materials and applications, will be pivotal. Furthermore, aggressive expansion into untapped new markets and the proactive exploration of emerging applications will be key factors fueling market expansion. The increasing focus on developing sustainable, biodegradable, and eco-friendly microspheres will be a crucial determinant of future market dynamics and competitive advantage. The long-term outlook for the microspheres industry remains exceptionally positive, presenting significant and enduring opportunities for market participants to capitalize on escalating demand, evolving technological frontiers, and the growing imperative for advanced material solutions.
Microspheres Industry Segmentation
-
1. Raw Material
- 1.1. Glass
- 1.2. Polymer
- 1.3. Ceramic
- 1.4. Fly Ash
- 1.5. Metallic
- 1.6. Other Raw Materials
-
2. Type
- 2.1. Hollow
- 2.2. Soild
-
3. Application
- 3.1. Automotive
- 3.2. Aerospace
- 3.3. Cosmetics
- 3.4. Oil and Gas
- 3.5. Paints and Coatings
- 3.6. Medical Technology
- 3.7. Composites
- 3.8. Other Applications
Microspheres Industry Segmentation By Geography
-
1. Asia Pacific
- 1.1. China
- 1.2. India
- 1.3. Japan
- 1.4. South Korea
- 1.5. Rest of Asia Pacific
-
2. North America
- 2.1. United States
- 2.2. Canada
- 2.3. Mexico
-
3. Europe
- 3.1. Germany
- 3.2. United Kingdom
- 3.3. Italy
- 3.4. France
- 3.5. Rest of Europe
-
4. South America
- 4.1. Brazil
- 4.2. Argentina
- 4.3. Rest of South America
-
5. Middle East and Africa
- 5.1. Saudi Arabia
- 5.2. South Africa
- 5.3. Rest of Middle East and Africa
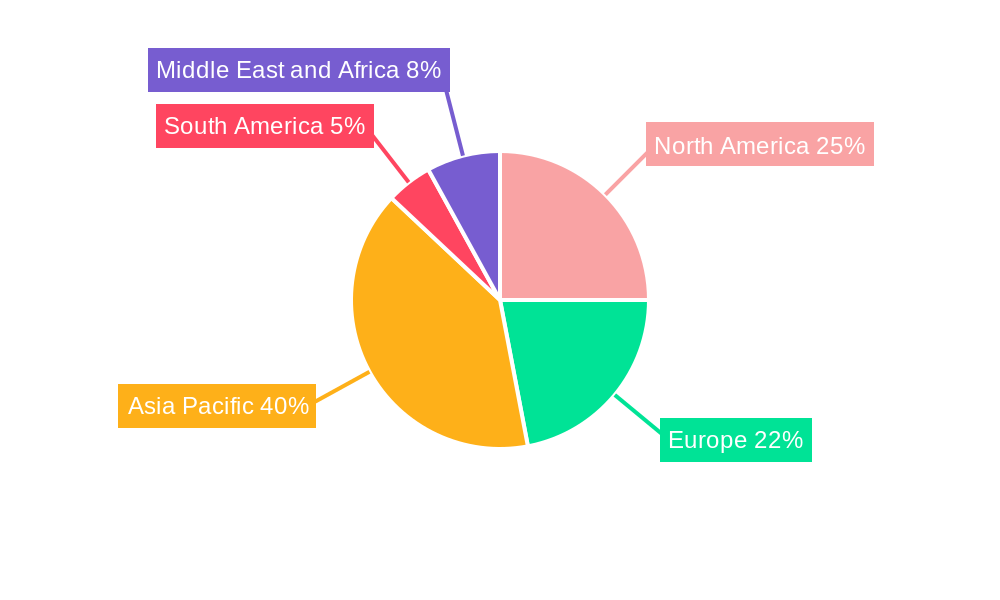
Microspheres Industry Regional Market Share
Geographic Coverage of Microspheres Industry
Microspheres Industry REPORT HIGHLIGHTS
| Aspects | Details |
|---|---|
| Study Period | 2020-2034 |
| Base Year | 2025 |
| Estimated Year | 2026 |
| Forecast Period | 2026-2034 |
| Historical Period | 2020-2025 |
| Growth Rate | CAGR of 9.10% from 2020-2034 |
| Segmentation |
|
Table of Contents
- 1. Introduction
- 1.1. Research Scope
- 1.2. Market Segmentation
- 1.3. Research Objective
- 1.4. Definitions and Assumptions
- 2. Executive Summary
- 2.1. Market Snapshot
- 3. Market Dynamics
- 3.1. Market Drivers
- 3.2. Market Restrains
- 3.3. Market Trends
- 3.4. Market Opportunities
- 4. Market Factor Analysis
- 4.1. Porters Five Forces
- 4.1.1. Bargaining Power of Suppliers
- 4.1.2. Bargaining Power of Buyers
- 4.1.3. Threat of New Entrants
- 4.1.4. Threat of Substitutes
- 4.1.5. Competitive Rivalry
- 4.2. PESTEL analysis
- 4.3. BCG Analysis
- 4.3.1. Stars (High Growth, High Market Share)
- 4.3.2. Cash Cows (Low Growth, High Market Share)
- 4.3.3. Question Mark (High Growth, Low Market Share)
- 4.3.4. Dogs (Low Growth, Low Market Share)
- 4.4. Ansoff Matrix Analysis
- 4.5. Supply Chain Analysis
- 4.6. Regulatory Landscape
- 4.7. Current Market Potential and Opportunity Assessment (TAM–SAM–SOM Framework)
- 4.8. IMR Analyst Note
- 4.1. Porters Five Forces
- 5. Market Analysis, Insights and Forecast 2021-2033
- 5.1. Market Analysis, Insights and Forecast - by Raw Material
- 5.1.1. Glass
- 5.1.2. Polymer
- 5.1.3. Ceramic
- 5.1.4. Fly Ash
- 5.1.5. Metallic
- 5.1.6. Other Raw Materials
- 5.2. Market Analysis, Insights and Forecast - by Type
- 5.2.1. Hollow
- 5.2.2. Soild
- 5.3. Market Analysis, Insights and Forecast - by Application
- 5.3.1. Automotive
- 5.3.2. Aerospace
- 5.3.3. Cosmetics
- 5.3.4. Oil and Gas
- 5.3.5. Paints and Coatings
- 5.3.6. Medical Technology
- 5.3.7. Composites
- 5.3.8. Other Applications
- 5.4. Market Analysis, Insights and Forecast - by Region
- 5.4.1. Asia Pacific
- 5.4.2. North America
- 5.4.3. Europe
- 5.4.4. South America
- 5.4.5. Middle East and Africa
- 5.1. Market Analysis, Insights and Forecast - by Raw Material
- 6. Global Microspheres Industry Analysis, Insights and Forecast, 2021-2033
- 6.1. Market Analysis, Insights and Forecast - by Raw Material
- 6.1.1. Glass
- 6.1.2. Polymer
- 6.1.3. Ceramic
- 6.1.4. Fly Ash
- 6.1.5. Metallic
- 6.1.6. Other Raw Materials
- 6.2. Market Analysis, Insights and Forecast - by Type
- 6.2.1. Hollow
- 6.2.2. Soild
- 6.3. Market Analysis, Insights and Forecast - by Application
- 6.3.1. Automotive
- 6.3.2. Aerospace
- 6.3.3. Cosmetics
- 6.3.4. Oil and Gas
- 6.3.5. Paints and Coatings
- 6.3.6. Medical Technology
- 6.3.7. Composites
- 6.3.8. Other Applications
- 6.1. Market Analysis, Insights and Forecast - by Raw Material
- 7. Asia Pacific Microspheres Industry Analysis, Insights and Forecast, 2020-2032
- 7.1. Market Analysis, Insights and Forecast - by Raw Material
- 7.1.1. Glass
- 7.1.2. Polymer
- 7.1.3. Ceramic
- 7.1.4. Fly Ash
- 7.1.5. Metallic
- 7.1.6. Other Raw Materials
- 7.2. Market Analysis, Insights and Forecast - by Type
- 7.2.1. Hollow
- 7.2.2. Soild
- 7.3. Market Analysis, Insights and Forecast - by Application
- 7.3.1. Automotive
- 7.3.2. Aerospace
- 7.3.3. Cosmetics
- 7.3.4. Oil and Gas
- 7.3.5. Paints and Coatings
- 7.3.6. Medical Technology
- 7.3.7. Composites
- 7.3.8. Other Applications
- 7.1. Market Analysis, Insights and Forecast - by Raw Material
- 8. North America Microspheres Industry Analysis, Insights and Forecast, 2020-2032
- 8.1. Market Analysis, Insights and Forecast - by Raw Material
- 8.1.1. Glass
- 8.1.2. Polymer
- 8.1.3. Ceramic
- 8.1.4. Fly Ash
- 8.1.5. Metallic
- 8.1.6. Other Raw Materials
- 8.2. Market Analysis, Insights and Forecast - by Type
- 8.2.1. Hollow
- 8.2.2. Soild
- 8.3. Market Analysis, Insights and Forecast - by Application
- 8.3.1. Automotive
- 8.3.2. Aerospace
- 8.3.3. Cosmetics
- 8.3.4. Oil and Gas
- 8.3.5. Paints and Coatings
- 8.3.6. Medical Technology
- 8.3.7. Composites
- 8.3.8. Other Applications
- 8.1. Market Analysis, Insights and Forecast - by Raw Material
- 9. Europe Microspheres Industry Analysis, Insights and Forecast, 2020-2032
- 9.1. Market Analysis, Insights and Forecast - by Raw Material
- 9.1.1. Glass
- 9.1.2. Polymer
- 9.1.3. Ceramic
- 9.1.4. Fly Ash
- 9.1.5. Metallic
- 9.1.6. Other Raw Materials
- 9.2. Market Analysis, Insights and Forecast - by Type
- 9.2.1. Hollow
- 9.2.2. Soild
- 9.3. Market Analysis, Insights and Forecast - by Application
- 9.3.1. Automotive
- 9.3.2. Aerospace
- 9.3.3. Cosmetics
- 9.3.4. Oil and Gas
- 9.3.5. Paints and Coatings
- 9.3.6. Medical Technology
- 9.3.7. Composites
- 9.3.8. Other Applications
- 9.1. Market Analysis, Insights and Forecast - by Raw Material
- 10. South America Microspheres Industry Analysis, Insights and Forecast, 2020-2032
- 10.1. Market Analysis, Insights and Forecast - by Raw Material
- 10.1.1. Glass
- 10.1.2. Polymer
- 10.1.3. Ceramic
- 10.1.4. Fly Ash
- 10.1.5. Metallic
- 10.1.6. Other Raw Materials
- 10.2. Market Analysis, Insights and Forecast - by Type
- 10.2.1. Hollow
- 10.2.2. Soild
- 10.3. Market Analysis, Insights and Forecast - by Application
- 10.3.1. Automotive
- 10.3.2. Aerospace
- 10.3.3. Cosmetics
- 10.3.4. Oil and Gas
- 10.3.5. Paints and Coatings
- 10.3.6. Medical Technology
- 10.3.7. Composites
- 10.3.8. Other Applications
- 10.1. Market Analysis, Insights and Forecast - by Raw Material
- 11. Middle East and Africa Microspheres Industry Analysis, Insights and Forecast, 2020-2032
- 11.1. Market Analysis, Insights and Forecast - by Raw Material
- 11.1.1. Glass
- 11.1.2. Polymer
- 11.1.3. Ceramic
- 11.1.4. Fly Ash
- 11.1.5. Metallic
- 11.1.6. Other Raw Materials
- 11.2. Market Analysis, Insights and Forecast - by Type
- 11.2.1. Hollow
- 11.2.2. Soild
- 11.3. Market Analysis, Insights and Forecast - by Application
- 11.3.1. Automotive
- 11.3.2. Aerospace
- 11.3.3. Cosmetics
- 11.3.4. Oil and Gas
- 11.3.5. Paints and Coatings
- 11.3.6. Medical Technology
- 11.3.7. Composites
- 11.3.8. Other Applications
- 11.1. Market Analysis, Insights and Forecast - by Raw Material
- 12. Competitive Analysis
- 12.1. Company Profiles
- 12.1.1 Merit Medical Systems
- 12.1.1.1. Company Overview
- 12.1.1.2. Products
- 12.1.1.3. Company Financials
- 12.1.1.4. SWOT Analysis
- 12.1.2 Nouryon
- 12.1.2.1. Company Overview
- 12.1.2.2. Products
- 12.1.2.3. Company Financials
- 12.1.2.4. SWOT Analysis
- 12.1.3 Matsumoto Yushi-seiyaku Co Ltd
- 12.1.3.1. Company Overview
- 12.1.3.2. Products
- 12.1.3.3. Company Financials
- 12.1.3.4. SWOT Analysis
- 12.1.4 Cospheric LLC
- 12.1.4.1. Company Overview
- 12.1.4.2. Products
- 12.1.4.3. Company Financials
- 12.1.4.4. SWOT Analysis
- 12.1.5 Luminex Corporation (Diasorin Spa)
- 12.1.5.1. Company Overview
- 12.1.5.2. Products
- 12.1.5.3. Company Financials
- 12.1.5.4. SWOT Analysis
- 12.1.6 Bangs Laboratories Inc
- 12.1.6.1. Company Overview
- 12.1.6.2. Products
- 12.1.6.3. Company Financials
- 12.1.6.4. SWOT Analysis
- 12.1.7 3M
- 12.1.7.1. Company Overview
- 12.1.7.2. Products
- 12.1.7.3. Company Financials
- 12.1.7.4. SWOT Analysis
- 12.1.8 Chase Corporation
- 12.1.8.1. Company Overview
- 12.1.8.2. Products
- 12.1.8.3. Company Financials
- 12.1.8.4. SWOT Analysis
- 12.1.9 Momentive
- 12.1.9.1. Company Overview
- 12.1.9.2. Products
- 12.1.9.3. Company Financials
- 12.1.9.4. SWOT Analysis
- 12.1.10 Potters Industries LLC
- 12.1.10.1. Company Overview
- 12.1.10.2. Products
- 12.1.10.3. Company Financials
- 12.1.10.4. SWOT Analysis
- 12.1.11 Siemens Healthineers AG
- 12.1.11.1. Company Overview
- 12.1.11.2. Products
- 12.1.11.3. Company Financials
- 12.1.11.4. SWOT Analysis
- 12.1.12 Mo-sci Corporation (Heraeus Holdings)
- 12.1.12.1. Company Overview
- 12.1.12.2. Products
- 12.1.12.3. Company Financials
- 12.1.12.4. SWOT Analysis
- 12.1.13 Kureha Corporation
- 12.1.13.1. Company Overview
- 12.1.13.2. Products
- 12.1.13.3. Company Financials
- 12.1.13.4. SWOT Analysis
- 12.1.14 Trelleborg AB*List Not Exhaustive
- 12.1.14.1. Company Overview
- 12.1.14.2. Products
- 12.1.14.3. Company Financials
- 12.1.14.4. SWOT Analysis
- 12.1.1 Merit Medical Systems
- 12.2. Market Entropy
- 12.2.1 Company's Key Areas Served
- 12.2.2 Recent Developments
- 12.3. Company Market Share Analysis 2025
- 12.3.1 Top 5 Companies Market Share Analysis
- 12.3.2 Top 3 Companies Market Share Analysis
- 12.4. List of Potential Customers
- 13. Research Methodology
List of Figures
- Figure 1: Global Microspheres Industry Revenue Breakdown (Million, %) by Region 2025 & 2033
- Figure 2: Asia Pacific Microspheres Industry Revenue (Million), by Raw Material 2025 & 2033
- Figure 3: Asia Pacific Microspheres Industry Revenue Share (%), by Raw Material 2025 & 2033
- Figure 4: Asia Pacific Microspheres Industry Revenue (Million), by Type 2025 & 2033
- Figure 5: Asia Pacific Microspheres Industry Revenue Share (%), by Type 2025 & 2033
- Figure 6: Asia Pacific Microspheres Industry Revenue (Million), by Application 2025 & 2033
- Figure 7: Asia Pacific Microspheres Industry Revenue Share (%), by Application 2025 & 2033
- Figure 8: Asia Pacific Microspheres Industry Revenue (Million), by Country 2025 & 2033
- Figure 9: Asia Pacific Microspheres Industry Revenue Share (%), by Country 2025 & 2033
- Figure 10: North America Microspheres Industry Revenue (Million), by Raw Material 2025 & 2033
- Figure 11: North America Microspheres Industry Revenue Share (%), by Raw Material 2025 & 2033
- Figure 12: North America Microspheres Industry Revenue (Million), by Type 2025 & 2033
- Figure 13: North America Microspheres Industry Revenue Share (%), by Type 2025 & 2033
- Figure 14: North America Microspheres Industry Revenue (Million), by Application 2025 & 2033
- Figure 15: North America Microspheres Industry Revenue Share (%), by Application 2025 & 2033
- Figure 16: North America Microspheres Industry Revenue (Million), by Country 2025 & 2033
- Figure 17: North America Microspheres Industry Revenue Share (%), by Country 2025 & 2033
- Figure 18: Europe Microspheres Industry Revenue (Million), by Raw Material 2025 & 2033
- Figure 19: Europe Microspheres Industry Revenue Share (%), by Raw Material 2025 & 2033
- Figure 20: Europe Microspheres Industry Revenue (Million), by Type 2025 & 2033
- Figure 21: Europe Microspheres Industry Revenue Share (%), by Type 2025 & 2033
- Figure 22: Europe Microspheres Industry Revenue (Million), by Application 2025 & 2033
- Figure 23: Europe Microspheres Industry Revenue Share (%), by Application 2025 & 2033
- Figure 24: Europe Microspheres Industry Revenue (Million), by Country 2025 & 2033
- Figure 25: Europe Microspheres Industry Revenue Share (%), by Country 2025 & 2033
- Figure 26: South America Microspheres Industry Revenue (Million), by Raw Material 2025 & 2033
- Figure 27: South America Microspheres Industry Revenue Share (%), by Raw Material 2025 & 2033
- Figure 28: South America Microspheres Industry Revenue (Million), by Type 2025 & 2033
- Figure 29: South America Microspheres Industry Revenue Share (%), by Type 2025 & 2033
- Figure 30: South America Microspheres Industry Revenue (Million), by Application 2025 & 2033
- Figure 31: South America Microspheres Industry Revenue Share (%), by Application 2025 & 2033
- Figure 32: South America Microspheres Industry Revenue (Million), by Country 2025 & 2033
- Figure 33: South America Microspheres Industry Revenue Share (%), by Country 2025 & 2033
- Figure 34: Middle East and Africa Microspheres Industry Revenue (Million), by Raw Material 2025 & 2033
- Figure 35: Middle East and Africa Microspheres Industry Revenue Share (%), by Raw Material 2025 & 2033
- Figure 36: Middle East and Africa Microspheres Industry Revenue (Million), by Type 2025 & 2033
- Figure 37: Middle East and Africa Microspheres Industry Revenue Share (%), by Type 2025 & 2033
- Figure 38: Middle East and Africa Microspheres Industry Revenue (Million), by Application 2025 & 2033
- Figure 39: Middle East and Africa Microspheres Industry Revenue Share (%), by Application 2025 & 2033
- Figure 40: Middle East and Africa Microspheres Industry Revenue (Million), by Country 2025 & 2033
- Figure 41: Middle East and Africa Microspheres Industry Revenue Share (%), by Country 2025 & 2033
List of Tables
- Table 1: Global Microspheres Industry Revenue Million Forecast, by Raw Material 2020 & 2033
- Table 2: Global Microspheres Industry Revenue Million Forecast, by Type 2020 & 2033
- Table 3: Global Microspheres Industry Revenue Million Forecast, by Application 2020 & 2033
- Table 4: Global Microspheres Industry Revenue Million Forecast, by Region 2020 & 2033
- Table 5: Global Microspheres Industry Revenue Million Forecast, by Raw Material 2020 & 2033
- Table 6: Global Microspheres Industry Revenue Million Forecast, by Type 2020 & 2033
- Table 7: Global Microspheres Industry Revenue Million Forecast, by Application 2020 & 2033
- Table 8: Global Microspheres Industry Revenue Million Forecast, by Country 2020 & 2033
- Table 9: China Microspheres Industry Revenue (Million) Forecast, by Application 2020 & 2033
- Table 10: India Microspheres Industry Revenue (Million) Forecast, by Application 2020 & 2033
- Table 11: Japan Microspheres Industry Revenue (Million) Forecast, by Application 2020 & 2033
- Table 12: South Korea Microspheres Industry Revenue (Million) Forecast, by Application 2020 & 2033
- Table 13: Rest of Asia Pacific Microspheres Industry Revenue (Million) Forecast, by Application 2020 & 2033
- Table 14: Global Microspheres Industry Revenue Million Forecast, by Raw Material 2020 & 2033
- Table 15: Global Microspheres Industry Revenue Million Forecast, by Type 2020 & 2033
- Table 16: Global Microspheres Industry Revenue Million Forecast, by Application 2020 & 2033
- Table 17: Global Microspheres Industry Revenue Million Forecast, by Country 2020 & 2033
- Table 18: United States Microspheres Industry Revenue (Million) Forecast, by Application 2020 & 2033
- Table 19: Canada Microspheres Industry Revenue (Million) Forecast, by Application 2020 & 2033
- Table 20: Mexico Microspheres Industry Revenue (Million) Forecast, by Application 2020 & 2033
- Table 21: Global Microspheres Industry Revenue Million Forecast, by Raw Material 2020 & 2033
- Table 22: Global Microspheres Industry Revenue Million Forecast, by Type 2020 & 2033
- Table 23: Global Microspheres Industry Revenue Million Forecast, by Application 2020 & 2033
- Table 24: Global Microspheres Industry Revenue Million Forecast, by Country 2020 & 2033
- Table 25: Germany Microspheres Industry Revenue (Million) Forecast, by Application 2020 & 2033
- Table 26: United Kingdom Microspheres Industry Revenue (Million) Forecast, by Application 2020 & 2033
- Table 27: Italy Microspheres Industry Revenue (Million) Forecast, by Application 2020 & 2033
- Table 28: France Microspheres Industry Revenue (Million) Forecast, by Application 2020 & 2033
- Table 29: Rest of Europe Microspheres Industry Revenue (Million) Forecast, by Application 2020 & 2033
- Table 30: Global Microspheres Industry Revenue Million Forecast, by Raw Material 2020 & 2033
- Table 31: Global Microspheres Industry Revenue Million Forecast, by Type 2020 & 2033
- Table 32: Global Microspheres Industry Revenue Million Forecast, by Application 2020 & 2033
- Table 33: Global Microspheres Industry Revenue Million Forecast, by Country 2020 & 2033
- Table 34: Brazil Microspheres Industry Revenue (Million) Forecast, by Application 2020 & 2033
- Table 35: Argentina Microspheres Industry Revenue (Million) Forecast, by Application 2020 & 2033
- Table 36: Rest of South America Microspheres Industry Revenue (Million) Forecast, by Application 2020 & 2033
- Table 37: Global Microspheres Industry Revenue Million Forecast, by Raw Material 2020 & 2033
- Table 38: Global Microspheres Industry Revenue Million Forecast, by Type 2020 & 2033
- Table 39: Global Microspheres Industry Revenue Million Forecast, by Application 2020 & 2033
- Table 40: Global Microspheres Industry Revenue Million Forecast, by Country 2020 & 2033
- Table 41: Saudi Arabia Microspheres Industry Revenue (Million) Forecast, by Application 2020 & 2033
- Table 42: South Africa Microspheres Industry Revenue (Million) Forecast, by Application 2020 & 2033
- Table 43: Rest of Middle East and Africa Microspheres Industry Revenue (Million) Forecast, by Application 2020 & 2033
Frequently Asked Questions
1. What is the projected Compound Annual Growth Rate (CAGR) of the Microspheres Industry?
The projected CAGR is approximately 9.10%.
2. Which companies are prominent players in the Microspheres Industry?
Key companies in the market include Merit Medical Systems, Nouryon, Matsumoto Yushi-seiyaku Co Ltd, Cospheric LLC, Luminex Corporation (Diasorin Spa), Bangs Laboratories Inc, 3M, Chase Corporation, Momentive, Potters Industries LLC, Siemens Healthineers AG, Mo-sci Corporation (Heraeus Holdings), Kureha Corporation, Trelleborg AB*List Not Exhaustive.
3. What are the main segments of the Microspheres Industry?
The market segments include Raw Material, Type, Application.
4. Can you provide details about the market size?
The market size is estimated to be USD 7.95 Million as of 2022.
5. What are some drivers contributing to market growth?
Increasing Application and Advancements in Medical Industry; Increasing Demand from Cosmetics Industry.
6. What are the notable trends driving market growth?
Increasing Usage in the Medical Technology.
7. Are there any restraints impacting market growth?
High Production and Research and Development Cost.
8. Can you provide examples of recent developments in the market?
In June 2022, Nouryon introduced expancel HP92 microspheres to reduce weight and withstand high pressure in underbody coatings and sealants for the automotive industry. These microspheres are currently produced in Stockvik, Sweden, with production expected in Green Bay, Wisconsin, the United States, in early 2023.
9. What pricing options are available for accessing the report?
Pricing options include single-user, multi-user, and enterprise licenses priced at USD 4750, USD 5250, and USD 8750 respectively.
10. Is the market size provided in terms of value or volume?
The market size is provided in terms of value, measured in Million.
11. Are there any specific market keywords associated with the report?
Yes, the market keyword associated with the report is "Microspheres Industry," which aids in identifying and referencing the specific market segment covered.
12. How do I determine which pricing option suits my needs best?
The pricing options vary based on user requirements and access needs. Individual users may opt for single-user licenses, while businesses requiring broader access may choose multi-user or enterprise licenses for cost-effective access to the report.
13. Are there any additional resources or data provided in the Microspheres Industry report?
While the report offers comprehensive insights, it's advisable to review the specific contents or supplementary materials provided to ascertain if additional resources or data are available.
14. How can I stay updated on further developments or reports in the Microspheres Industry?
To stay informed about further developments, trends, and reports in the Microspheres Industry, consider subscribing to industry newsletters, following relevant companies and organizations, or regularly checking reputable industry news sources and publications.
Methodology
Step 1 - Identification of Relevant Samples Size from Population Database


Step 2 - Approaches for Defining Global Market Size (Value, Volume* & Price*)

Note*: In applicable scenarios
Step 3 - Data Sources
Primary Research
- Web Analytics
- Survey Reports
- Research Institute
- Latest Research Reports
- Opinion Leaders
Secondary Research
- Annual Reports
- White Paper
- Latest Press Release
- Industry Association
- Paid Database
- Investor Presentations

Step 4 - Data Triangulation
Involves using different sources of information in order to increase the validity of a study
These sources are likely to be stakeholders in a program - participants, other researchers, program staff, other community members, and so on.
Then we put all data in single framework & apply various statistical tools to find out the dynamic on the market.
During the analysis stage, feedback from the stakeholder groups would be compared to determine areas of agreement as well as areas of divergence