

Key Insights
The global Mobile Electro-hydraulic Operation Table market is poised for significant expansion, projected to reach USD 9.36 billion in 2025, with an impressive compound annual growth rate (CAGR) of 13.25% during the forecast period of 2025-2033. This robust growth is primarily fueled by increasing investments in healthcare infrastructure, particularly in emerging economies, and the rising demand for advanced surgical procedures. The growing prevalence of chronic diseases, the aging global population, and the continuous technological advancements in medical equipment are all contributing to this upward trajectory. Furthermore, the drive towards enhancing patient safety and surgical efficiency in operating rooms necessitates the adoption of sophisticated electro-hydraulic tables, which offer superior maneuverability, precision, and ergonomic benefits for surgical teams. This market is witnessing a surge in demand driven by the increasing complexity of surgical interventions and the need for versatile operating room solutions that can accommodate a wide range of medical specialties.
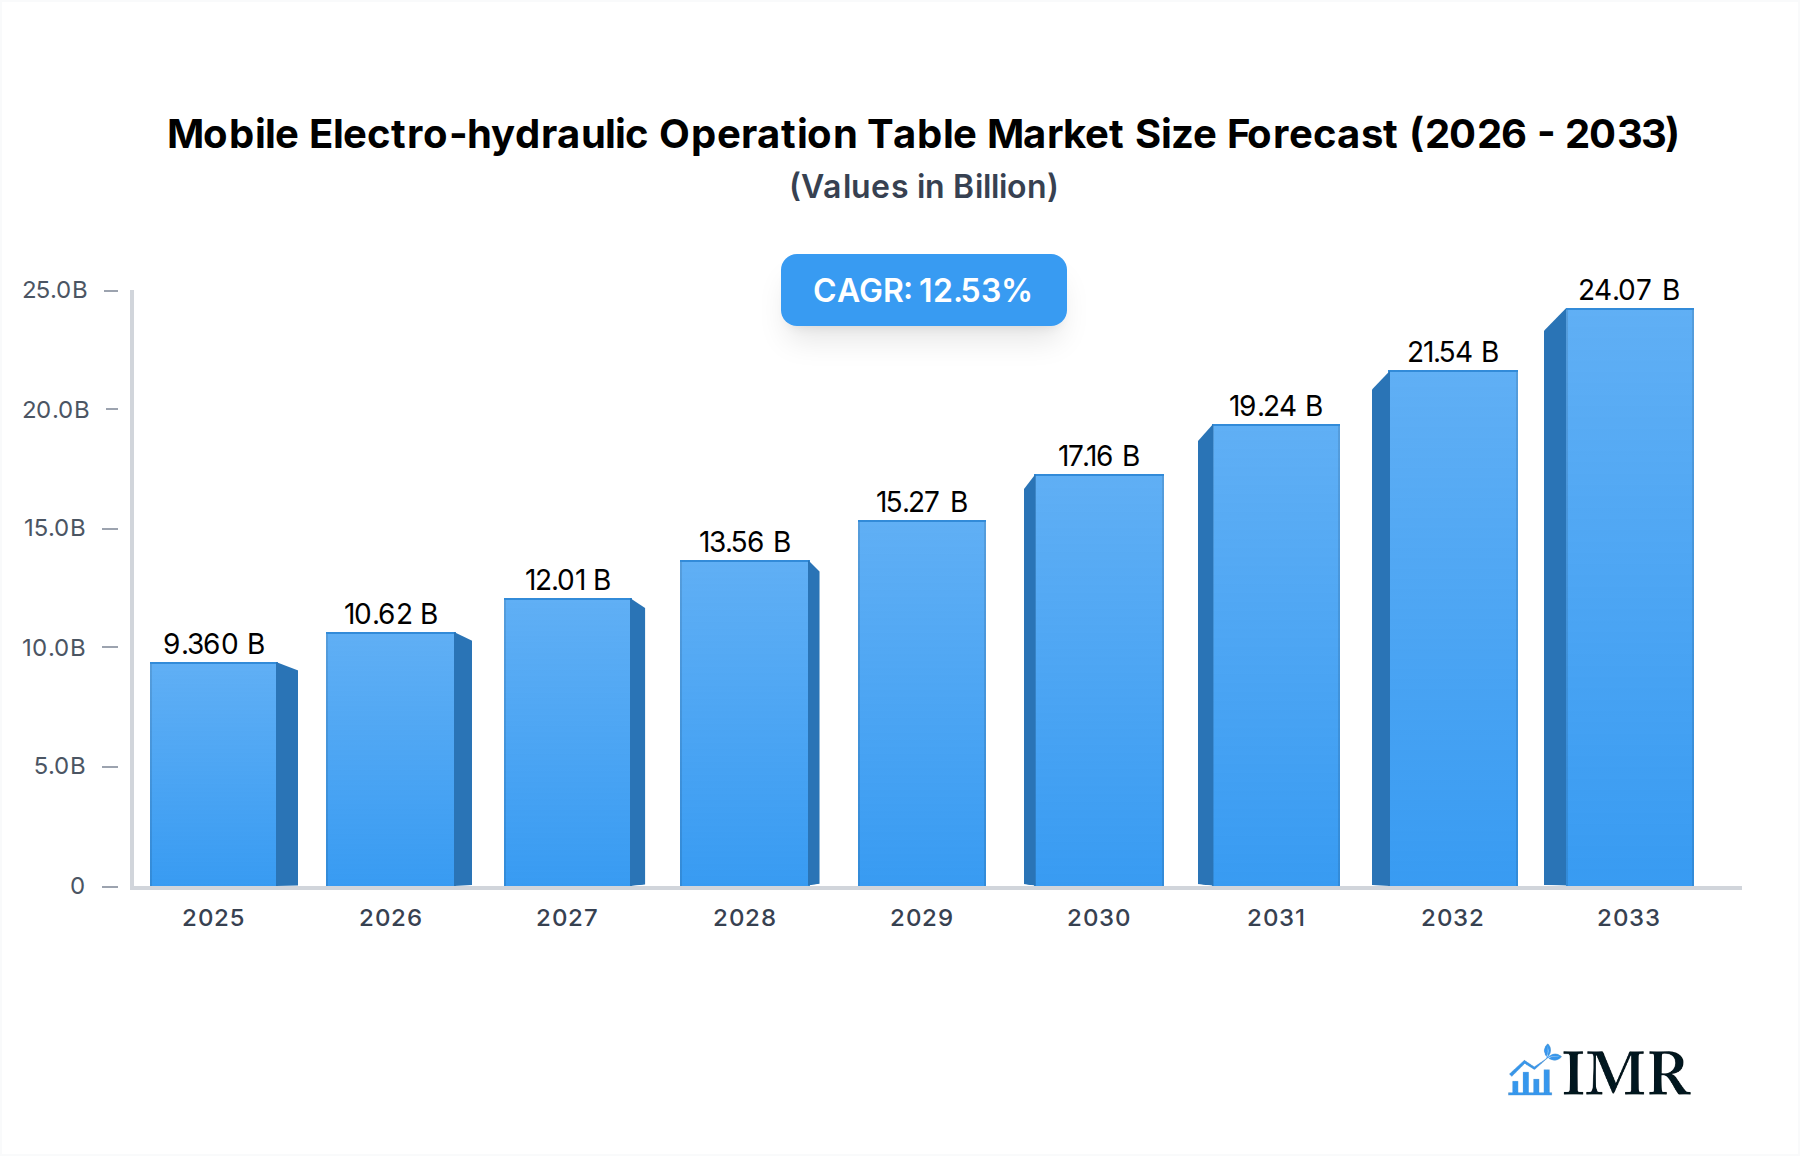
Mobile Electro-hydraulic Operation Table Market Size (In Billion)
The market segmentation reveals a dynamic landscape with specific growth areas. In terms of applications, hospitals are expected to dominate, owing to their higher patient volumes and the need for advanced surgical suites. Clinics are also emerging as a significant segment, driven by the increasing trend of day surgeries and specialized procedures performed in outpatient settings. The "Others" category, encompassing specialized surgical centers and diagnostic facilities, will also contribute to market growth. By type, dedicated operating tables, designed for specific surgical disciplines, will witness strong demand due to their specialized functionalities. However, universal operating tables, offering versatility and adaptability across various procedures, will also maintain a substantial market share. Geographically, the Asia Pacific region is anticipated to be the fastest-growing market, propelled by rapid healthcare modernization in countries like China and India, coupled with expanding medical tourism. North America and Europe will continue to hold significant market shares due to well-established healthcare systems and a high adoption rate of advanced medical technologies.

Mobile Electro-hydraulic Operation Table Company Market Share
Mobile Electro-hydraulic Operation Table Market Dynamics & Structure
The Mobile Electro-hydraulic Operation Table market is characterized by a moderately concentrated structure, with key players like Getinge, JW Holdings, and Braun & Co. holding significant market shares. Technological innovation is a primary driver, with ongoing advancements in electro-hydraulic systems, enhanced patient safety features, and improved ergonomic designs. Regulatory frameworks, including stringent medical device approvals and quality standards, play a crucial role in market entry and product development. Competitive product substitutes include manual operation tables and more basic electro-mechanical models, but the precision and ease of use of electro-hydraulic systems provide a competitive edge. End-user demographics, primarily hospitals and specialized clinics, are increasingly demanding sophisticated, versatile, and mobile operating tables to accommodate diverse surgical procedures and optimize workflow. Mergers and acquisitions (M&A) are a strategic trend, with companies seeking to expand their product portfolios, geographical reach, and technological capabilities. For instance, recent M&A activities have focused on integrating smart features and advanced imaging compatibility into operation tables. The market concentration is further influenced by the high capital investment required for advanced manufacturing and R&D.
- Market Concentration: Moderately concentrated with established global players.
- Technological Innovation Drivers: Precision control, enhanced patient safety, ergonomic design, automation, and digital integration.
- Regulatory Frameworks: FDA, CE marking, and country-specific medical device regulations.
- Competitive Product Substitutes: Manual operation tables, electro-mechanical tables, specialized fixed tables.
- End-User Demographics: Hospitals (general surgery, specialized surgical departments), outpatient surgical centers, specialized clinics.
- M&A Trends: Consolidation for portfolio expansion, market share acquisition, and technological integration. Example: Getinge's acquisition of Arjo to strengthen its surgical workflow solutions.
Mobile Electro-hydraulic Operation Table Growth Trends & Insights
The global Mobile Electro-hydraulic Operation Table market is poised for robust growth, projected to expand significantly from an estimated USD 3.2 billion in 2025 to USD 4.8 billion by 2033, exhibiting a Compound Annual Growth Rate (CAGR) of approximately 5.2% during the forecast period of 2025–2033. This expansion is fueled by the escalating demand for advanced surgical equipment in healthcare facilities worldwide, driven by an aging global population and the increasing prevalence of chronic diseases requiring surgical intervention. The adoption rate of electro-hydraulic operation tables is steadily rising due to their superior precision, ease of maneuverability, and enhanced patient comfort compared to older technologies. Technological disruptions, such as the integration of AI for surgical guidance and real-time monitoring, along with the development of ultra-thin and lightweight designs, are further accelerating market penetration. Consumer behavior is shifting towards sophisticated, multi-functional operating tables that can cater to a wider array of surgical specialties, from general surgery to complex orthopedic and neurosurgical procedures. The base year of 2025 marks a pivotal point, with significant investments in hospital infrastructure and upgrades to surgical suites contributing to the immediate market surge. Historical data from 2019–2024 indicates a steady upward trend, with a market size of approximately USD 2.8 billion in 2024, demonstrating a resilient growth trajectory even amidst global economic fluctuations. The emphasis on minimally invasive surgeries also necessitates highly adaptable and precise operating tables, further boosting demand. The market penetration is expected to deepen as healthcare providers recognize the long-term benefits of investing in state-of-the-art surgical equipment, including improved surgical outcomes and operational efficiency. The increasing disposable income in developing economies also plays a vital role in driving market growth, enabling more healthcare institutions to procure advanced medical devices. The continued evolution of surgical techniques and the demand for patient-centric care are paramount in shaping the market's trajectory.
Dominant Regions, Countries, or Segments in Mobile Electro-hydraulic Operation Table
North America, particularly the United States, stands out as the dominant region in the Mobile Electro-hydraulic Operation Table market, driven by its advanced healthcare infrastructure, high healthcare expenditure, and a strong emphasis on adopting cutting-edge medical technologies. The region's robust demand for specialized surgical procedures, coupled with a high concentration of leading hospitals and research institutions, creates a fertile ground for the market's expansion. The Hospital application segment is the primary growth engine, accounting for the largest market share, estimated at 78% of the total market in 2025. This dominance is attributed to the comprehensive surgical capabilities of hospitals, which require versatile and high-performance operating tables for a wide range of specialties. The Universal Operating Table type also holds a significant advantage, estimated at 65% market share, due to its adaptability across various surgical disciplines, offering flexibility and cost-effectiveness for healthcare providers.
- Dominant Region: North America, with the United States leading due to high healthcare spending and technological adoption.
- Leading Application Segment: Hospitals, driven by comprehensive surgical needs and advanced procedures.
- Market Share (Estimated 2025): 78%
- Key Drivers: High volume of surgeries, specialized departments, investment in advanced infrastructure.
- Leading Type Segment: Universal Operating Table, due to its versatility and broad applicability.
- Market Share (Estimated 2025): 65%
- Key Drivers: Flexibility for multiple surgical specialties, cost-effectiveness, adaptability to evolving surgical needs.
- Key Drivers in Dominant Segments:
- Economic Policies: Favorable reimbursement policies for surgical procedures and medical device investments.
- Infrastructure Development: Continuous upgrades and expansions of hospital facilities, including operating rooms.
- Technological Advancement: Early adoption of new technologies and demand for sophisticated equipment.
- Surgeon Preference: A preference for advanced, ergonomic, and precision-controlled tables among surgical professionals.
- Market Penetration: High existing market penetration with a continuous cycle of replacement and upgrade of existing equipment.
Mobile Electro-hydraulic Operation Table Product Landscape
The Mobile Electro-hydraulic Operation Table product landscape is characterized by continuous innovation focused on enhancing surgical precision, patient safety, and operational efficiency. Leading manufacturers are introducing tables with advanced electro-hydraulic systems for smooth, precise movements, memory function for pre-set positions, and integrated power supply for various surgical instruments. Features such as X-ray compatibility, advanced padding for enhanced patient comfort, and modular designs for adaptable configurations are becoming standard. BenQ Medical Technology, for instance, offers tables with intuitive control panels and robust build quality. Narang Medical emphasizes ergonomic designs for surgeons' ease of use. The integration of digital interfaces and connectivity for surgical planning and data logging is also a growing trend, distinguishing premium models.
Key Drivers, Barriers & Challenges in Mobile Electro-hydraulic Operation Table
Key Drivers:
The mobile electro-hydraulic operation table market is propelled by the escalating demand for advanced surgical procedures, a growing aging population requiring more surgical interventions, and increasing healthcare investments globally. Technological advancements in precision control, patient safety features, and ergonomic designs are significant catalysts. The drive towards minimally invasive surgery also necessitates highly adaptable and specialized operating tables. For example, the increasing number of bariatric surgeries requires tables with higher weight capacities and enhanced stability.
Barriers & Challenges:
High initial investment costs for these sophisticated tables present a significant barrier, particularly for smaller clinics and hospitals in developing economies. Stringent regulatory approvals and compliance requirements add to development and market entry costs. The availability of cost-effective refurbished or older models can also impact the adoption of new units. Supply chain disruptions for critical electronic components and a shortage of skilled technicians for installation and maintenance pose ongoing challenges. Competitive pressures from established players and the threat of technological obsolescence also contribute to market complexities.
Emerging Opportunities in Mobile Electro-hydraulic Operation Table
Emerging opportunities lie in the development of smart operating tables integrated with AI for real-time surgical guidance and predictive maintenance. The growing demand for specialized operating tables for niche surgical fields like robotic surgery and interventional radiology presents significant untapped potential. Expanding into emerging economies with rapidly developing healthcare infrastructure and increasing healthcare expenditure also offers substantial growth prospects. Furthermore, focusing on modular and customizable table designs that can be adapted for various surgical needs can cater to a broader customer base.
Growth Accelerators in the Mobile Electro-hydraulic Operation Table Industry
The long-term growth of the Mobile Electro-hydraulic Operation Table industry is being accelerated by continuous technological breakthroughs, such as the integration of advanced imaging capabilities and sensor technology for precise patient positioning. Strategic partnerships between medical device manufacturers and surgical technology companies are fostering innovation and creating integrated surgical workflow solutions. Market expansion strategies, including targeting underserved regions and developing tiered product offerings to cater to different budget levels, are also crucial growth accelerators. The increasing adoption of telehealth and remote surgical consultation could also drive demand for connected and remotely operable operating tables.
Key Players Shaping the Mobile Electro-hydraulic Operation Table Market
- Getinge
- JW Holdings
- Braun & Co.
- ASCO Medical
- SternMed GmbH
- BenQ Medical Technology
- Confident Dental Equipments
- medifa
- Koinaa Medical Equipments
- Shenzhen Mindray
- Beijing Aeonmed
- Shandong Weigao Group
- Famed Zywiec
- Torontech
- Mediland
- Narang Medical
- SaiKang Medical
- Zhangjiagang Medi Medical Equipment
- Comen
- Heal Force
- BiHealthcare
- HOWELL Medical
Notable Milestones in Mobile Electro-hydraulic Operation Table Sector
- 2019: Introduction of advanced memory functions for pre-set surgical positions by several leading manufacturers.
- 2020: Increased focus on enhanced patient comfort and pressure redistribution in operating table padding.
- 2021: Development of more compact and lightweight electro-hydraulic tables to improve maneuverability in smaller surgical suites.
- 2022: Integration of basic connectivity features for data logging and diagnostic purposes.
- 2023: Launch of enhanced X-ray transparent table tops for improved intraoperative imaging.
- 2024: Growing adoption of touch-screen interfaces for intuitive table control and customization.
In-Depth Mobile Electro-hydraulic Operation Table Market Outlook
The Mobile Electro-hydraulic Operation Table market is set for sustained and significant growth, driven by ongoing technological advancements and increasing global demand for sophisticated surgical solutions. Key growth accelerators include the continued innovation in smart table functionalities, such as AI-powered positioning assistance and real-time patient monitoring, alongside strategic alliances that foster comprehensive surgical workflow integration. The expansion into emerging markets, coupled with product diversification to meet varied healthcare needs and budgets, will unlock new revenue streams. The market's future trajectory is strongly linked to its ability to adapt to evolving surgical techniques and provide end-to-end solutions that enhance surgical outcomes and operational efficiencies for healthcare providers worldwide.
Mobile Electro-hydraulic Operation Table Segmentation
-
1. Application
- 1.1. Hospital
- 1.2. Clinic
- 1.3. Others
-
2. Types
- 2.1. Dedicated Operating Table
- 2.2. Universal Operating Table
Mobile Electro-hydraulic Operation Table Segmentation By Geography
-
1. North America
- 1.1. United States
- 1.2. Canada
- 1.3. Mexico
-
2. South America
- 2.1. Brazil
- 2.2. Argentina
- 2.3. Rest of South America
-
3. Europe
- 3.1. United Kingdom
- 3.2. Germany
- 3.3. France
- 3.4. Italy
- 3.5. Spain
- 3.6. Russia
- 3.7. Benelux
- 3.8. Nordics
- 3.9. Rest of Europe
-
4. Middle East & Africa
- 4.1. Turkey
- 4.2. Israel
- 4.3. GCC
- 4.4. North Africa
- 4.5. South Africa
- 4.6. Rest of Middle East & Africa
-
5. Asia Pacific
- 5.1. China
- 5.2. India
- 5.3. Japan
- 5.4. South Korea
- 5.5. ASEAN
- 5.6. Oceania
- 5.7. Rest of Asia Pacific
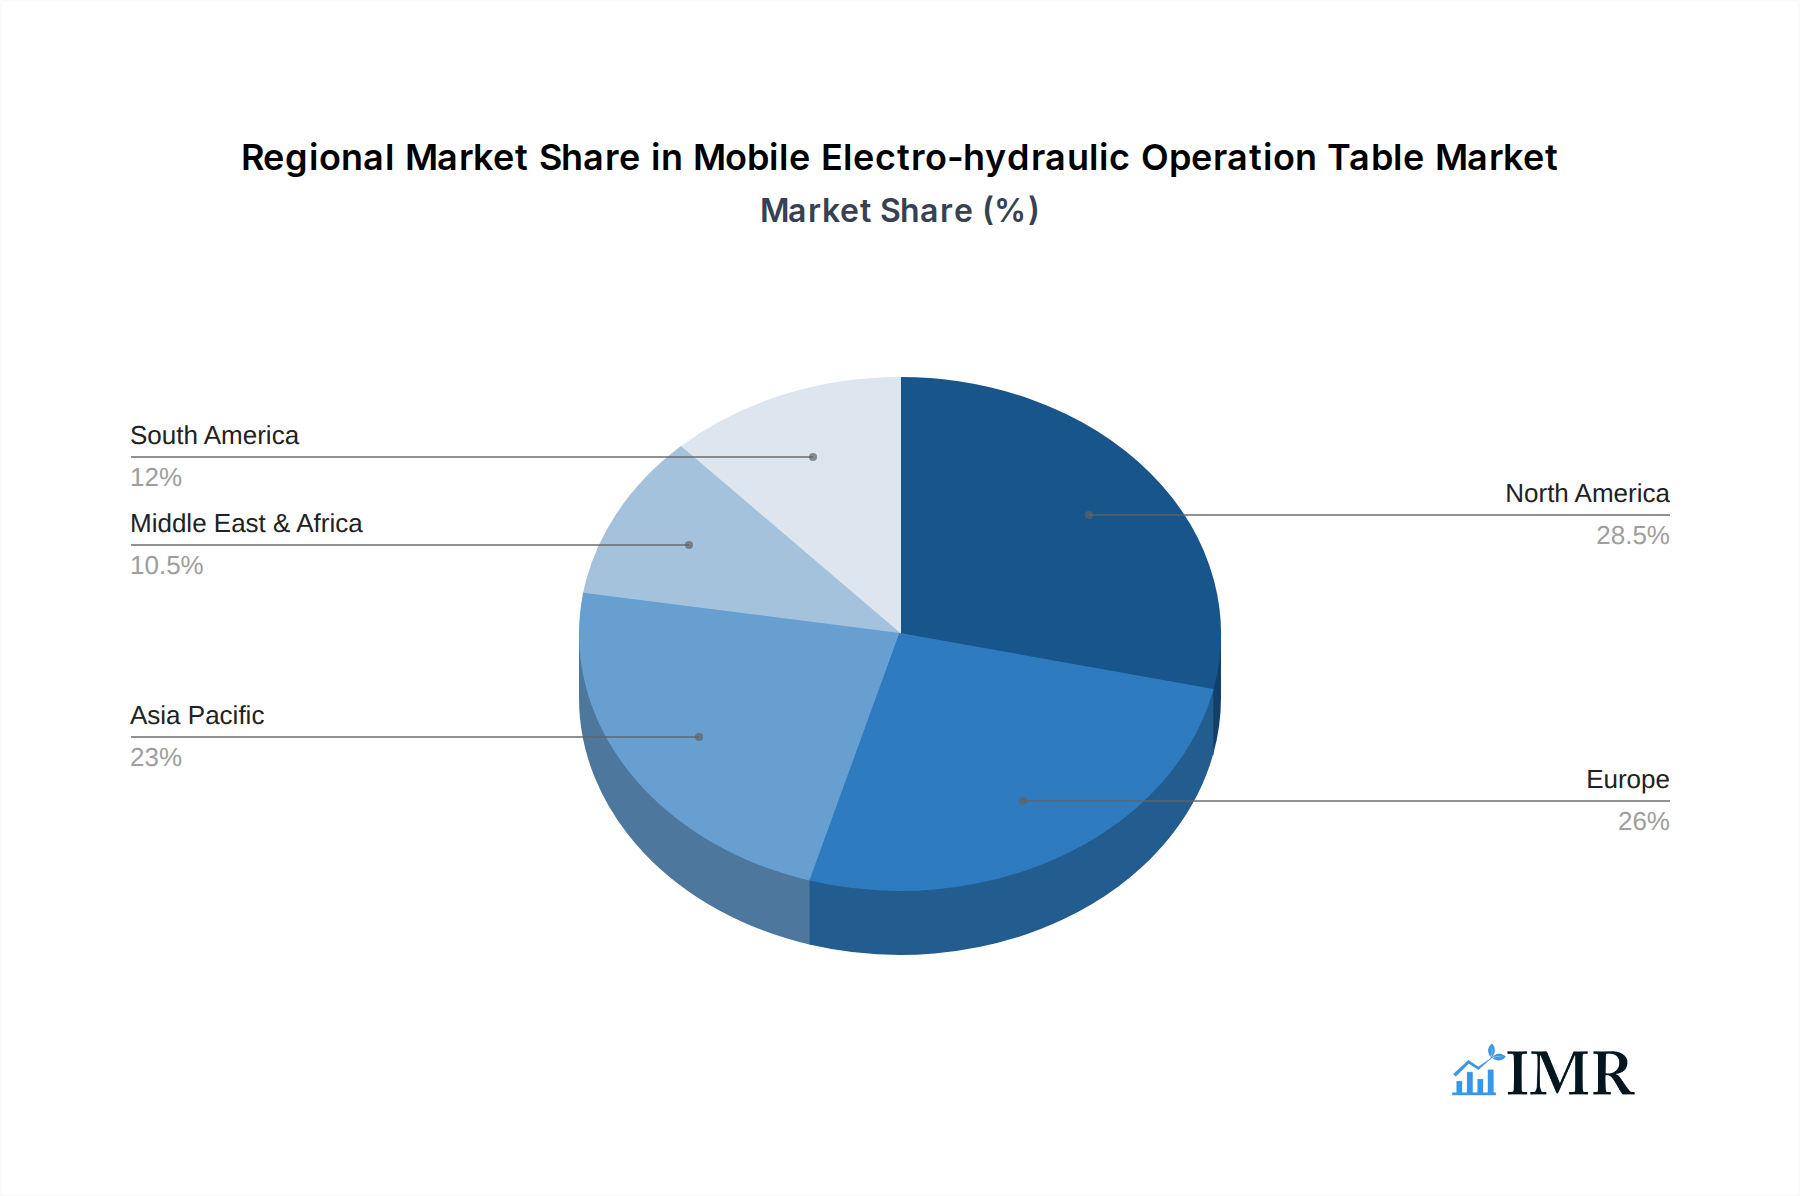
Mobile Electro-hydraulic Operation Table Regional Market Share
Geographic Coverage of Mobile Electro-hydraulic Operation Table
Mobile Electro-hydraulic Operation Table REPORT HIGHLIGHTS
| Aspects | Details |
|---|---|
| Study Period | 2020-2034 |
| Base Year | 2025 |
| Estimated Year | 2026 |
| Forecast Period | 2026-2034 |
| Historical Period | 2020-2025 |
| Growth Rate | CAGR of 13.25% from 2020-2034 |
| Segmentation |
|
Table of Contents
- 1. Introduction
- 1.1. Research Scope
- 1.2. Market Segmentation
- 1.3. Research Methodology
- 1.4. Definitions and Assumptions
- 2. Executive Summary
- 2.1. Introduction
- 3. Market Dynamics
- 3.1. Introduction
- 3.2. Market Drivers
- 3.3. Market Restrains
- 3.4. Market Trends
- 4. Market Factor Analysis
- 4.1. Porters Five Forces
- 4.2. Supply/Value Chain
- 4.3. PESTEL analysis
- 4.4. Market Entropy
- 4.5. Patent/Trademark Analysis
- 5. Global Mobile Electro-hydraulic Operation Table Analysis, Insights and Forecast, 2020-2032
- 5.1. Market Analysis, Insights and Forecast - by Application
- 5.1.1. Hospital
- 5.1.2. Clinic
- 5.1.3. Others
- 5.2. Market Analysis, Insights and Forecast - by Types
- 5.2.1. Dedicated Operating Table
- 5.2.2. Universal Operating Table
- 5.3. Market Analysis, Insights and Forecast - by Region
- 5.3.1. North America
- 5.3.2. South America
- 5.3.3. Europe
- 5.3.4. Middle East & Africa
- 5.3.5. Asia Pacific
- 5.1. Market Analysis, Insights and Forecast - by Application
- 6. North America Mobile Electro-hydraulic Operation Table Analysis, Insights and Forecast, 2020-2032
- 6.1. Market Analysis, Insights and Forecast - by Application
- 6.1.1. Hospital
- 6.1.2. Clinic
- 6.1.3. Others
- 6.2. Market Analysis, Insights and Forecast - by Types
- 6.2.1. Dedicated Operating Table
- 6.2.2. Universal Operating Table
- 6.1. Market Analysis, Insights and Forecast - by Application
- 7. South America Mobile Electro-hydraulic Operation Table Analysis, Insights and Forecast, 2020-2032
- 7.1. Market Analysis, Insights and Forecast - by Application
- 7.1.1. Hospital
- 7.1.2. Clinic
- 7.1.3. Others
- 7.2. Market Analysis, Insights and Forecast - by Types
- 7.2.1. Dedicated Operating Table
- 7.2.2. Universal Operating Table
- 7.1. Market Analysis, Insights and Forecast - by Application
- 8. Europe Mobile Electro-hydraulic Operation Table Analysis, Insights and Forecast, 2020-2032
- 8.1. Market Analysis, Insights and Forecast - by Application
- 8.1.1. Hospital
- 8.1.2. Clinic
- 8.1.3. Others
- 8.2. Market Analysis, Insights and Forecast - by Types
- 8.2.1. Dedicated Operating Table
- 8.2.2. Universal Operating Table
- 8.1. Market Analysis, Insights and Forecast - by Application
- 9. Middle East & Africa Mobile Electro-hydraulic Operation Table Analysis, Insights and Forecast, 2020-2032
- 9.1. Market Analysis, Insights and Forecast - by Application
- 9.1.1. Hospital
- 9.1.2. Clinic
- 9.1.3. Others
- 9.2. Market Analysis, Insights and Forecast - by Types
- 9.2.1. Dedicated Operating Table
- 9.2.2. Universal Operating Table
- 9.1. Market Analysis, Insights and Forecast - by Application
- 10. Asia Pacific Mobile Electro-hydraulic Operation Table Analysis, Insights and Forecast, 2020-2032
- 10.1. Market Analysis, Insights and Forecast - by Application
- 10.1.1. Hospital
- 10.1.2. Clinic
- 10.1.3. Others
- 10.2. Market Analysis, Insights and Forecast - by Types
- 10.2.1. Dedicated Operating Table
- 10.2.2. Universal Operating Table
- 10.1. Market Analysis, Insights and Forecast - by Application
- 11. Competitive Analysis
- 11.1. Global Market Share Analysis 2025
- 11.2. Company Profiles
- 11.2.1 Getinge
- 11.2.1.1. Overview
- 11.2.1.2. Products
- 11.2.1.3. SWOT Analysis
- 11.2.1.4. Recent Developments
- 11.2.1.5. Financials (Based on Availability)
- 11.2.2 JW Holdings
- 11.2.2.1. Overview
- 11.2.2.2. Products
- 11.2.2.3. SWOT Analysis
- 11.2.2.4. Recent Developments
- 11.2.2.5. Financials (Based on Availability)
- 11.2.3 Braun & Co.
- 11.2.3.1. Overview
- 11.2.3.2. Products
- 11.2.3.3. SWOT Analysis
- 11.2.3.4. Recent Developments
- 11.2.3.5. Financials (Based on Availability)
- 11.2.4 ASCO Medical
- 11.2.4.1. Overview
- 11.2.4.2. Products
- 11.2.4.3. SWOT Analysis
- 11.2.4.4. Recent Developments
- 11.2.4.5. Financials (Based on Availability)
- 11.2.5 SternMed GmbH
- 11.2.5.1. Overview
- 11.2.5.2. Products
- 11.2.5.3. SWOT Analysis
- 11.2.5.4. Recent Developments
- 11.2.5.5. Financials (Based on Availability)
- 11.2.6 BenQ Medical Technology
- 11.2.6.1. Overview
- 11.2.6.2. Products
- 11.2.6.3. SWOT Analysis
- 11.2.6.4. Recent Developments
- 11.2.6.5. Financials (Based on Availability)
- 11.2.7 Confident Dental Equipments
- 11.2.7.1. Overview
- 11.2.7.2. Products
- 11.2.7.3. SWOT Analysis
- 11.2.7.4. Recent Developments
- 11.2.7.5. Financials (Based on Availability)
- 11.2.8 medifa
- 11.2.8.1. Overview
- 11.2.8.2. Products
- 11.2.8.3. SWOT Analysis
- 11.2.8.4. Recent Developments
- 11.2.8.5. Financials (Based on Availability)
- 11.2.9 Koinaa Medical Equipments
- 11.2.9.1. Overview
- 11.2.9.2. Products
- 11.2.9.3. SWOT Analysis
- 11.2.9.4. Recent Developments
- 11.2.9.5. Financials (Based on Availability)
- 11.2.10 Shenzhen Mindray
- 11.2.10.1. Overview
- 11.2.10.2. Products
- 11.2.10.3. SWOT Analysis
- 11.2.10.4. Recent Developments
- 11.2.10.5. Financials (Based on Availability)
- 11.2.11 Beijing Aeonmed
- 11.2.11.1. Overview
- 11.2.11.2. Products
- 11.2.11.3. SWOT Analysis
- 11.2.11.4. Recent Developments
- 11.2.11.5. Financials (Based on Availability)
- 11.2.12 Shandong Weigao Group
- 11.2.12.1. Overview
- 11.2.12.2. Products
- 11.2.12.3. SWOT Analysis
- 11.2.12.4. Recent Developments
- 11.2.12.5. Financials (Based on Availability)
- 11.2.13 Famed Zywiec
- 11.2.13.1. Overview
- 11.2.13.2. Products
- 11.2.13.3. SWOT Analysis
- 11.2.13.4. Recent Developments
- 11.2.13.5. Financials (Based on Availability)
- 11.2.14 Torontech
- 11.2.14.1. Overview
- 11.2.14.2. Products
- 11.2.14.3. SWOT Analysis
- 11.2.14.4. Recent Developments
- 11.2.14.5. Financials (Based on Availability)
- 11.2.15 Mediland
- 11.2.15.1. Overview
- 11.2.15.2. Products
- 11.2.15.3. SWOT Analysis
- 11.2.15.4. Recent Developments
- 11.2.15.5. Financials (Based on Availability)
- 11.2.16 Narang Medical
- 11.2.16.1. Overview
- 11.2.16.2. Products
- 11.2.16.3. SWOT Analysis
- 11.2.16.4. Recent Developments
- 11.2.16.5. Financials (Based on Availability)
- 11.2.17 SaiKang Medical
- 11.2.17.1. Overview
- 11.2.17.2. Products
- 11.2.17.3. SWOT Analysis
- 11.2.17.4. Recent Developments
- 11.2.17.5. Financials (Based on Availability)
- 11.2.18 Zhangjiagang Medi Medical Equipment
- 11.2.18.1. Overview
- 11.2.18.2. Products
- 11.2.18.3. SWOT Analysis
- 11.2.18.4. Recent Developments
- 11.2.18.5. Financials (Based on Availability)
- 11.2.19 Comen
- 11.2.19.1. Overview
- 11.2.19.2. Products
- 11.2.19.3. SWOT Analysis
- 11.2.19.4. Recent Developments
- 11.2.19.5. Financials (Based on Availability)
- 11.2.20 Heal Force
- 11.2.20.1. Overview
- 11.2.20.2. Products
- 11.2.20.3. SWOT Analysis
- 11.2.20.4. Recent Developments
- 11.2.20.5. Financials (Based on Availability)
- 11.2.21 BiHealthcare
- 11.2.21.1. Overview
- 11.2.21.2. Products
- 11.2.21.3. SWOT Analysis
- 11.2.21.4. Recent Developments
- 11.2.21.5. Financials (Based on Availability)
- 11.2.22 HOWELL Medical
- 11.2.22.1. Overview
- 11.2.22.2. Products
- 11.2.22.3. SWOT Analysis
- 11.2.22.4. Recent Developments
- 11.2.22.5. Financials (Based on Availability)
- 11.2.1 Getinge
List of Figures
- Figure 1: Global Mobile Electro-hydraulic Operation Table Revenue Breakdown (billion, %) by Region 2025 & 2033
- Figure 2: Global Mobile Electro-hydraulic Operation Table Volume Breakdown (K, %) by Region 2025 & 2033
- Figure 3: North America Mobile Electro-hydraulic Operation Table Revenue (billion), by Application 2025 & 2033
- Figure 4: North America Mobile Electro-hydraulic Operation Table Volume (K), by Application 2025 & 2033
- Figure 5: North America Mobile Electro-hydraulic Operation Table Revenue Share (%), by Application 2025 & 2033
- Figure 6: North America Mobile Electro-hydraulic Operation Table Volume Share (%), by Application 2025 & 2033
- Figure 7: North America Mobile Electro-hydraulic Operation Table Revenue (billion), by Types 2025 & 2033
- Figure 8: North America Mobile Electro-hydraulic Operation Table Volume (K), by Types 2025 & 2033
- Figure 9: North America Mobile Electro-hydraulic Operation Table Revenue Share (%), by Types 2025 & 2033
- Figure 10: North America Mobile Electro-hydraulic Operation Table Volume Share (%), by Types 2025 & 2033
- Figure 11: North America Mobile Electro-hydraulic Operation Table Revenue (billion), by Country 2025 & 2033
- Figure 12: North America Mobile Electro-hydraulic Operation Table Volume (K), by Country 2025 & 2033
- Figure 13: North America Mobile Electro-hydraulic Operation Table Revenue Share (%), by Country 2025 & 2033
- Figure 14: North America Mobile Electro-hydraulic Operation Table Volume Share (%), by Country 2025 & 2033
- Figure 15: South America Mobile Electro-hydraulic Operation Table Revenue (billion), by Application 2025 & 2033
- Figure 16: South America Mobile Electro-hydraulic Operation Table Volume (K), by Application 2025 & 2033
- Figure 17: South America Mobile Electro-hydraulic Operation Table Revenue Share (%), by Application 2025 & 2033
- Figure 18: South America Mobile Electro-hydraulic Operation Table Volume Share (%), by Application 2025 & 2033
- Figure 19: South America Mobile Electro-hydraulic Operation Table Revenue (billion), by Types 2025 & 2033
- Figure 20: South America Mobile Electro-hydraulic Operation Table Volume (K), by Types 2025 & 2033
- Figure 21: South America Mobile Electro-hydraulic Operation Table Revenue Share (%), by Types 2025 & 2033
- Figure 22: South America Mobile Electro-hydraulic Operation Table Volume Share (%), by Types 2025 & 2033
- Figure 23: South America Mobile Electro-hydraulic Operation Table Revenue (billion), by Country 2025 & 2033
- Figure 24: South America Mobile Electro-hydraulic Operation Table Volume (K), by Country 2025 & 2033
- Figure 25: South America Mobile Electro-hydraulic Operation Table Revenue Share (%), by Country 2025 & 2033
- Figure 26: South America Mobile Electro-hydraulic Operation Table Volume Share (%), by Country 2025 & 2033
- Figure 27: Europe Mobile Electro-hydraulic Operation Table Revenue (billion), by Application 2025 & 2033
- Figure 28: Europe Mobile Electro-hydraulic Operation Table Volume (K), by Application 2025 & 2033
- Figure 29: Europe Mobile Electro-hydraulic Operation Table Revenue Share (%), by Application 2025 & 2033
- Figure 30: Europe Mobile Electro-hydraulic Operation Table Volume Share (%), by Application 2025 & 2033
- Figure 31: Europe Mobile Electro-hydraulic Operation Table Revenue (billion), by Types 2025 & 2033
- Figure 32: Europe Mobile Electro-hydraulic Operation Table Volume (K), by Types 2025 & 2033
- Figure 33: Europe Mobile Electro-hydraulic Operation Table Revenue Share (%), by Types 2025 & 2033
- Figure 34: Europe Mobile Electro-hydraulic Operation Table Volume Share (%), by Types 2025 & 2033
- Figure 35: Europe Mobile Electro-hydraulic Operation Table Revenue (billion), by Country 2025 & 2033
- Figure 36: Europe Mobile Electro-hydraulic Operation Table Volume (K), by Country 2025 & 2033
- Figure 37: Europe Mobile Electro-hydraulic Operation Table Revenue Share (%), by Country 2025 & 2033
- Figure 38: Europe Mobile Electro-hydraulic Operation Table Volume Share (%), by Country 2025 & 2033
- Figure 39: Middle East & Africa Mobile Electro-hydraulic Operation Table Revenue (billion), by Application 2025 & 2033
- Figure 40: Middle East & Africa Mobile Electro-hydraulic Operation Table Volume (K), by Application 2025 & 2033
- Figure 41: Middle East & Africa Mobile Electro-hydraulic Operation Table Revenue Share (%), by Application 2025 & 2033
- Figure 42: Middle East & Africa Mobile Electro-hydraulic Operation Table Volume Share (%), by Application 2025 & 2033
- Figure 43: Middle East & Africa Mobile Electro-hydraulic Operation Table Revenue (billion), by Types 2025 & 2033
- Figure 44: Middle East & Africa Mobile Electro-hydraulic Operation Table Volume (K), by Types 2025 & 2033
- Figure 45: Middle East & Africa Mobile Electro-hydraulic Operation Table Revenue Share (%), by Types 2025 & 2033
- Figure 46: Middle East & Africa Mobile Electro-hydraulic Operation Table Volume Share (%), by Types 2025 & 2033
- Figure 47: Middle East & Africa Mobile Electro-hydraulic Operation Table Revenue (billion), by Country 2025 & 2033
- Figure 48: Middle East & Africa Mobile Electro-hydraulic Operation Table Volume (K), by Country 2025 & 2033
- Figure 49: Middle East & Africa Mobile Electro-hydraulic Operation Table Revenue Share (%), by Country 2025 & 2033
- Figure 50: Middle East & Africa Mobile Electro-hydraulic Operation Table Volume Share (%), by Country 2025 & 2033
- Figure 51: Asia Pacific Mobile Electro-hydraulic Operation Table Revenue (billion), by Application 2025 & 2033
- Figure 52: Asia Pacific Mobile Electro-hydraulic Operation Table Volume (K), by Application 2025 & 2033
- Figure 53: Asia Pacific Mobile Electro-hydraulic Operation Table Revenue Share (%), by Application 2025 & 2033
- Figure 54: Asia Pacific Mobile Electro-hydraulic Operation Table Volume Share (%), by Application 2025 & 2033
- Figure 55: Asia Pacific Mobile Electro-hydraulic Operation Table Revenue (billion), by Types 2025 & 2033
- Figure 56: Asia Pacific Mobile Electro-hydraulic Operation Table Volume (K), by Types 2025 & 2033
- Figure 57: Asia Pacific Mobile Electro-hydraulic Operation Table Revenue Share (%), by Types 2025 & 2033
- Figure 58: Asia Pacific Mobile Electro-hydraulic Operation Table Volume Share (%), by Types 2025 & 2033
- Figure 59: Asia Pacific Mobile Electro-hydraulic Operation Table Revenue (billion), by Country 2025 & 2033
- Figure 60: Asia Pacific Mobile Electro-hydraulic Operation Table Volume (K), by Country 2025 & 2033
- Figure 61: Asia Pacific Mobile Electro-hydraulic Operation Table Revenue Share (%), by Country 2025 & 2033
- Figure 62: Asia Pacific Mobile Electro-hydraulic Operation Table Volume Share (%), by Country 2025 & 2033
List of Tables
- Table 1: Global Mobile Electro-hydraulic Operation Table Revenue billion Forecast, by Application 2020 & 2033
- Table 2: Global Mobile Electro-hydraulic Operation Table Volume K Forecast, by Application 2020 & 2033
- Table 3: Global Mobile Electro-hydraulic Operation Table Revenue billion Forecast, by Types 2020 & 2033
- Table 4: Global Mobile Electro-hydraulic Operation Table Volume K Forecast, by Types 2020 & 2033
- Table 5: Global Mobile Electro-hydraulic Operation Table Revenue billion Forecast, by Region 2020 & 2033
- Table 6: Global Mobile Electro-hydraulic Operation Table Volume K Forecast, by Region 2020 & 2033
- Table 7: Global Mobile Electro-hydraulic Operation Table Revenue billion Forecast, by Application 2020 & 2033
- Table 8: Global Mobile Electro-hydraulic Operation Table Volume K Forecast, by Application 2020 & 2033
- Table 9: Global Mobile Electro-hydraulic Operation Table Revenue billion Forecast, by Types 2020 & 2033
- Table 10: Global Mobile Electro-hydraulic Operation Table Volume K Forecast, by Types 2020 & 2033
- Table 11: Global Mobile Electro-hydraulic Operation Table Revenue billion Forecast, by Country 2020 & 2033
- Table 12: Global Mobile Electro-hydraulic Operation Table Volume K Forecast, by Country 2020 & 2033
- Table 13: United States Mobile Electro-hydraulic Operation Table Revenue (billion) Forecast, by Application 2020 & 2033
- Table 14: United States Mobile Electro-hydraulic Operation Table Volume (K) Forecast, by Application 2020 & 2033
- Table 15: Canada Mobile Electro-hydraulic Operation Table Revenue (billion) Forecast, by Application 2020 & 2033
- Table 16: Canada Mobile Electro-hydraulic Operation Table Volume (K) Forecast, by Application 2020 & 2033
- Table 17: Mexico Mobile Electro-hydraulic Operation Table Revenue (billion) Forecast, by Application 2020 & 2033
- Table 18: Mexico Mobile Electro-hydraulic Operation Table Volume (K) Forecast, by Application 2020 & 2033
- Table 19: Global Mobile Electro-hydraulic Operation Table Revenue billion Forecast, by Application 2020 & 2033
- Table 20: Global Mobile Electro-hydraulic Operation Table Volume K Forecast, by Application 2020 & 2033
- Table 21: Global Mobile Electro-hydraulic Operation Table Revenue billion Forecast, by Types 2020 & 2033
- Table 22: Global Mobile Electro-hydraulic Operation Table Volume K Forecast, by Types 2020 & 2033
- Table 23: Global Mobile Electro-hydraulic Operation Table Revenue billion Forecast, by Country 2020 & 2033
- Table 24: Global Mobile Electro-hydraulic Operation Table Volume K Forecast, by Country 2020 & 2033
- Table 25: Brazil Mobile Electro-hydraulic Operation Table Revenue (billion) Forecast, by Application 2020 & 2033
- Table 26: Brazil Mobile Electro-hydraulic Operation Table Volume (K) Forecast, by Application 2020 & 2033
- Table 27: Argentina Mobile Electro-hydraulic Operation Table Revenue (billion) Forecast, by Application 2020 & 2033
- Table 28: Argentina Mobile Electro-hydraulic Operation Table Volume (K) Forecast, by Application 2020 & 2033
- Table 29: Rest of South America Mobile Electro-hydraulic Operation Table Revenue (billion) Forecast, by Application 2020 & 2033
- Table 30: Rest of South America Mobile Electro-hydraulic Operation Table Volume (K) Forecast, by Application 2020 & 2033
- Table 31: Global Mobile Electro-hydraulic Operation Table Revenue billion Forecast, by Application 2020 & 2033
- Table 32: Global Mobile Electro-hydraulic Operation Table Volume K Forecast, by Application 2020 & 2033
- Table 33: Global Mobile Electro-hydraulic Operation Table Revenue billion Forecast, by Types 2020 & 2033
- Table 34: Global Mobile Electro-hydraulic Operation Table Volume K Forecast, by Types 2020 & 2033
- Table 35: Global Mobile Electro-hydraulic Operation Table Revenue billion Forecast, by Country 2020 & 2033
- Table 36: Global Mobile Electro-hydraulic Operation Table Volume K Forecast, by Country 2020 & 2033
- Table 37: United Kingdom Mobile Electro-hydraulic Operation Table Revenue (billion) Forecast, by Application 2020 & 2033
- Table 38: United Kingdom Mobile Electro-hydraulic Operation Table Volume (K) Forecast, by Application 2020 & 2033
- Table 39: Germany Mobile Electro-hydraulic Operation Table Revenue (billion) Forecast, by Application 2020 & 2033
- Table 40: Germany Mobile Electro-hydraulic Operation Table Volume (K) Forecast, by Application 2020 & 2033
- Table 41: France Mobile Electro-hydraulic Operation Table Revenue (billion) Forecast, by Application 2020 & 2033
- Table 42: France Mobile Electro-hydraulic Operation Table Volume (K) Forecast, by Application 2020 & 2033
- Table 43: Italy Mobile Electro-hydraulic Operation Table Revenue (billion) Forecast, by Application 2020 & 2033
- Table 44: Italy Mobile Electro-hydraulic Operation Table Volume (K) Forecast, by Application 2020 & 2033
- Table 45: Spain Mobile Electro-hydraulic Operation Table Revenue (billion) Forecast, by Application 2020 & 2033
- Table 46: Spain Mobile Electro-hydraulic Operation Table Volume (K) Forecast, by Application 2020 & 2033
- Table 47: Russia Mobile Electro-hydraulic Operation Table Revenue (billion) Forecast, by Application 2020 & 2033
- Table 48: Russia Mobile Electro-hydraulic Operation Table Volume (K) Forecast, by Application 2020 & 2033
- Table 49: Benelux Mobile Electro-hydraulic Operation Table Revenue (billion) Forecast, by Application 2020 & 2033
- Table 50: Benelux Mobile Electro-hydraulic Operation Table Volume (K) Forecast, by Application 2020 & 2033
- Table 51: Nordics Mobile Electro-hydraulic Operation Table Revenue (billion) Forecast, by Application 2020 & 2033
- Table 52: Nordics Mobile Electro-hydraulic Operation Table Volume (K) Forecast, by Application 2020 & 2033
- Table 53: Rest of Europe Mobile Electro-hydraulic Operation Table Revenue (billion) Forecast, by Application 2020 & 2033
- Table 54: Rest of Europe Mobile Electro-hydraulic Operation Table Volume (K) Forecast, by Application 2020 & 2033
- Table 55: Global Mobile Electro-hydraulic Operation Table Revenue billion Forecast, by Application 2020 & 2033
- Table 56: Global Mobile Electro-hydraulic Operation Table Volume K Forecast, by Application 2020 & 2033
- Table 57: Global Mobile Electro-hydraulic Operation Table Revenue billion Forecast, by Types 2020 & 2033
- Table 58: Global Mobile Electro-hydraulic Operation Table Volume K Forecast, by Types 2020 & 2033
- Table 59: Global Mobile Electro-hydraulic Operation Table Revenue billion Forecast, by Country 2020 & 2033
- Table 60: Global Mobile Electro-hydraulic Operation Table Volume K Forecast, by Country 2020 & 2033
- Table 61: Turkey Mobile Electro-hydraulic Operation Table Revenue (billion) Forecast, by Application 2020 & 2033
- Table 62: Turkey Mobile Electro-hydraulic Operation Table Volume (K) Forecast, by Application 2020 & 2033
- Table 63: Israel Mobile Electro-hydraulic Operation Table Revenue (billion) Forecast, by Application 2020 & 2033
- Table 64: Israel Mobile Electro-hydraulic Operation Table Volume (K) Forecast, by Application 2020 & 2033
- Table 65: GCC Mobile Electro-hydraulic Operation Table Revenue (billion) Forecast, by Application 2020 & 2033
- Table 66: GCC Mobile Electro-hydraulic Operation Table Volume (K) Forecast, by Application 2020 & 2033
- Table 67: North Africa Mobile Electro-hydraulic Operation Table Revenue (billion) Forecast, by Application 2020 & 2033
- Table 68: North Africa Mobile Electro-hydraulic Operation Table Volume (K) Forecast, by Application 2020 & 2033
- Table 69: South Africa Mobile Electro-hydraulic Operation Table Revenue (billion) Forecast, by Application 2020 & 2033
- Table 70: South Africa Mobile Electro-hydraulic Operation Table Volume (K) Forecast, by Application 2020 & 2033
- Table 71: Rest of Middle East & Africa Mobile Electro-hydraulic Operation Table Revenue (billion) Forecast, by Application 2020 & 2033
- Table 72: Rest of Middle East & Africa Mobile Electro-hydraulic Operation Table Volume (K) Forecast, by Application 2020 & 2033
- Table 73: Global Mobile Electro-hydraulic Operation Table Revenue billion Forecast, by Application 2020 & 2033
- Table 74: Global Mobile Electro-hydraulic Operation Table Volume K Forecast, by Application 2020 & 2033
- Table 75: Global Mobile Electro-hydraulic Operation Table Revenue billion Forecast, by Types 2020 & 2033
- Table 76: Global Mobile Electro-hydraulic Operation Table Volume K Forecast, by Types 2020 & 2033
- Table 77: Global Mobile Electro-hydraulic Operation Table Revenue billion Forecast, by Country 2020 & 2033
- Table 78: Global Mobile Electro-hydraulic Operation Table Volume K Forecast, by Country 2020 & 2033
- Table 79: China Mobile Electro-hydraulic Operation Table Revenue (billion) Forecast, by Application 2020 & 2033
- Table 80: China Mobile Electro-hydraulic Operation Table Volume (K) Forecast, by Application 2020 & 2033
- Table 81: India Mobile Electro-hydraulic Operation Table Revenue (billion) Forecast, by Application 2020 & 2033
- Table 82: India Mobile Electro-hydraulic Operation Table Volume (K) Forecast, by Application 2020 & 2033
- Table 83: Japan Mobile Electro-hydraulic Operation Table Revenue (billion) Forecast, by Application 2020 & 2033
- Table 84: Japan Mobile Electro-hydraulic Operation Table Volume (K) Forecast, by Application 2020 & 2033
- Table 85: South Korea Mobile Electro-hydraulic Operation Table Revenue (billion) Forecast, by Application 2020 & 2033
- Table 86: South Korea Mobile Electro-hydraulic Operation Table Volume (K) Forecast, by Application 2020 & 2033
- Table 87: ASEAN Mobile Electro-hydraulic Operation Table Revenue (billion) Forecast, by Application 2020 & 2033
- Table 88: ASEAN Mobile Electro-hydraulic Operation Table Volume (K) Forecast, by Application 2020 & 2033
- Table 89: Oceania Mobile Electro-hydraulic Operation Table Revenue (billion) Forecast, by Application 2020 & 2033
- Table 90: Oceania Mobile Electro-hydraulic Operation Table Volume (K) Forecast, by Application 2020 & 2033
- Table 91: Rest of Asia Pacific Mobile Electro-hydraulic Operation Table Revenue (billion) Forecast, by Application 2020 & 2033
- Table 92: Rest of Asia Pacific Mobile Electro-hydraulic Operation Table Volume (K) Forecast, by Application 2020 & 2033
Frequently Asked Questions
1. What is the projected Compound Annual Growth Rate (CAGR) of the Mobile Electro-hydraulic Operation Table?
The projected CAGR is approximately 13.25%.
2. Which companies are prominent players in the Mobile Electro-hydraulic Operation Table?
Key companies in the market include Getinge, JW Holdings, Braun & Co., ASCO Medical, SternMed GmbH, BenQ Medical Technology, Confident Dental Equipments, medifa, Koinaa Medical Equipments, Shenzhen Mindray, Beijing Aeonmed, Shandong Weigao Group, Famed Zywiec, Torontech, Mediland, Narang Medical, SaiKang Medical, Zhangjiagang Medi Medical Equipment, Comen, Heal Force, BiHealthcare, HOWELL Medical.
3. What are the main segments of the Mobile Electro-hydraulic Operation Table?
The market segments include Application, Types.
4. Can you provide details about the market size?
The market size is estimated to be USD 9.36 billion as of 2022.
5. What are some drivers contributing to market growth?
N/A
6. What are the notable trends driving market growth?
N/A
7. Are there any restraints impacting market growth?
N/A
8. Can you provide examples of recent developments in the market?
N/A
9. What pricing options are available for accessing the report?
Pricing options include single-user, multi-user, and enterprise licenses priced at USD 3350.00, USD 5025.00, and USD 6700.00 respectively.
10. Is the market size provided in terms of value or volume?
The market size is provided in terms of value, measured in billion and volume, measured in K.
11. Are there any specific market keywords associated with the report?
Yes, the market keyword associated with the report is "Mobile Electro-hydraulic Operation Table," which aids in identifying and referencing the specific market segment covered.
12. How do I determine which pricing option suits my needs best?
The pricing options vary based on user requirements and access needs. Individual users may opt for single-user licenses, while businesses requiring broader access may choose multi-user or enterprise licenses for cost-effective access to the report.
13. Are there any additional resources or data provided in the Mobile Electro-hydraulic Operation Table report?
While the report offers comprehensive insights, it's advisable to review the specific contents or supplementary materials provided to ascertain if additional resources or data are available.
14. How can I stay updated on further developments or reports in the Mobile Electro-hydraulic Operation Table?
To stay informed about further developments, trends, and reports in the Mobile Electro-hydraulic Operation Table, consider subscribing to industry newsletters, following relevant companies and organizations, or regularly checking reputable industry news sources and publications.
Methodology
Step 1 - Identification of Relevant Samples Size from Population Database


Step 2 - Approaches for Defining Global Market Size (Value, Volume* & Price*)

Note*: In applicable scenarios
Step 3 - Data Sources
Primary Research
- Web Analytics
- Survey Reports
- Research Institute
- Latest Research Reports
- Opinion Leaders
Secondary Research
- Annual Reports
- White Paper
- Latest Press Release
- Industry Association
- Paid Database
- Investor Presentations

Step 4 - Data Triangulation
Involves using different sources of information in order to increase the validity of a study
These sources are likely to be stakeholders in a program - participants, other researchers, program staff, other community members, and so on.
Then we put all data in single framework & apply various statistical tools to find out the dynamic on the market.
During the analysis stage, feedback from the stakeholder groups would be compared to determine areas of agreement as well as areas of divergence