

Key Insights
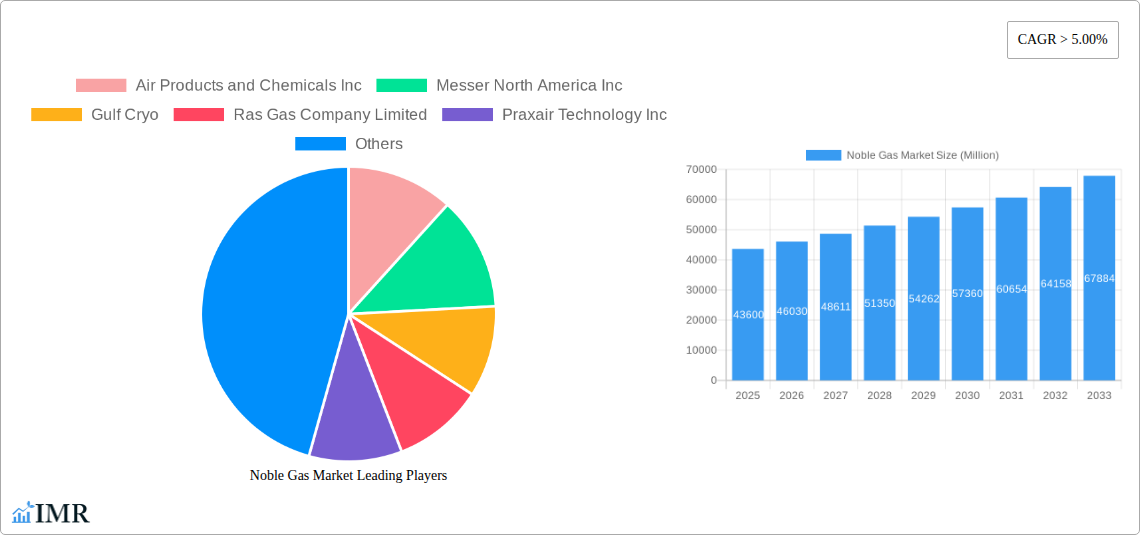
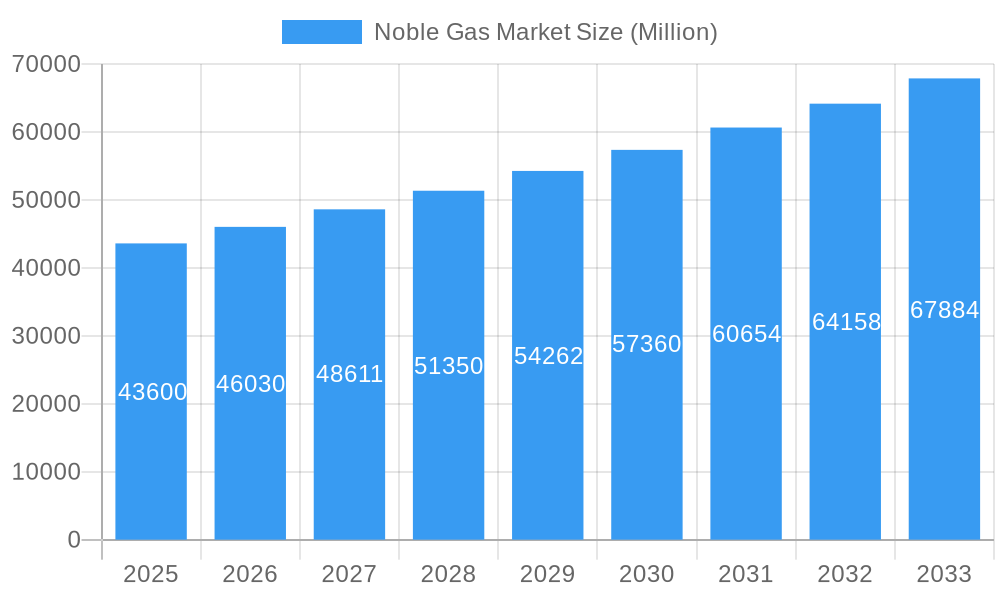
The global noble gas market, valued at $43,600 million in 2025, is projected to experience robust growth, exceeding a 5% CAGR through 2033. This expansion is driven by increasing demand across diverse sectors. The healthcare industry, particularly for applications like anesthesia and medical imaging, is a significant contributor. The oil and gas sector relies heavily on noble gases for various processes, from welding and insulation in pipelines to cryogenic applications. Furthermore, the burgeoning technological landscape, particularly advancements in lighting and display technologies (including picture projection and television tubes), fuels considerable demand for neon, xenon, and krypton. The rise of advanced analytical techniques in scientific research and industrial settings also contributes to market growth. Regional variations exist; the Asia-Pacific region, with its rapid industrialization and significant growth in healthcare and technology sectors in countries like China and India, is expected to dominate market share, followed by North America and Europe. However, environmental regulations concerning the extraction and usage of some noble gases, coupled with price fluctuations influenced by global supply chain dynamics, pose potential restraints on market expansion.
Noble Gas Market Market Size (In Billion)
While helium, argon, and neon currently hold the largest market segments due to their wide-ranging applications, the demand for specialized noble gases like xenon and krypton is rapidly increasing, driven by their use in advanced technologies. This trend, along with innovations in extraction and purification technologies, should contribute to further market diversification and growth. The competitive landscape is characterized by a mix of large multinational corporations and specialized regional players, each with its own technological advancements and market reach. The future growth trajectory of the noble gas market is largely positive, contingent upon continued technological innovation, increasing demand from key end-use industries, and effective management of potential supply chain challenges.
Noble Gas Market Company Market Share
Noble Gas Market: A Comprehensive Market Report (2019-2033)
This in-depth report provides a comprehensive analysis of the Noble Gas Market, encompassing market dynamics, growth trends, regional dominance, product landscape, key players, and future outlook. With a focus on Helium, Krypton, Argon, Neon, Xenon, and Radioactive Radon, this study covers applications across diverse end-user industries including Oil & Gas, Healthcare, and Aerospace. The report utilizes data from 2019-2024 (Historical Period), estimates for 2025 (Estimated Year & Base Year), and forecasts extending to 2033 (Forecast Period), offering invaluable insights for industry professionals. The market size is presented in Million units.
Noble Gas Market Market Dynamics & Structure
The noble gas market exhibits a moderately concentrated structure, with a select group of major industry leaders dominating significant market share. Continuous technological innovation, particularly in the sophisticated realms of helium extraction, purification, and the development of novel applications, serves as a primary catalyst for market expansion. Stringent regulatory frameworks governing the safe handling, storage, and transportation of specific noble gases, notably radioactive radon and the increasingly critical helium, present both complex challenges and emerging opportunities for market participants. The market also navigates competitive pressures from substitute materials and alternative technologies in various established and nascent applications. Mergers and acquisitions (M&A) activity remains a strategic tool, with focused acquisitions aimed at broadening geographical footprints, securing vital raw material access, and consolidating technological expertise.
- Market Concentration: The top 5 players collectively held approximately XX% of the global market share in 2025, indicating a stable yet competitive landscape.
- Technological Innovation: Advancements in sophisticated cryogenic separation techniques, advanced membrane technologies for purification, and novel extraction methodologies are significantly driving efficiency gains and reducing production costs.
- Regulatory Landscape: Stringent safety and environmental regulations for handling, storing, and transporting noble gases, particularly for radioactive isotopes like radon and the controlled substance helium, profoundly influence market dynamics and operational strategies.
- Competitive Substitutes: In certain niche applications, alternative materials and emerging technologies continue to present dynamic competitive challenges, necessitating ongoing innovation and differentiation.
- M&A Activity: The noble gas market witnessed an average of XX M&A deals per year between 2019 and 2024, signaling strategic consolidation and investment in key growth areas.
- End-User Demographics: Robust growth is predominantly fueled by escalating demand from high-growth sectors including advanced healthcare (e.g., MRI machines, medical lasers), cutting-edge aerospace (e.g., rocketry propulsion, satellite systems), and advanced industrial manufacturing.
Noble Gas Market Growth Trends & Insights
The noble gas market is projected to witness robust growth during the forecast period (2025-2033). Driven by rising demand across diverse end-use sectors like healthcare, aerospace, and electronics, the market is expected to expand at a CAGR of xx% from 2025 to 2033. This growth is fueled by technological advancements, increased industrial activity, and growing awareness of the unique properties of noble gases in various applications. Significant technological disruptions are anticipated, particularly within helium extraction and processing, leading to more efficient and cost-effective production. This will be reflected in the market penetration rates of specific noble gases across diverse applications. Consumer behavior shifts, such as a heightened focus on environmental sustainability and safety regulations, further shape the market trajectory. The market is segmented by type (Helium, Krypton, Argon, Neon, Xenon, Radioactive Radon) and application (Picture Projection, Anesthetic, Welding, Insulation, Lighting, Television Tubes, Advertising, Refrigerant, Working Fluid, Chemical Analysis), providing detailed insights into individual segment growth.
Dominant Regions, Countries, or Segments in Noble Gas Market
North America currently holds the largest market share in the noble gas market, driven by robust demand from the healthcare and aerospace sectors. Asia Pacific is projected to exhibit the fastest growth rate during the forecast period, fueled by rapid industrialization and economic expansion. Within the product segments, helium remains the most dominant noble gas, driven by its widespread use in various applications including cryogenics, MRI, and leak detection.
Key Drivers:
- North America: Strong presence of key players, advanced technological infrastructure, and high demand from end-use industries.
- Asia Pacific: Rapid industrialization, increasing investments in healthcare and technology sectors, and rising population.
- Helium: High demand for cryogenic applications, medical imaging (MRI), and leak detection.
- Argon: Widespread use in welding, metallurgy, and electronics.
Dominance Factors: Market share, growth potential, and regulatory environment influence regional dominance.
Noble Gas Market Product Landscape
Noble gas products are characterized by high purity levels and specialized delivery systems catering to individual application needs. Recent innovations focus on enhanced efficiency in extraction, purification, and delivery. Unique selling propositions include improved purity levels, customized packaging, and environmentally friendly delivery solutions. Technological advancements are focused on improving energy efficiency during liquefaction, reducing the environmental impact of production, and enhancing the safety of handling high-pressure gases.
Key Drivers, Barriers & Challenges in Noble Gas Market
Key Drivers:
- A significant surge in demand from critical sectors such as healthcare (for MRI machines and advanced medical treatments), aerospace (for rocket propulsion and satellite inerting), and diverse industrial applications requiring specialized inert atmospheres.
- Continued technological advancements in extraction, purification, delivery systems, and the development of innovative applications for noble gases.
- Increasing governmental support for research and development initiatives focused on unlocking new applications and improving the efficiency of noble gas utilization.
Key Challenges and Restraints:
- The inherent limited availability and finite nature of helium, presenting a significant supply chain risk and potentially impacting market growth by an estimated XX% if not effectively managed through enhanced recovery and recycling efforts.
- Substantial high production costs, particularly for less common and highly specialized gases like xenon and krypton, can constrain widespread adoption.
- The stringent and evolving regulatory frameworks concerning the safe handling, transportation, and disposal of noble gases, especially radioactive radon, add complexity and increase operational overhead.
Emerging Opportunities in Noble Gas Market
- Expanding applications in emerging technologies, such as quantum computing and advanced manufacturing.
- Growing demand for high-purity noble gases in specialized industries like semiconductor manufacturing.
- Development of new applications in medical diagnostics and treatment.
- Untapped markets in developing economies with expanding industrial activity.
Growth Accelerators in the Noble Gas Market Industry
Strategic alliances and synergistic partnerships among key market players, focusing on collaborative research & development, optimizing production processes, and integrating supply chains, will serve as critical accelerators for sustained long-term growth. Furthermore, groundbreaking technological breakthroughs leading to substantial cost reductions, enhanced operational efficiency, and the adoption of environmentally responsible production and recycling practices will significantly expedite market expansion. Proactive expansion into underserved or nascent markets, coupled with the continuous development and commercialization of novel, innovative applications for noble gases across emerging technologies, will also contribute substantially to the industry's impressive growth trajectory.
Key Players Shaping the Noble Gas Market Market
- Air Products and Chemicals Inc
- Messer North America Inc.
- Gulf Cryo
- Ras Gas Company Limited
- Praxair Technology Inc (now part of Linde plc)
- BASF SE
- ITM Power
- Linde plc
- American Gas
- TAIYO NIPPON SANSO CORPORATION
- Royal Dutch Shell PLC (significant helium producer)
- Buzwair Industrial Gases Factories
- Air Liquide
- Airgas Inc (part of Air Liquide)
Notable Milestones in Noble Gas Market Sector
- April 2022: Linde signed an off-take agreement to recover helium from Freeport LNG's Texas production site and will build a helium processing plant in the U.S. This significantly expands Linde's helium production capacity and supply chain.
- November 2022: Air Products secured USD 1.07 billion in contracts to supply 33 million liters of liquid helium to NASA's Kennedy Space Center. This demonstrates the crucial role of helium in aerospace and highlights the scale of large contracts in the industry.
In-Depth Noble Gas Market Market Outlook
The global noble gas market is strategically positioned for robust and sustained growth, propelled by relentless technological advancements and the ever-increasing, diverse demands of a wide array of end-user industries. Significant strategic investments in cutting-edge research and development, coupled with proactive strategic partnerships and collaborative ventures, will further catalyze and enhance market expansion. The exploration and penetration of untapped geographical markets, alongside the innovative development and application of noble gases in rapidly emerging technologies, present lucrative and substantial opportunities for companies operating within this dynamic sector. A paramount focus on sustainability, circular economy principles, and the responsible sourcing and recycling of critical resources like helium will play a pivotal role in shaping the market’s long-term resilience and sustainable trajectory.
Noble Gas Market Segmentation
-
1. Type
- 1.1. Helium
- 1.2. Krypton
- 1.3. Argon
- 1.4. Neon
- 1.5. Xenon
- 1.6. Radioactive Radon
-
2. Application
- 2.1. Picture Projection
- 2.2. Anesthetic
- 2.3. Welding
- 2.4. Insulation
- 2.5. Lighting
- 2.6. Television Tubes
- 2.7. Advertising
- 2.8. Refrigerant
- 2.9. Working Fluid
- 2.10. Chemical Analysis
-
3. End-user Industry
- 3.1. Oil and Gas
- 3.2. Mining
- 3.3. Healthcare
- 3.4. Aerospace
- 3.5. Construction
- 3.6. Energy and Power
Noble Gas Market Segmentation By Geography
-
1. Asia Pacific
- 1.1. China
- 1.2. India
- 1.3. Japan
- 1.4. South Korea
- 1.5. Rest of Asia Pacific
-
2. North America
- 2.1. United States
- 2.2. Canada
- 2.3. Mexico
-
3. Europe
- 3.1. Germany
- 3.2. United Kingdom
- 3.3. Italy
- 3.4. France
- 3.5. Rest of Europe
-
4. South America
- 4.1. Brazil
- 4.2. Argentina
- 4.3. Rest of South America
- 5. Middle East
-
6. Saudi Arabia
- 6.1. South Africa
- 6.2. Rest of Middle East
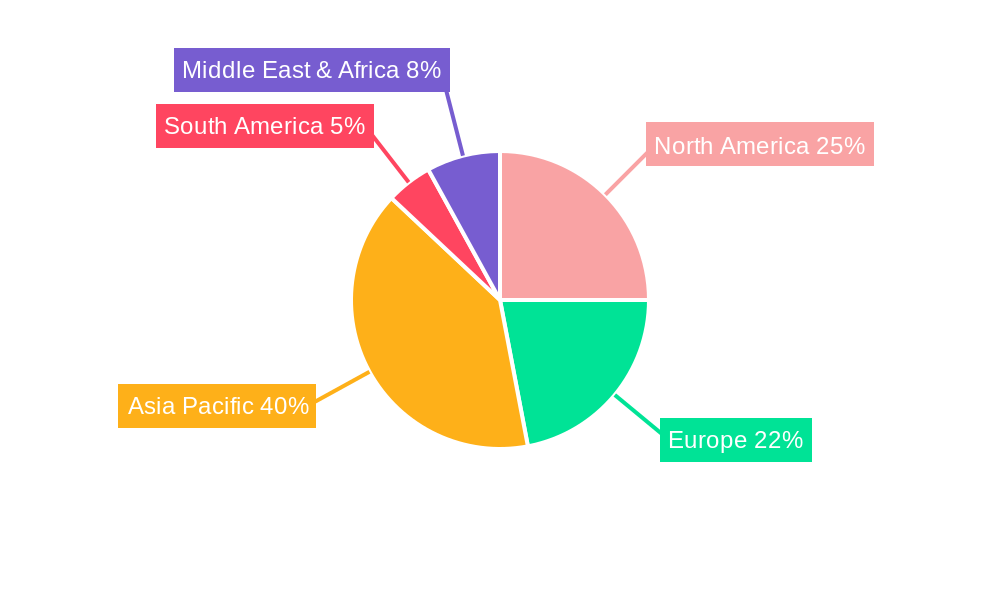
Noble Gas Market Regional Market Share
Geographic Coverage of Noble Gas Market
Noble Gas Market REPORT HIGHLIGHTS
| Aspects | Details |
|---|---|
| Study Period | 2020-2034 |
| Base Year | 2025 |
| Estimated Year | 2026 |
| Forecast Period | 2026-2034 |
| Historical Period | 2020-2025 |
| Growth Rate | CAGR of > 5.00% from 2020-2034 |
| Segmentation |
|
Table of Contents
- 1. Introduction
- 1.1. Research Scope
- 1.2. Market Segmentation
- 1.3. Research Objective
- 1.4. Definitions and Assumptions
- 2. Executive Summary
- 2.1. Market Snapshot
- 3. Market Dynamics
- 3.1. Market Drivers
- 3.2. Market Restrains
- 3.3. Market Trends
- 3.4. Market Opportunities
- 4. Market Factor Analysis
- 4.1. Porters Five Forces
- 4.1.1. Bargaining Power of Suppliers
- 4.1.2. Bargaining Power of Buyers
- 4.1.3. Threat of New Entrants
- 4.1.4. Threat of Substitutes
- 4.1.5. Competitive Rivalry
- 4.2. PESTEL analysis
- 4.3. BCG Analysis
- 4.3.1. Stars (High Growth, High Market Share)
- 4.3.2. Cash Cows (Low Growth, High Market Share)
- 4.3.3. Question Mark (High Growth, Low Market Share)
- 4.3.4. Dogs (Low Growth, Low Market Share)
- 4.4. Ansoff Matrix Analysis
- 4.5. Supply Chain Analysis
- 4.6. Regulatory Landscape
- 4.7. Current Market Potential and Opportunity Assessment (TAM–SAM–SOM Framework)
- 4.8. IMR Analyst Note
- 4.1. Porters Five Forces
- 5. Market Analysis, Insights and Forecast 2021-2033
- 5.1. Market Analysis, Insights and Forecast - by Type
- 5.1.1. Helium
- 5.1.2. Krypton
- 5.1.3. Argon
- 5.1.4. Neon
- 5.1.5. Xenon
- 5.1.6. Radioactive Radon
- 5.2. Market Analysis, Insights and Forecast - by Application
- 5.2.1. Picture Projection
- 5.2.2. Anesthetic
- 5.2.3. Welding
- 5.2.4. Insulation
- 5.2.5. Lighting
- 5.2.6. Television Tubes
- 5.2.7. Advertising
- 5.2.8. Refrigerant
- 5.2.9. Working Fluid
- 5.2.10. Chemical Analysis
- 5.3. Market Analysis, Insights and Forecast - by End-user Industry
- 5.3.1. Oil and Gas
- 5.3.2. Mining
- 5.3.3. Healthcare
- 5.3.4. Aerospace
- 5.3.5. Construction
- 5.3.6. Energy and Power
- 5.4. Market Analysis, Insights and Forecast - by Region
- 5.4.1. Asia Pacific
- 5.4.2. North America
- 5.4.3. Europe
- 5.4.4. South America
- 5.4.5. Middle East
- 5.4.6. Saudi Arabia
- 5.1. Market Analysis, Insights and Forecast - by Type
- 6. Global Noble Gas Market Analysis, Insights and Forecast, 2021-2033
- 6.1. Market Analysis, Insights and Forecast - by Type
- 6.1.1. Helium
- 6.1.2. Krypton
- 6.1.3. Argon
- 6.1.4. Neon
- 6.1.5. Xenon
- 6.1.6. Radioactive Radon
- 6.2. Market Analysis, Insights and Forecast - by Application
- 6.2.1. Picture Projection
- 6.2.2. Anesthetic
- 6.2.3. Welding
- 6.2.4. Insulation
- 6.2.5. Lighting
- 6.2.6. Television Tubes
- 6.2.7. Advertising
- 6.2.8. Refrigerant
- 6.2.9. Working Fluid
- 6.2.10. Chemical Analysis
- 6.3. Market Analysis, Insights and Forecast - by End-user Industry
- 6.3.1. Oil and Gas
- 6.3.2. Mining
- 6.3.3. Healthcare
- 6.3.4. Aerospace
- 6.3.5. Construction
- 6.3.6. Energy and Power
- 6.1. Market Analysis, Insights and Forecast - by Type
- 7. Asia Pacific Noble Gas Market Analysis, Insights and Forecast, 2020-2032
- 7.1. Market Analysis, Insights and Forecast - by Type
- 7.1.1. Helium
- 7.1.2. Krypton
- 7.1.3. Argon
- 7.1.4. Neon
- 7.1.5. Xenon
- 7.1.6. Radioactive Radon
- 7.2. Market Analysis, Insights and Forecast - by Application
- 7.2.1. Picture Projection
- 7.2.2. Anesthetic
- 7.2.3. Welding
- 7.2.4. Insulation
- 7.2.5. Lighting
- 7.2.6. Television Tubes
- 7.2.7. Advertising
- 7.2.8. Refrigerant
- 7.2.9. Working Fluid
- 7.2.10. Chemical Analysis
- 7.3. Market Analysis, Insights and Forecast - by End-user Industry
- 7.3.1. Oil and Gas
- 7.3.2. Mining
- 7.3.3. Healthcare
- 7.3.4. Aerospace
- 7.3.5. Construction
- 7.3.6. Energy and Power
- 7.1. Market Analysis, Insights and Forecast - by Type
- 8. North America Noble Gas Market Analysis, Insights and Forecast, 2020-2032
- 8.1. Market Analysis, Insights and Forecast - by Type
- 8.1.1. Helium
- 8.1.2. Krypton
- 8.1.3. Argon
- 8.1.4. Neon
- 8.1.5. Xenon
- 8.1.6. Radioactive Radon
- 8.2. Market Analysis, Insights and Forecast - by Application
- 8.2.1. Picture Projection
- 8.2.2. Anesthetic
- 8.2.3. Welding
- 8.2.4. Insulation
- 8.2.5. Lighting
- 8.2.6. Television Tubes
- 8.2.7. Advertising
- 8.2.8. Refrigerant
- 8.2.9. Working Fluid
- 8.2.10. Chemical Analysis
- 8.3. Market Analysis, Insights and Forecast - by End-user Industry
- 8.3.1. Oil and Gas
- 8.3.2. Mining
- 8.3.3. Healthcare
- 8.3.4. Aerospace
- 8.3.5. Construction
- 8.3.6. Energy and Power
- 8.1. Market Analysis, Insights and Forecast - by Type
- 9. Europe Noble Gas Market Analysis, Insights and Forecast, 2020-2032
- 9.1. Market Analysis, Insights and Forecast - by Type
- 9.1.1. Helium
- 9.1.2. Krypton
- 9.1.3. Argon
- 9.1.4. Neon
- 9.1.5. Xenon
- 9.1.6. Radioactive Radon
- 9.2. Market Analysis, Insights and Forecast - by Application
- 9.2.1. Picture Projection
- 9.2.2. Anesthetic
- 9.2.3. Welding
- 9.2.4. Insulation
- 9.2.5. Lighting
- 9.2.6. Television Tubes
- 9.2.7. Advertising
- 9.2.8. Refrigerant
- 9.2.9. Working Fluid
- 9.2.10. Chemical Analysis
- 9.3. Market Analysis, Insights and Forecast - by End-user Industry
- 9.3.1. Oil and Gas
- 9.3.2. Mining
- 9.3.3. Healthcare
- 9.3.4. Aerospace
- 9.3.5. Construction
- 9.3.6. Energy and Power
- 9.1. Market Analysis, Insights and Forecast - by Type
- 10. South America Noble Gas Market Analysis, Insights and Forecast, 2020-2032
- 10.1. Market Analysis, Insights and Forecast - by Type
- 10.1.1. Helium
- 10.1.2. Krypton
- 10.1.3. Argon
- 10.1.4. Neon
- 10.1.5. Xenon
- 10.1.6. Radioactive Radon
- 10.2. Market Analysis, Insights and Forecast - by Application
- 10.2.1. Picture Projection
- 10.2.2. Anesthetic
- 10.2.3. Welding
- 10.2.4. Insulation
- 10.2.5. Lighting
- 10.2.6. Television Tubes
- 10.2.7. Advertising
- 10.2.8. Refrigerant
- 10.2.9. Working Fluid
- 10.2.10. Chemical Analysis
- 10.3. Market Analysis, Insights and Forecast - by End-user Industry
- 10.3.1. Oil and Gas
- 10.3.2. Mining
- 10.3.3. Healthcare
- 10.3.4. Aerospace
- 10.3.5. Construction
- 10.3.6. Energy and Power
- 10.1. Market Analysis, Insights and Forecast - by Type
- 11. Middle East Noble Gas Market Analysis, Insights and Forecast, 2020-2032
- 11.1. Market Analysis, Insights and Forecast - by Type
- 11.1.1. Helium
- 11.1.2. Krypton
- 11.1.3. Argon
- 11.1.4. Neon
- 11.1.5. Xenon
- 11.1.6. Radioactive Radon
- 11.2. Market Analysis, Insights and Forecast - by Application
- 11.2.1. Picture Projection
- 11.2.2. Anesthetic
- 11.2.3. Welding
- 11.2.4. Insulation
- 11.2.5. Lighting
- 11.2.6. Television Tubes
- 11.2.7. Advertising
- 11.2.8. Refrigerant
- 11.2.9. Working Fluid
- 11.2.10. Chemical Analysis
- 11.3. Market Analysis, Insights and Forecast - by End-user Industry
- 11.3.1. Oil and Gas
- 11.3.2. Mining
- 11.3.3. Healthcare
- 11.3.4. Aerospace
- 11.3.5. Construction
- 11.3.6. Energy and Power
- 11.1. Market Analysis, Insights and Forecast - by Type
- 12. Saudi Arabia Noble Gas Market Analysis, Insights and Forecast, 2020-2032
- 12.1. Market Analysis, Insights and Forecast - by Type
- 12.1.1. Helium
- 12.1.2. Krypton
- 12.1.3. Argon
- 12.1.4. Neon
- 12.1.5. Xenon
- 12.1.6. Radioactive Radon
- 12.2. Market Analysis, Insights and Forecast - by Application
- 12.2.1. Picture Projection
- 12.2.2. Anesthetic
- 12.2.3. Welding
- 12.2.4. Insulation
- 12.2.5. Lighting
- 12.2.6. Television Tubes
- 12.2.7. Advertising
- 12.2.8. Refrigerant
- 12.2.9. Working Fluid
- 12.2.10. Chemical Analysis
- 12.3. Market Analysis, Insights and Forecast - by End-user Industry
- 12.3.1. Oil and Gas
- 12.3.2. Mining
- 12.3.3. Healthcare
- 12.3.4. Aerospace
- 12.3.5. Construction
- 12.3.6. Energy and Power
- 12.1. Market Analysis, Insights and Forecast - by Type
- 13. Competitive Analysis
- 13.1. Company Profiles
- 13.1.1 Air Products and Chemicals Inc
- 13.1.1.1. Company Overview
- 13.1.1.2. Products
- 13.1.1.3. Company Financials
- 13.1.1.4. SWOT Analysis
- 13.1.2 Messer North America Inc
- 13.1.2.1. Company Overview
- 13.1.2.2. Products
- 13.1.2.3. Company Financials
- 13.1.2.4. SWOT Analysis
- 13.1.3 Gulf Cryo
- 13.1.3.1. Company Overview
- 13.1.3.2. Products
- 13.1.3.3. Company Financials
- 13.1.3.4. SWOT Analysis
- 13.1.4 Ras Gas Company Limited
- 13.1.4.1. Company Overview
- 13.1.4.2. Products
- 13.1.4.3. Company Financials
- 13.1.4.4. SWOT Analysis
- 13.1.5 Praxair Technology Inc
- 13.1.5.1. Company Overview
- 13.1.5.2. Products
- 13.1.5.3. Company Financials
- 13.1.5.4. SWOT Analysis
- 13.1.6 BASF SE
- 13.1.6.1. Company Overview
- 13.1.6.2. Products
- 13.1.6.3. Company Financials
- 13.1.6.4. SWOT Analysis
- 13.1.7 ITM Power
- 13.1.7.1. Company Overview
- 13.1.7.2. Products
- 13.1.7.3. Company Financials
- 13.1.7.4. SWOT Analysis
- 13.1.8 Linde plc
- 13.1.8.1. Company Overview
- 13.1.8.2. Products
- 13.1.8.3. Company Financials
- 13.1.8.4. SWOT Analysis
- 13.1.9 American Gas
- 13.1.9.1. Company Overview
- 13.1.9.2. Products
- 13.1.9.3. Company Financials
- 13.1.9.4. SWOT Analysis
- 13.1.10 TAIYO NIPPON SANSO CORPORATION*List Not Exhaustive
- 13.1.10.1. Company Overview
- 13.1.10.2. Products
- 13.1.10.3. Company Financials
- 13.1.10.4. SWOT Analysis
- 13.1.11 Royal Dutch Shell PLC
- 13.1.11.1. Company Overview
- 13.1.11.2. Products
- 13.1.11.3. Company Financials
- 13.1.11.4. SWOT Analysis
- 13.1.12 Buzwair Industrial Gases Factories
- 13.1.12.1. Company Overview
- 13.1.12.2. Products
- 13.1.12.3. Company Financials
- 13.1.12.4. SWOT Analysis
- 13.1.13 Air Liquide
- 13.1.13.1. Company Overview
- 13.1.13.2. Products
- 13.1.13.3. Company Financials
- 13.1.13.4. SWOT Analysis
- 13.1.14 Airgas Inc
- 13.1.14.1. Company Overview
- 13.1.14.2. Products
- 13.1.14.3. Company Financials
- 13.1.14.4. SWOT Analysis
- 13.1.1 Air Products and Chemicals Inc
- 13.2. Market Entropy
- 13.2.1 Company's Key Areas Served
- 13.2.2 Recent Developments
- 13.3. Company Market Share Analysis 2025
- 13.3.1 Top 5 Companies Market Share Analysis
- 13.3.2 Top 3 Companies Market Share Analysis
- 13.4. List of Potential Customers
- 14. Research Methodology
List of Figures
- Figure 1: Global Noble Gas Market Revenue Breakdown (Million, %) by Region 2025 & 2033
- Figure 2: Global Noble Gas Market Volume Breakdown (K Tons, %) by Region 2025 & 2033
- Figure 3: Asia Pacific Noble Gas Market Revenue (Million), by Type 2025 & 2033
- Figure 4: Asia Pacific Noble Gas Market Volume (K Tons), by Type 2025 & 2033
- Figure 5: Asia Pacific Noble Gas Market Revenue Share (%), by Type 2025 & 2033
- Figure 6: Asia Pacific Noble Gas Market Volume Share (%), by Type 2025 & 2033
- Figure 7: Asia Pacific Noble Gas Market Revenue (Million), by Application 2025 & 2033
- Figure 8: Asia Pacific Noble Gas Market Volume (K Tons), by Application 2025 & 2033
- Figure 9: Asia Pacific Noble Gas Market Revenue Share (%), by Application 2025 & 2033
- Figure 10: Asia Pacific Noble Gas Market Volume Share (%), by Application 2025 & 2033
- Figure 11: Asia Pacific Noble Gas Market Revenue (Million), by End-user Industry 2025 & 2033
- Figure 12: Asia Pacific Noble Gas Market Volume (K Tons), by End-user Industry 2025 & 2033
- Figure 13: Asia Pacific Noble Gas Market Revenue Share (%), by End-user Industry 2025 & 2033
- Figure 14: Asia Pacific Noble Gas Market Volume Share (%), by End-user Industry 2025 & 2033
- Figure 15: Asia Pacific Noble Gas Market Revenue (Million), by Country 2025 & 2033
- Figure 16: Asia Pacific Noble Gas Market Volume (K Tons), by Country 2025 & 2033
- Figure 17: Asia Pacific Noble Gas Market Revenue Share (%), by Country 2025 & 2033
- Figure 18: Asia Pacific Noble Gas Market Volume Share (%), by Country 2025 & 2033
- Figure 19: North America Noble Gas Market Revenue (Million), by Type 2025 & 2033
- Figure 20: North America Noble Gas Market Volume (K Tons), by Type 2025 & 2033
- Figure 21: North America Noble Gas Market Revenue Share (%), by Type 2025 & 2033
- Figure 22: North America Noble Gas Market Volume Share (%), by Type 2025 & 2033
- Figure 23: North America Noble Gas Market Revenue (Million), by Application 2025 & 2033
- Figure 24: North America Noble Gas Market Volume (K Tons), by Application 2025 & 2033
- Figure 25: North America Noble Gas Market Revenue Share (%), by Application 2025 & 2033
- Figure 26: North America Noble Gas Market Volume Share (%), by Application 2025 & 2033
- Figure 27: North America Noble Gas Market Revenue (Million), by End-user Industry 2025 & 2033
- Figure 28: North America Noble Gas Market Volume (K Tons), by End-user Industry 2025 & 2033
- Figure 29: North America Noble Gas Market Revenue Share (%), by End-user Industry 2025 & 2033
- Figure 30: North America Noble Gas Market Volume Share (%), by End-user Industry 2025 & 2033
- Figure 31: North America Noble Gas Market Revenue (Million), by Country 2025 & 2033
- Figure 32: North America Noble Gas Market Volume (K Tons), by Country 2025 & 2033
- Figure 33: North America Noble Gas Market Revenue Share (%), by Country 2025 & 2033
- Figure 34: North America Noble Gas Market Volume Share (%), by Country 2025 & 2033
- Figure 35: Europe Noble Gas Market Revenue (Million), by Type 2025 & 2033
- Figure 36: Europe Noble Gas Market Volume (K Tons), by Type 2025 & 2033
- Figure 37: Europe Noble Gas Market Revenue Share (%), by Type 2025 & 2033
- Figure 38: Europe Noble Gas Market Volume Share (%), by Type 2025 & 2033
- Figure 39: Europe Noble Gas Market Revenue (Million), by Application 2025 & 2033
- Figure 40: Europe Noble Gas Market Volume (K Tons), by Application 2025 & 2033
- Figure 41: Europe Noble Gas Market Revenue Share (%), by Application 2025 & 2033
- Figure 42: Europe Noble Gas Market Volume Share (%), by Application 2025 & 2033
- Figure 43: Europe Noble Gas Market Revenue (Million), by End-user Industry 2025 & 2033
- Figure 44: Europe Noble Gas Market Volume (K Tons), by End-user Industry 2025 & 2033
- Figure 45: Europe Noble Gas Market Revenue Share (%), by End-user Industry 2025 & 2033
- Figure 46: Europe Noble Gas Market Volume Share (%), by End-user Industry 2025 & 2033
- Figure 47: Europe Noble Gas Market Revenue (Million), by Country 2025 & 2033
- Figure 48: Europe Noble Gas Market Volume (K Tons), by Country 2025 & 2033
- Figure 49: Europe Noble Gas Market Revenue Share (%), by Country 2025 & 2033
- Figure 50: Europe Noble Gas Market Volume Share (%), by Country 2025 & 2033
- Figure 51: South America Noble Gas Market Revenue (Million), by Type 2025 & 2033
- Figure 52: South America Noble Gas Market Volume (K Tons), by Type 2025 & 2033
- Figure 53: South America Noble Gas Market Revenue Share (%), by Type 2025 & 2033
- Figure 54: South America Noble Gas Market Volume Share (%), by Type 2025 & 2033
- Figure 55: South America Noble Gas Market Revenue (Million), by Application 2025 & 2033
- Figure 56: South America Noble Gas Market Volume (K Tons), by Application 2025 & 2033
- Figure 57: South America Noble Gas Market Revenue Share (%), by Application 2025 & 2033
- Figure 58: South America Noble Gas Market Volume Share (%), by Application 2025 & 2033
- Figure 59: South America Noble Gas Market Revenue (Million), by End-user Industry 2025 & 2033
- Figure 60: South America Noble Gas Market Volume (K Tons), by End-user Industry 2025 & 2033
- Figure 61: South America Noble Gas Market Revenue Share (%), by End-user Industry 2025 & 2033
- Figure 62: South America Noble Gas Market Volume Share (%), by End-user Industry 2025 & 2033
- Figure 63: South America Noble Gas Market Revenue (Million), by Country 2025 & 2033
- Figure 64: South America Noble Gas Market Volume (K Tons), by Country 2025 & 2033
- Figure 65: South America Noble Gas Market Revenue Share (%), by Country 2025 & 2033
- Figure 66: South America Noble Gas Market Volume Share (%), by Country 2025 & 2033
- Figure 67: Middle East Noble Gas Market Revenue (Million), by Type 2025 & 2033
- Figure 68: Middle East Noble Gas Market Volume (K Tons), by Type 2025 & 2033
- Figure 69: Middle East Noble Gas Market Revenue Share (%), by Type 2025 & 2033
- Figure 70: Middle East Noble Gas Market Volume Share (%), by Type 2025 & 2033
- Figure 71: Middle East Noble Gas Market Revenue (Million), by Application 2025 & 2033
- Figure 72: Middle East Noble Gas Market Volume (K Tons), by Application 2025 & 2033
- Figure 73: Middle East Noble Gas Market Revenue Share (%), by Application 2025 & 2033
- Figure 74: Middle East Noble Gas Market Volume Share (%), by Application 2025 & 2033
- Figure 75: Middle East Noble Gas Market Revenue (Million), by End-user Industry 2025 & 2033
- Figure 76: Middle East Noble Gas Market Volume (K Tons), by End-user Industry 2025 & 2033
- Figure 77: Middle East Noble Gas Market Revenue Share (%), by End-user Industry 2025 & 2033
- Figure 78: Middle East Noble Gas Market Volume Share (%), by End-user Industry 2025 & 2033
- Figure 79: Middle East Noble Gas Market Revenue (Million), by Country 2025 & 2033
- Figure 80: Middle East Noble Gas Market Volume (K Tons), by Country 2025 & 2033
- Figure 81: Middle East Noble Gas Market Revenue Share (%), by Country 2025 & 2033
- Figure 82: Middle East Noble Gas Market Volume Share (%), by Country 2025 & 2033
- Figure 83: Saudi Arabia Noble Gas Market Revenue (Million), by Type 2025 & 2033
- Figure 84: Saudi Arabia Noble Gas Market Volume (K Tons), by Type 2025 & 2033
- Figure 85: Saudi Arabia Noble Gas Market Revenue Share (%), by Type 2025 & 2033
- Figure 86: Saudi Arabia Noble Gas Market Volume Share (%), by Type 2025 & 2033
- Figure 87: Saudi Arabia Noble Gas Market Revenue (Million), by Application 2025 & 2033
- Figure 88: Saudi Arabia Noble Gas Market Volume (K Tons), by Application 2025 & 2033
- Figure 89: Saudi Arabia Noble Gas Market Revenue Share (%), by Application 2025 & 2033
- Figure 90: Saudi Arabia Noble Gas Market Volume Share (%), by Application 2025 & 2033
- Figure 91: Saudi Arabia Noble Gas Market Revenue (Million), by End-user Industry 2025 & 2033
- Figure 92: Saudi Arabia Noble Gas Market Volume (K Tons), by End-user Industry 2025 & 2033
- Figure 93: Saudi Arabia Noble Gas Market Revenue Share (%), by End-user Industry 2025 & 2033
- Figure 94: Saudi Arabia Noble Gas Market Volume Share (%), by End-user Industry 2025 & 2033
- Figure 95: Saudi Arabia Noble Gas Market Revenue (Million), by Country 2025 & 2033
- Figure 96: Saudi Arabia Noble Gas Market Volume (K Tons), by Country 2025 & 2033
- Figure 97: Saudi Arabia Noble Gas Market Revenue Share (%), by Country 2025 & 2033
- Figure 98: Saudi Arabia Noble Gas Market Volume Share (%), by Country 2025 & 2033
List of Tables
- Table 1: Global Noble Gas Market Revenue Million Forecast, by Type 2020 & 2033
- Table 2: Global Noble Gas Market Volume K Tons Forecast, by Type 2020 & 2033
- Table 3: Global Noble Gas Market Revenue Million Forecast, by Application 2020 & 2033
- Table 4: Global Noble Gas Market Volume K Tons Forecast, by Application 2020 & 2033
- Table 5: Global Noble Gas Market Revenue Million Forecast, by End-user Industry 2020 & 2033
- Table 6: Global Noble Gas Market Volume K Tons Forecast, by End-user Industry 2020 & 2033
- Table 7: Global Noble Gas Market Revenue Million Forecast, by Region 2020 & 2033
- Table 8: Global Noble Gas Market Volume K Tons Forecast, by Region 2020 & 2033
- Table 9: Global Noble Gas Market Revenue Million Forecast, by Type 2020 & 2033
- Table 10: Global Noble Gas Market Volume K Tons Forecast, by Type 2020 & 2033
- Table 11: Global Noble Gas Market Revenue Million Forecast, by Application 2020 & 2033
- Table 12: Global Noble Gas Market Volume K Tons Forecast, by Application 2020 & 2033
- Table 13: Global Noble Gas Market Revenue Million Forecast, by End-user Industry 2020 & 2033
- Table 14: Global Noble Gas Market Volume K Tons Forecast, by End-user Industry 2020 & 2033
- Table 15: Global Noble Gas Market Revenue Million Forecast, by Country 2020 & 2033
- Table 16: Global Noble Gas Market Volume K Tons Forecast, by Country 2020 & 2033
- Table 17: China Noble Gas Market Revenue (Million) Forecast, by Application 2020 & 2033
- Table 18: China Noble Gas Market Volume (K Tons) Forecast, by Application 2020 & 2033
- Table 19: India Noble Gas Market Revenue (Million) Forecast, by Application 2020 & 2033
- Table 20: India Noble Gas Market Volume (K Tons) Forecast, by Application 2020 & 2033
- Table 21: Japan Noble Gas Market Revenue (Million) Forecast, by Application 2020 & 2033
- Table 22: Japan Noble Gas Market Volume (K Tons) Forecast, by Application 2020 & 2033
- Table 23: South Korea Noble Gas Market Revenue (Million) Forecast, by Application 2020 & 2033
- Table 24: South Korea Noble Gas Market Volume (K Tons) Forecast, by Application 2020 & 2033
- Table 25: Rest of Asia Pacific Noble Gas Market Revenue (Million) Forecast, by Application 2020 & 2033
- Table 26: Rest of Asia Pacific Noble Gas Market Volume (K Tons) Forecast, by Application 2020 & 2033
- Table 27: Global Noble Gas Market Revenue Million Forecast, by Type 2020 & 2033
- Table 28: Global Noble Gas Market Volume K Tons Forecast, by Type 2020 & 2033
- Table 29: Global Noble Gas Market Revenue Million Forecast, by Application 2020 & 2033
- Table 30: Global Noble Gas Market Volume K Tons Forecast, by Application 2020 & 2033
- Table 31: Global Noble Gas Market Revenue Million Forecast, by End-user Industry 2020 & 2033
- Table 32: Global Noble Gas Market Volume K Tons Forecast, by End-user Industry 2020 & 2033
- Table 33: Global Noble Gas Market Revenue Million Forecast, by Country 2020 & 2033
- Table 34: Global Noble Gas Market Volume K Tons Forecast, by Country 2020 & 2033
- Table 35: United States Noble Gas Market Revenue (Million) Forecast, by Application 2020 & 2033
- Table 36: United States Noble Gas Market Volume (K Tons) Forecast, by Application 2020 & 2033
- Table 37: Canada Noble Gas Market Revenue (Million) Forecast, by Application 2020 & 2033
- Table 38: Canada Noble Gas Market Volume (K Tons) Forecast, by Application 2020 & 2033
- Table 39: Mexico Noble Gas Market Revenue (Million) Forecast, by Application 2020 & 2033
- Table 40: Mexico Noble Gas Market Volume (K Tons) Forecast, by Application 2020 & 2033
- Table 41: Global Noble Gas Market Revenue Million Forecast, by Type 2020 & 2033
- Table 42: Global Noble Gas Market Volume K Tons Forecast, by Type 2020 & 2033
- Table 43: Global Noble Gas Market Revenue Million Forecast, by Application 2020 & 2033
- Table 44: Global Noble Gas Market Volume K Tons Forecast, by Application 2020 & 2033
- Table 45: Global Noble Gas Market Revenue Million Forecast, by End-user Industry 2020 & 2033
- Table 46: Global Noble Gas Market Volume K Tons Forecast, by End-user Industry 2020 & 2033
- Table 47: Global Noble Gas Market Revenue Million Forecast, by Country 2020 & 2033
- Table 48: Global Noble Gas Market Volume K Tons Forecast, by Country 2020 & 2033
- Table 49: Germany Noble Gas Market Revenue (Million) Forecast, by Application 2020 & 2033
- Table 50: Germany Noble Gas Market Volume (K Tons) Forecast, by Application 2020 & 2033
- Table 51: United Kingdom Noble Gas Market Revenue (Million) Forecast, by Application 2020 & 2033
- Table 52: United Kingdom Noble Gas Market Volume (K Tons) Forecast, by Application 2020 & 2033
- Table 53: Italy Noble Gas Market Revenue (Million) Forecast, by Application 2020 & 2033
- Table 54: Italy Noble Gas Market Volume (K Tons) Forecast, by Application 2020 & 2033
- Table 55: France Noble Gas Market Revenue (Million) Forecast, by Application 2020 & 2033
- Table 56: France Noble Gas Market Volume (K Tons) Forecast, by Application 2020 & 2033
- Table 57: Rest of Europe Noble Gas Market Revenue (Million) Forecast, by Application 2020 & 2033
- Table 58: Rest of Europe Noble Gas Market Volume (K Tons) Forecast, by Application 2020 & 2033
- Table 59: Global Noble Gas Market Revenue Million Forecast, by Type 2020 & 2033
- Table 60: Global Noble Gas Market Volume K Tons Forecast, by Type 2020 & 2033
- Table 61: Global Noble Gas Market Revenue Million Forecast, by Application 2020 & 2033
- Table 62: Global Noble Gas Market Volume K Tons Forecast, by Application 2020 & 2033
- Table 63: Global Noble Gas Market Revenue Million Forecast, by End-user Industry 2020 & 2033
- Table 64: Global Noble Gas Market Volume K Tons Forecast, by End-user Industry 2020 & 2033
- Table 65: Global Noble Gas Market Revenue Million Forecast, by Country 2020 & 2033
- Table 66: Global Noble Gas Market Volume K Tons Forecast, by Country 2020 & 2033
- Table 67: Brazil Noble Gas Market Revenue (Million) Forecast, by Application 2020 & 2033
- Table 68: Brazil Noble Gas Market Volume (K Tons) Forecast, by Application 2020 & 2033
- Table 69: Argentina Noble Gas Market Revenue (Million) Forecast, by Application 2020 & 2033
- Table 70: Argentina Noble Gas Market Volume (K Tons) Forecast, by Application 2020 & 2033
- Table 71: Rest of South America Noble Gas Market Revenue (Million) Forecast, by Application 2020 & 2033
- Table 72: Rest of South America Noble Gas Market Volume (K Tons) Forecast, by Application 2020 & 2033
- Table 73: Global Noble Gas Market Revenue Million Forecast, by Type 2020 & 2033
- Table 74: Global Noble Gas Market Volume K Tons Forecast, by Type 2020 & 2033
- Table 75: Global Noble Gas Market Revenue Million Forecast, by Application 2020 & 2033
- Table 76: Global Noble Gas Market Volume K Tons Forecast, by Application 2020 & 2033
- Table 77: Global Noble Gas Market Revenue Million Forecast, by End-user Industry 2020 & 2033
- Table 78: Global Noble Gas Market Volume K Tons Forecast, by End-user Industry 2020 & 2033
- Table 79: Global Noble Gas Market Revenue Million Forecast, by Country 2020 & 2033
- Table 80: Global Noble Gas Market Volume K Tons Forecast, by Country 2020 & 2033
- Table 81: Global Noble Gas Market Revenue Million Forecast, by Type 2020 & 2033
- Table 82: Global Noble Gas Market Volume K Tons Forecast, by Type 2020 & 2033
- Table 83: Global Noble Gas Market Revenue Million Forecast, by Application 2020 & 2033
- Table 84: Global Noble Gas Market Volume K Tons Forecast, by Application 2020 & 2033
- Table 85: Global Noble Gas Market Revenue Million Forecast, by End-user Industry 2020 & 2033
- Table 86: Global Noble Gas Market Volume K Tons Forecast, by End-user Industry 2020 & 2033
- Table 87: Global Noble Gas Market Revenue Million Forecast, by Country 2020 & 2033
- Table 88: Global Noble Gas Market Volume K Tons Forecast, by Country 2020 & 2033
- Table 89: South Africa Noble Gas Market Revenue (Million) Forecast, by Application 2020 & 2033
- Table 90: South Africa Noble Gas Market Volume (K Tons) Forecast, by Application 2020 & 2033
- Table 91: Rest of Middle East Noble Gas Market Revenue (Million) Forecast, by Application 2020 & 2033
- Table 92: Rest of Middle East Noble Gas Market Volume (K Tons) Forecast, by Application 2020 & 2033
Frequently Asked Questions
1. What is the projected Compound Annual Growth Rate (CAGR) of the Noble Gas Market?
The projected CAGR is approximately > 5.00%.
2. Which companies are prominent players in the Noble Gas Market?
Key companies in the market include Air Products and Chemicals Inc, Messer North America Inc, Gulf Cryo, Ras Gas Company Limited, Praxair Technology Inc, BASF SE, ITM Power, Linde plc, American Gas, TAIYO NIPPON SANSO CORPORATION*List Not Exhaustive, Royal Dutch Shell PLC, Buzwair Industrial Gases Factories, Air Liquide, Airgas Inc.
3. What are the main segments of the Noble Gas Market?
The market segments include Type, Application, End-user Industry.
4. Can you provide details about the market size?
The market size is estimated to be USD 43600 Million as of 2022.
5. What are some drivers contributing to market growth?
Growing Demand in the Healthcare Industry; Expansion of Steel and Automotive industry.
6. What are the notable trends driving market growth?
Increasing Demand from the Healthcare Industry.
7. Are there any restraints impacting market growth?
Fluctuating Prices of Noble gases; Need of high-efficient gas extracting method.
8. Can you provide examples of recent developments in the market?
April 2022: Linde signed an off-take agreement to recover the helium contained in Freeport LNG's production site in Texas (United States). Linde will also construct a helium processing plant for liquid helium in the United States.
9. What pricing options are available for accessing the report?
Pricing options include single-user, multi-user, and enterprise licenses priced at USD 4750, USD 5250, and USD 8750 respectively.
10. Is the market size provided in terms of value or volume?
The market size is provided in terms of value, measured in Million and volume, measured in K Tons.
11. Are there any specific market keywords associated with the report?
Yes, the market keyword associated with the report is "Noble Gas Market," which aids in identifying and referencing the specific market segment covered.
12. How do I determine which pricing option suits my needs best?
The pricing options vary based on user requirements and access needs. Individual users may opt for single-user licenses, while businesses requiring broader access may choose multi-user or enterprise licenses for cost-effective access to the report.
13. Are there any additional resources or data provided in the Noble Gas Market report?
While the report offers comprehensive insights, it's advisable to review the specific contents or supplementary materials provided to ascertain if additional resources or data are available.
14. How can I stay updated on further developments or reports in the Noble Gas Market?
To stay informed about further developments, trends, and reports in the Noble Gas Market, consider subscribing to industry newsletters, following relevant companies and organizations, or regularly checking reputable industry news sources and publications.
Methodology
Step 1 - Identification of Relevant Samples Size from Population Database


Step 2 - Approaches for Defining Global Market Size (Value, Volume* & Price*)

Note*: In applicable scenarios
Step 3 - Data Sources
Primary Research
- Web Analytics
- Survey Reports
- Research Institute
- Latest Research Reports
- Opinion Leaders
Secondary Research
- Annual Reports
- White Paper
- Latest Press Release
- Industry Association
- Paid Database
- Investor Presentations

Step 4 - Data Triangulation
Involves using different sources of information in order to increase the validity of a study
These sources are likely to be stakeholders in a program - participants, other researchers, program staff, other community members, and so on.
Then we put all data in single framework & apply various statistical tools to find out the dynamic on the market.
During the analysis stage, feedback from the stakeholder groups would be compared to determine areas of agreement as well as areas of divergence