

Key Insights
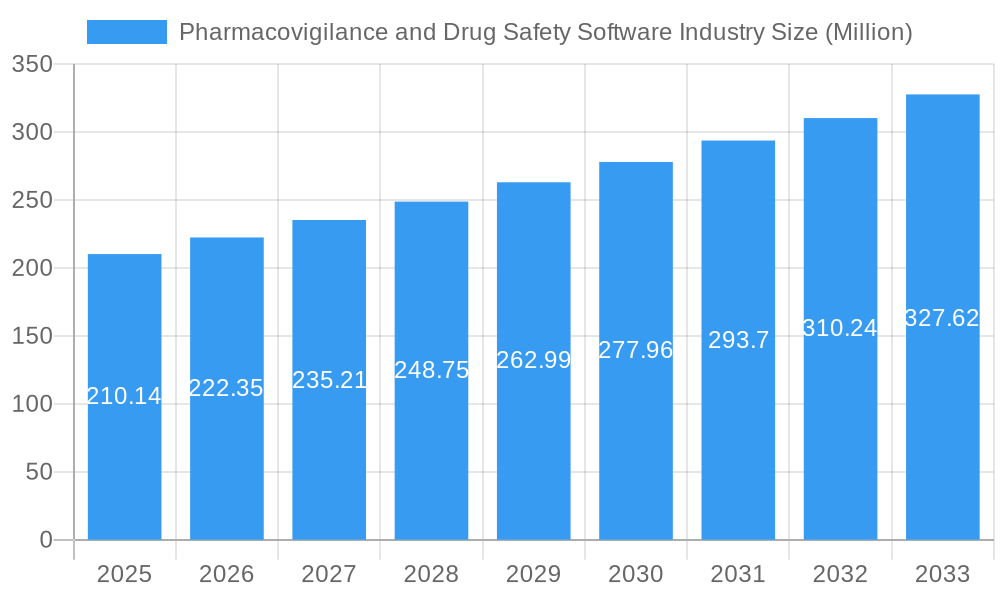
The global Pharmacovigilance and Drug Safety Software market is poised for substantial expansion, estimated at $210.14 million in 2025 and projected to grow at a Compound Annual Growth Rate (CAGR) of 5.73% through 2033. This robust growth is primarily fueled by an increasing emphasis on patient safety and regulatory compliance across the pharmaceutical and biotechnology sectors. As regulatory bodies worldwide impose stricter guidelines for drug safety monitoring and reporting, the demand for sophisticated software solutions that can efficiently manage adverse event reporting, conduct drug safety audits, and track critical issues is escalating. Key drivers include the rising incidence of chronic diseases, leading to a greater number of drug approvals and post-market surveillance requirements, coupled with the growing complexity of drug development pipelines. Furthermore, the increasing adoption of cloud-based (SaaS) solutions by small and medium-sized enterprises (SMEs) is democratizing access to these critical tools, driving further market penetration. The proactive identification and mitigation of drug-related risks are paramount, making advanced pharmacovigilance software an indispensable asset for life science organizations.
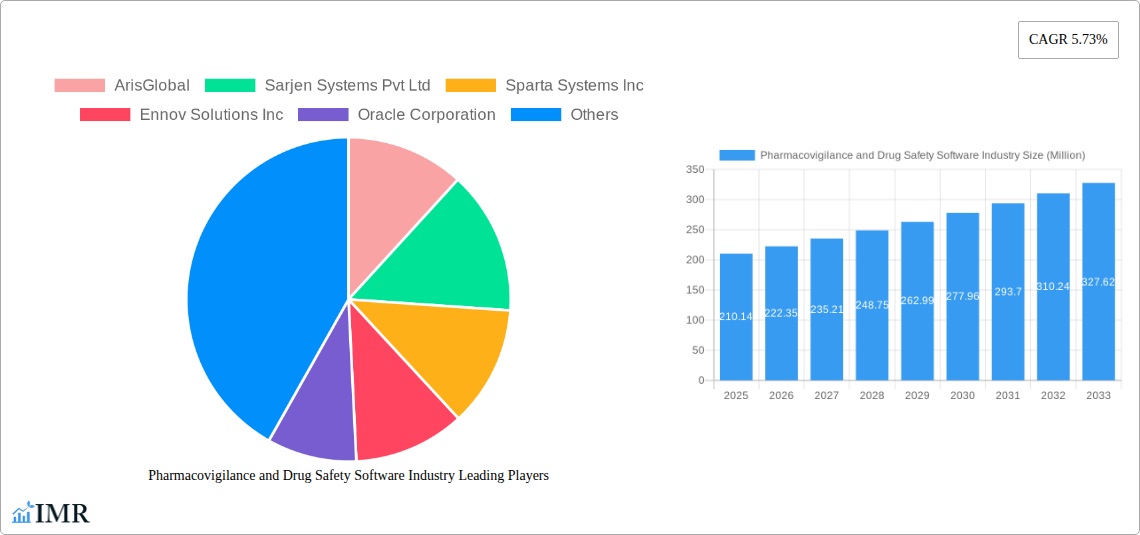
Pharmacovigilance and Drug Safety Software Industry Market Size (In Million)
The market is characterized by a dynamic landscape of evolving functionalities and delivery models. Fully integrated software solutions are gaining traction as they offer end-to-end management of pharmacovigilance processes, from data collection to signal detection and regulatory reporting. This integration streamlines operations and enhances data accuracy. The shift towards on-demand/cloud-based (SaaS) delivery is a significant trend, offering scalability, cost-effectiveness, and easier accessibility compared to traditional on-premise solutions. This model empowers pharmaceutical and biotechnology companies, contract research organizations (CROs), and Business Process Outsourcing (BPO) firms to optimize their pharmacovigilance operations without significant upfront IT investments. Emerging markets in the Asia Pacific, particularly China and India, represent significant growth opportunities due to their expanding pharmaceutical industries and increasing regulatory oversight. However, challenges such as high implementation costs for certain advanced features and the need for skilled personnel to manage complex software systems may present restraints. Nevertheless, the overarching imperative of ensuring drug safety and meeting stringent global regulatory demands will continue to propel the market forward.
Pharmacovigilance and Drug Safety Software Industry Company Market Share
Pharmacovigilance and Drug Safety Software Industry: Market Dynamics, Trends, and Future Outlook (2019-2033)
This comprehensive report delves into the dynamic Pharmacovigilance and Drug Safety Software industry, offering an in-depth analysis of market structure, growth trajectories, regional dominance, product landscapes, key drivers, emerging opportunities, and the competitive environment. With a study period spanning from 2019 to 2033, including a base year of 2025 and a forecast period of 2025–2033, this report provides critical insights for stakeholders navigating this evolving sector.
Pharmacovigilance and Drug Safety Software Industry Market Dynamics & Structure
The Pharmacovigilance and Drug Safety Software market is characterized by a moderate to high degree of concentration, with key players investing heavily in technological innovation to meet stringent global regulatory demands. The primary drivers of innovation include the increasing complexity of drug development pipelines, the need for real-time adverse event detection, and the imperative to ensure patient safety. Regulatory frameworks, such as FDA's Adverse Event Reporting System (FAERS) and the European Medicines Agency's (EMA) EudraVigilance, dictate software functionalities and compliance standards, creating significant barriers for new entrants. Competitive product substitutes, while present in basic data management, are often outmatched by the specialized features and integrated solutions offered by dedicated pharmacovigilance platforms. End-user demographics are shifting, with a growing reliance on sophisticated software by Pharmaceutical and Biotechnology Companies, Contract Research Organizations (CROs), and Business Process Outsourcing (BPO) firms. Mergers and acquisitions (M&A) are prevalent, driven by the desire to expand market reach, acquire cutting-edge technology, and consolidate offerings. For instance, the increasing adoption of cloud-based solutions is a significant trend shaping market dynamics.
- Market Concentration: Dominated by a few leading vendors, with significant market share held by established players.
- Technological Innovation Drivers: Real-time data analytics, AI/ML integration for predictive safety signals, and enhanced data security.
- Regulatory Frameworks: Compliance with global regulations (FDA, EMA, ICH) is paramount, influencing software design and adoption.
- Competitive Product Substitutes: Basic data management tools are insufficient; specialized pharmacovigilance solutions offer distinct advantages.
- End-User Demographics: Growing demand from large pharmaceutical companies, mid-sized biotech firms, and outsourced service providers.
- M&A Trends: Strategic acquisitions aimed at market expansion and technology integration.
Pharmacovigilance and Drug Safety Software Industry Growth Trends & Insights
The Pharmacovigilance and Drug Safety Software market is poised for robust expansion, driven by an escalating volume of pharmaceutical research and development, coupled with increasingly rigorous global pharmacovigilance regulations. The estimated market size for 2025 is projected to reach approximately $4,500 Million, with a projected Compound Annual Growth Rate (CAGR) of over 10% from 2025 to 2033. This upward trajectory is fueled by the growing awareness of drug safety and the proactive measures taken by regulatory bodies worldwide. Adoption rates are accelerating, particularly for cloud-based (SaaS) delivery models, which offer scalability, cost-effectiveness, and easier integration. Technological disruptions, such as the integration of Artificial Intelligence (AI) and Machine Learning (ML) for predictive analytics and signal detection, are transforming how adverse events are identified and managed. Consumer behavior shifts, influenced by the increasing emphasis on patient outcomes and real-world evidence, are compelling organizations to invest in comprehensive drug safety solutions. The market penetration of specialized software is deepening, moving beyond essential reporting to encompass broader safety surveillance and risk management. The transition of pharmacovigilance from CRO services to in-house practices, exemplified by PegBio's selection of ArisGlobal's LifeSphere MultiVigilance in October 2022, underscores this trend, highlighting the demand for integrated and robust in-house solutions. Furthermore, the increasing complexity of drug discovery and development necessitates advanced platforms like Dotmatics' Small Molecule Drug Discovery Solution, launched in July 2022, which integrates scientific R&D with expanded data management capabilities, indirectly supporting the early stages of safety assessment.
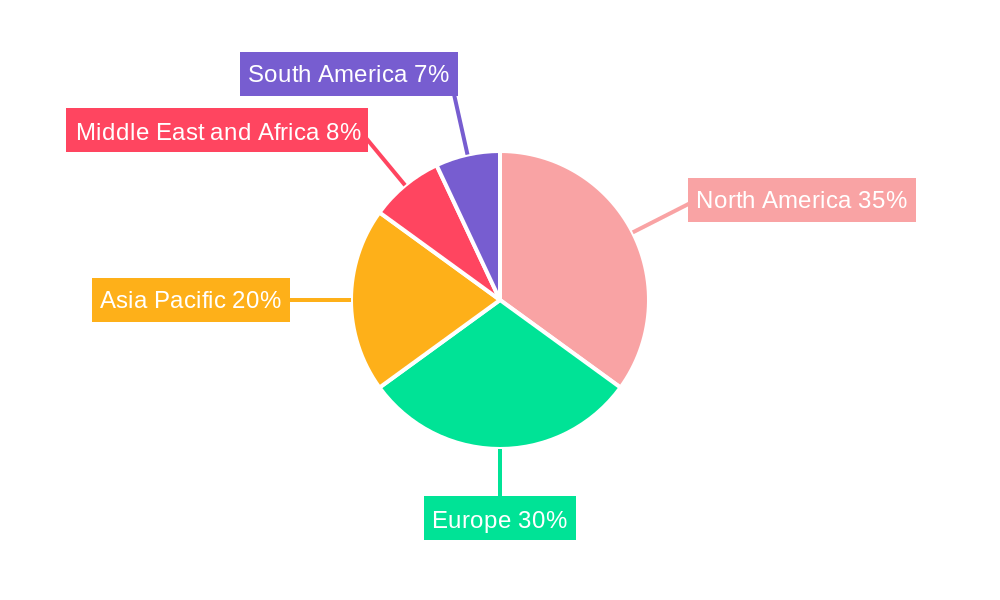
Dominant Regions, Countries, or Segments in Pharmacovigilance and Drug Safety Software Industry
North America currently dominates the Pharmacovigilance and Drug Safety Software market, driven by the presence of a robust pharmaceutical and biotechnology ecosystem, stringent regulatory oversight by the FDA, and a high rate of adoption for advanced software solutions. The United States, in particular, accounts for a substantial share of this regional dominance. Within the functionality segment, Fully Integrated Software is experiencing the most significant growth, offering a holistic approach to drug safety management that encompasses adverse event reporting, signal detection, risk management, and regulatory submissions. This comprehensive approach streamlines workflows and enhances data accuracy, making it highly attractive to end-users. The On-demand/Cloud-based (SaaS) Delivery mode is also a primary growth driver, offering flexibility, scalability, and cost efficiencies that are particularly appealing to a wide range of end-users. Pharmaceutical and Biotechnology Companies represent the largest end-user segment, investing heavily in sophisticated pharmacovigilance systems to ensure compliance and patient safety. Contract Research Organizations (CROs) and Business Process Outsourcing (BPO) Firms are also key adopters, leveraging these software solutions to provide specialized services to their clients. The growth in these segments is further propelled by increasing global collaboration in drug development and the need for standardized safety data exchange. Economic policies that support R&D, coupled with a strong infrastructure for digital health, further solidify North America's leading position, while similar trends are emerging in the European Union.
- Dominant Region: North America, led by the United States.
- Dominant Functionality Segment: Fully Integrated Software, due to its comprehensive capabilities.
- Dominant Mode of Delivery: On-demand/Cloud-based (SaaS) Delivery, offering flexibility and scalability.
- Dominant End-User Segment: Pharmaceutical and Biotechnology Companies, due to substantial investment in drug safety.
- Key Drivers: Stringent regulatory bodies (FDA), high R&D expenditure, advanced technological adoption, and robust digital infrastructure.
- Growth Potential: Continued expansion in emerging economies as regulatory landscapes mature.
Pharmacovigilance and Drug Safety Software Industry Product Landscape
The product landscape for Pharmacovigilance and Drug Safety Software is marked by continuous innovation, with vendors striving to offer comprehensive, intelligent, and user-friendly solutions. Leading products integrate advanced functionalities such as automated case processing, real-time signal detection powered by AI/ML algorithms, and seamless regulatory reporting capabilities. Unique selling propositions often revolve around superior data analytics, intuitive interfaces, and robust compliance management features that adapt to evolving global regulations. Technological advancements focus on enhancing data interoperability, secure data handling, and the provision of actionable insights derived from vast datasets, empowering organizations to proactively manage drug risks and ensure patient well-being.
Key Drivers, Barriers & Challenges in Pharmacovigilance and Drug Safety Software Industry
The Pharmacovigilance and Drug Safety Software market is propelled by several key drivers, including the escalating complexity of drug development, stringent global regulatory mandates like FDA and EMA requirements, and the increasing emphasis on real-world evidence and patient safety. Technological advancements, particularly in AI and ML for predictive analytics and automated case processing, are significant catalysts. The growing trend of outsourcing pharmacovigilance activities also fuels demand.
Conversely, significant barriers and challenges exist. The high cost of implementing and maintaining sophisticated software systems can be prohibitive, especially for smaller organizations. Data privacy and security concerns, coupled with the complexity of integrating disparate data sources, pose ongoing hurdles. Fierce competition among vendors and the need for continuous software updates to align with ever-changing regulations also present challenges. Supply chain issues for data processing and the need for specialized skilled personnel to manage these complex systems are additional restraints.
Emerging Opportunities in Pharmacovigilance and Drug Safety Software Industry
Emerging opportunities in the Pharmacovigilance and Drug Safety Software industry lie in the expansion of AI and ML applications beyond basic signal detection to include predictive risk modeling and personalized safety assessments. The growing market for decentralized clinical trials presents a unique opportunity for software solutions that can effectively collect and analyze real-world safety data from remote participants. Furthermore, there is a burgeoning demand for integrated solutions that bridge the gap between drug discovery, clinical trials, and post-market surveillance, offering a unified view of drug safety throughout its lifecycle. Untapped markets in developing economies with maturing regulatory frameworks also represent significant growth potential.
Growth Accelerators in the Pharmacovigilance and Drug Safety Software Industry Industry
Several growth accelerators are poised to significantly bolster the Pharmacovigilance and Drug Safety Software industry. Technological breakthroughs in natural language processing (NLP) for automated extraction of safety information from unstructured data sources like medical literature and social media are a key accelerator. Strategic partnerships between software providers and AI/ML companies are fostering the development of more sophisticated predictive analytics and automated decision-making tools. Market expansion strategies, including the localization of software features and compliance modules for specific regional regulations, are opening up new geographical markets. The increasing adoption of cloud-native architectures for greater scalability, agility, and cost-effectiveness further fuels sustained growth.
Key Players Shaping the Pharmacovigilance and Drug Safety Software Industry Market
- ArisGlobal
- Sarjen Systems Pvt Ltd
- Sparta Systems Inc
- Ennov Solutions Inc
- Oracle Corporation
- Anju Software Inc
- Veeva Systems
- Ab Cube
- United BioSource Corporation
- Extedo GmbH
Notable Milestones in Pharmacovigilance and Drug Safety Software Industry Sector
- October 2022: PegBio selected LifeSphere MultiVigilance, a flagship product by ArisGlobal, to transition their pharmacovigilance from Contract Research Organization (CRO) services to in-house practices with this leading pharmacovigilance software.
- July 2022: Dotmatics launched its Small Molecule Drug Discovery Solution, an integrated scientific R&D platform with pre-configured workflows and expanded data management capabilities.
In-Depth Pharmacovigilance and Drug Safety Software Industry Market Outlook
The future outlook for the Pharmacovigilance and Drug Safety Software industry is exceptionally promising, driven by an unwavering commitment to patient safety and increasingly stringent global regulatory demands. Growth accelerators such as AI-driven predictive analytics, advanced NLP for data mining, and the expansion of cloud-based solutions will continue to redefine market capabilities. Strategic partnerships and the ongoing consolidation within the industry will lead to more integrated and comprehensive offerings, enhancing efficiency and effectiveness in drug safety management. The evolving landscape of decentralized clinical trials and the increasing focus on real-world evidence will necessitate sophisticated software capable of handling diverse data streams. Emerging markets, as they strengthen their regulatory frameworks, represent significant untapped potential, ensuring a sustained period of robust growth and innovation.
Pharmacovigilance and Drug Safety Software Industry Segmentation
-
1. Functionality
- 1.1. Adverse Event Reporting Software
- 1.2. Drug Safety Audits Software
- 1.3. Issue Tracking Software
- 1.4. Fully Integrated Software
-
2. Mode of Delivery
- 2.1. On-premise Delivery
- 2.2. On-demand/ Cloud-based (SaaS) Delivery
-
3. End Users
- 3.1. Pharmaceutical and Biotechnology Companies
- 3.2. Contract Research Organizations
- 3.3. Business Process Outsourcing Firms
- 3.4. Other Pharmacovigilance Service Providers
Pharmacovigilance and Drug Safety Software Industry Segmentation By Geography
-
1. North America
- 1.1. United States
- 1.2. Canada
- 1.3. Mexico
-
2. Europe
- 2.1. Germany
- 2.2. United Kingdom
- 2.3. France
- 2.4. Italy
- 2.5. Spain
- 2.6. Rest of Europe
-
3. Asia Pacific
- 3.1. China
- 3.2. Japan
- 3.3. India
- 3.4. Australia
- 3.5. South Korea
- 3.6. Rest of Asia Pacific
-
4. Middle East and Africa
- 4.1. GCC
- 4.2. South Africa
- 4.3. Rest of Middle East and Africa
-
5. South America
- 5.1. Brazil
- 5.2. Argentina
- 5.3. Rest of South America
Pharmacovigilance and Drug Safety Software Industry Regional Market Share
Geographic Coverage of Pharmacovigilance and Drug Safety Software Industry
Pharmacovigilance and Drug Safety Software Industry REPORT HIGHLIGHTS
| Aspects | Details |
|---|---|
| Study Period | 2020-2034 |
| Base Year | 2025 |
| Estimated Year | 2026 |
| Forecast Period | 2026-2034 |
| Historical Period | 2020-2025 |
| Growth Rate | CAGR of 5.73% from 2020-2034 |
| Segmentation |
|
Table of Contents
- 1. Introduction
- 1.1. Research Scope
- 1.2. Market Segmentation
- 1.3. Research Objective
- 1.4. Definitions and Assumptions
- 2. Executive Summary
- 2.1. Market Snapshot
- 3. Market Dynamics
- 3.1. Market Drivers
- 3.2. Market Restrains
- 3.3. Market Trends
- 3.4. Market Opportunities
- 4. Market Factor Analysis
- 4.1. Porters Five Forces
- 4.1.1. Bargaining Power of Suppliers
- 4.1.2. Bargaining Power of Buyers
- 4.1.3. Threat of New Entrants
- 4.1.4. Threat of Substitutes
- 4.1.5. Competitive Rivalry
- 4.2. PESTEL analysis
- 4.3. BCG Analysis
- 4.3.1. Stars (High Growth, High Market Share)
- 4.3.2. Cash Cows (Low Growth, High Market Share)
- 4.3.3. Question Mark (High Growth, Low Market Share)
- 4.3.4. Dogs (Low Growth, Low Market Share)
- 4.4. Ansoff Matrix Analysis
- 4.5. Supply Chain Analysis
- 4.6. Regulatory Landscape
- 4.7. Current Market Potential and Opportunity Assessment (TAM–SAM–SOM Framework)
- 4.8. IMR Analyst Note
- 4.1. Porters Five Forces
- 5. Market Analysis, Insights and Forecast 2021-2033
- 5.1. Market Analysis, Insights and Forecast - by Functionality
- 5.1.1. Adverse Event Reporting Software
- 5.1.2. Drug Safety Audits Software
- 5.1.3. Issue Tracking Software
- 5.1.4. Fully Integrated Software
- 5.2. Market Analysis, Insights and Forecast - by Mode of Delivery
- 5.2.1. On-premise Delivery
- 5.2.2. On-demand/ Cloud-based (SaaS) Delivery
- 5.3. Market Analysis, Insights and Forecast - by End Users
- 5.3.1. Pharmaceutical and Biotechnology Companies
- 5.3.2. Contract Research Organizations
- 5.3.3. Business Process Outsourcing Firms
- 5.3.4. Other Pharmacovigilance Service Providers
- 5.4. Market Analysis, Insights and Forecast - by Region
- 5.4.1. North America
- 5.4.2. Europe
- 5.4.3. Asia Pacific
- 5.4.4. Middle East and Africa
- 5.4.5. South America
- 5.1. Market Analysis, Insights and Forecast - by Functionality
- 6. Global Pharmacovigilance and Drug Safety Software Industry Analysis, Insights and Forecast, 2021-2033
- 6.1. Market Analysis, Insights and Forecast - by Functionality
- 6.1.1. Adverse Event Reporting Software
- 6.1.2. Drug Safety Audits Software
- 6.1.3. Issue Tracking Software
- 6.1.4. Fully Integrated Software
- 6.2. Market Analysis, Insights and Forecast - by Mode of Delivery
- 6.2.1. On-premise Delivery
- 6.2.2. On-demand/ Cloud-based (SaaS) Delivery
- 6.3. Market Analysis, Insights and Forecast - by End Users
- 6.3.1. Pharmaceutical and Biotechnology Companies
- 6.3.2. Contract Research Organizations
- 6.3.3. Business Process Outsourcing Firms
- 6.3.4. Other Pharmacovigilance Service Providers
- 6.1. Market Analysis, Insights and Forecast - by Functionality
- 7. North America Pharmacovigilance and Drug Safety Software Industry Analysis, Insights and Forecast, 2020-2032
- 7.1. Market Analysis, Insights and Forecast - by Functionality
- 7.1.1. Adverse Event Reporting Software
- 7.1.2. Drug Safety Audits Software
- 7.1.3. Issue Tracking Software
- 7.1.4. Fully Integrated Software
- 7.2. Market Analysis, Insights and Forecast - by Mode of Delivery
- 7.2.1. On-premise Delivery
- 7.2.2. On-demand/ Cloud-based (SaaS) Delivery
- 7.3. Market Analysis, Insights and Forecast - by End Users
- 7.3.1. Pharmaceutical and Biotechnology Companies
- 7.3.2. Contract Research Organizations
- 7.3.3. Business Process Outsourcing Firms
- 7.3.4. Other Pharmacovigilance Service Providers
- 7.1. Market Analysis, Insights and Forecast - by Functionality
- 8. Europe Pharmacovigilance and Drug Safety Software Industry Analysis, Insights and Forecast, 2020-2032
- 8.1. Market Analysis, Insights and Forecast - by Functionality
- 8.1.1. Adverse Event Reporting Software
- 8.1.2. Drug Safety Audits Software
- 8.1.3. Issue Tracking Software
- 8.1.4. Fully Integrated Software
- 8.2. Market Analysis, Insights and Forecast - by Mode of Delivery
- 8.2.1. On-premise Delivery
- 8.2.2. On-demand/ Cloud-based (SaaS) Delivery
- 8.3. Market Analysis, Insights and Forecast - by End Users
- 8.3.1. Pharmaceutical and Biotechnology Companies
- 8.3.2. Contract Research Organizations
- 8.3.3. Business Process Outsourcing Firms
- 8.3.4. Other Pharmacovigilance Service Providers
- 8.1. Market Analysis, Insights and Forecast - by Functionality
- 9. Asia Pacific Pharmacovigilance and Drug Safety Software Industry Analysis, Insights and Forecast, 2020-2032
- 9.1. Market Analysis, Insights and Forecast - by Functionality
- 9.1.1. Adverse Event Reporting Software
- 9.1.2. Drug Safety Audits Software
- 9.1.3. Issue Tracking Software
- 9.1.4. Fully Integrated Software
- 9.2. Market Analysis, Insights and Forecast - by Mode of Delivery
- 9.2.1. On-premise Delivery
- 9.2.2. On-demand/ Cloud-based (SaaS) Delivery
- 9.3. Market Analysis, Insights and Forecast - by End Users
- 9.3.1. Pharmaceutical and Biotechnology Companies
- 9.3.2. Contract Research Organizations
- 9.3.3. Business Process Outsourcing Firms
- 9.3.4. Other Pharmacovigilance Service Providers
- 9.1. Market Analysis, Insights and Forecast - by Functionality
- 10. Middle East and Africa Pharmacovigilance and Drug Safety Software Industry Analysis, Insights and Forecast, 2020-2032
- 10.1. Market Analysis, Insights and Forecast - by Functionality
- 10.1.1. Adverse Event Reporting Software
- 10.1.2. Drug Safety Audits Software
- 10.1.3. Issue Tracking Software
- 10.1.4. Fully Integrated Software
- 10.2. Market Analysis, Insights and Forecast - by Mode of Delivery
- 10.2.1. On-premise Delivery
- 10.2.2. On-demand/ Cloud-based (SaaS) Delivery
- 10.3. Market Analysis, Insights and Forecast - by End Users
- 10.3.1. Pharmaceutical and Biotechnology Companies
- 10.3.2. Contract Research Organizations
- 10.3.3. Business Process Outsourcing Firms
- 10.3.4. Other Pharmacovigilance Service Providers
- 10.1. Market Analysis, Insights and Forecast - by Functionality
- 11. South America Pharmacovigilance and Drug Safety Software Industry Analysis, Insights and Forecast, 2020-2032
- 11.1. Market Analysis, Insights and Forecast - by Functionality
- 11.1.1. Adverse Event Reporting Software
- 11.1.2. Drug Safety Audits Software
- 11.1.3. Issue Tracking Software
- 11.1.4. Fully Integrated Software
- 11.2. Market Analysis, Insights and Forecast - by Mode of Delivery
- 11.2.1. On-premise Delivery
- 11.2.2. On-demand/ Cloud-based (SaaS) Delivery
- 11.3. Market Analysis, Insights and Forecast - by End Users
- 11.3.1. Pharmaceutical and Biotechnology Companies
- 11.3.2. Contract Research Organizations
- 11.3.3. Business Process Outsourcing Firms
- 11.3.4. Other Pharmacovigilance Service Providers
- 11.1. Market Analysis, Insights and Forecast - by Functionality
- 12. Competitive Analysis
- 12.1. Company Profiles
- 12.1.1 ArisGlobal
- 12.1.1.1. Company Overview
- 12.1.1.2. Products
- 12.1.1.3. Company Financials
- 12.1.1.4. SWOT Analysis
- 12.1.2 Sarjen Systems Pvt Ltd
- 12.1.2.1. Company Overview
- 12.1.2.2. Products
- 12.1.2.3. Company Financials
- 12.1.2.4. SWOT Analysis
- 12.1.3 Sparta Systems Inc
- 12.1.3.1. Company Overview
- 12.1.3.2. Products
- 12.1.3.3. Company Financials
- 12.1.3.4. SWOT Analysis
- 12.1.4 Ennov Solutions Inc
- 12.1.4.1. Company Overview
- 12.1.4.2. Products
- 12.1.4.3. Company Financials
- 12.1.4.4. SWOT Analysis
- 12.1.5 Oracle Corporation
- 12.1.5.1. Company Overview
- 12.1.5.2. Products
- 12.1.5.3. Company Financials
- 12.1.5.4. SWOT Analysis
- 12.1.6 Anju Software Inc
- 12.1.6.1. Company Overview
- 12.1.6.2. Products
- 12.1.6.3. Company Financials
- 12.1.6.4. SWOT Analysis
- 12.1.7 Veeva Systems
- 12.1.7.1. Company Overview
- 12.1.7.2. Products
- 12.1.7.3. Company Financials
- 12.1.7.4. SWOT Analysis
- 12.1.8 Ab Cube
- 12.1.8.1. Company Overview
- 12.1.8.2. Products
- 12.1.8.3. Company Financials
- 12.1.8.4. SWOT Analysis
- 12.1.9 United BioSource Corporation
- 12.1.9.1. Company Overview
- 12.1.9.2. Products
- 12.1.9.3. Company Financials
- 12.1.9.4. SWOT Analysis
- 12.1.10 Extedo GmbH
- 12.1.10.1. Company Overview
- 12.1.10.2. Products
- 12.1.10.3. Company Financials
- 12.1.10.4. SWOT Analysis
- 12.1.1 ArisGlobal
- 12.2. Market Entropy
- 12.2.1 Company's Key Areas Served
- 12.2.2 Recent Developments
- 12.3. Company Market Share Analysis 2025
- 12.3.1 Top 5 Companies Market Share Analysis
- 12.3.2 Top 3 Companies Market Share Analysis
- 12.4. List of Potential Customers
- 13. Research Methodology
List of Figures
- Figure 1: Global Pharmacovigilance and Drug Safety Software Industry Revenue Breakdown (Million, %) by Region 2025 & 2033
- Figure 2: North America Pharmacovigilance and Drug Safety Software Industry Revenue (Million), by Functionality 2025 & 2033
- Figure 3: North America Pharmacovigilance and Drug Safety Software Industry Revenue Share (%), by Functionality 2025 & 2033
- Figure 4: North America Pharmacovigilance and Drug Safety Software Industry Revenue (Million), by Mode of Delivery 2025 & 2033
- Figure 5: North America Pharmacovigilance and Drug Safety Software Industry Revenue Share (%), by Mode of Delivery 2025 & 2033
- Figure 6: North America Pharmacovigilance and Drug Safety Software Industry Revenue (Million), by End Users 2025 & 2033
- Figure 7: North America Pharmacovigilance and Drug Safety Software Industry Revenue Share (%), by End Users 2025 & 2033
- Figure 8: North America Pharmacovigilance and Drug Safety Software Industry Revenue (Million), by Country 2025 & 2033
- Figure 9: North America Pharmacovigilance and Drug Safety Software Industry Revenue Share (%), by Country 2025 & 2033
- Figure 10: Europe Pharmacovigilance and Drug Safety Software Industry Revenue (Million), by Functionality 2025 & 2033
- Figure 11: Europe Pharmacovigilance and Drug Safety Software Industry Revenue Share (%), by Functionality 2025 & 2033
- Figure 12: Europe Pharmacovigilance and Drug Safety Software Industry Revenue (Million), by Mode of Delivery 2025 & 2033
- Figure 13: Europe Pharmacovigilance and Drug Safety Software Industry Revenue Share (%), by Mode of Delivery 2025 & 2033
- Figure 14: Europe Pharmacovigilance and Drug Safety Software Industry Revenue (Million), by End Users 2025 & 2033
- Figure 15: Europe Pharmacovigilance and Drug Safety Software Industry Revenue Share (%), by End Users 2025 & 2033
- Figure 16: Europe Pharmacovigilance and Drug Safety Software Industry Revenue (Million), by Country 2025 & 2033
- Figure 17: Europe Pharmacovigilance and Drug Safety Software Industry Revenue Share (%), by Country 2025 & 2033
- Figure 18: Asia Pacific Pharmacovigilance and Drug Safety Software Industry Revenue (Million), by Functionality 2025 & 2033
- Figure 19: Asia Pacific Pharmacovigilance and Drug Safety Software Industry Revenue Share (%), by Functionality 2025 & 2033
- Figure 20: Asia Pacific Pharmacovigilance and Drug Safety Software Industry Revenue (Million), by Mode of Delivery 2025 & 2033
- Figure 21: Asia Pacific Pharmacovigilance and Drug Safety Software Industry Revenue Share (%), by Mode of Delivery 2025 & 2033
- Figure 22: Asia Pacific Pharmacovigilance and Drug Safety Software Industry Revenue (Million), by End Users 2025 & 2033
- Figure 23: Asia Pacific Pharmacovigilance and Drug Safety Software Industry Revenue Share (%), by End Users 2025 & 2033
- Figure 24: Asia Pacific Pharmacovigilance and Drug Safety Software Industry Revenue (Million), by Country 2025 & 2033
- Figure 25: Asia Pacific Pharmacovigilance and Drug Safety Software Industry Revenue Share (%), by Country 2025 & 2033
- Figure 26: Middle East and Africa Pharmacovigilance and Drug Safety Software Industry Revenue (Million), by Functionality 2025 & 2033
- Figure 27: Middle East and Africa Pharmacovigilance and Drug Safety Software Industry Revenue Share (%), by Functionality 2025 & 2033
- Figure 28: Middle East and Africa Pharmacovigilance and Drug Safety Software Industry Revenue (Million), by Mode of Delivery 2025 & 2033
- Figure 29: Middle East and Africa Pharmacovigilance and Drug Safety Software Industry Revenue Share (%), by Mode of Delivery 2025 & 2033
- Figure 30: Middle East and Africa Pharmacovigilance and Drug Safety Software Industry Revenue (Million), by End Users 2025 & 2033
- Figure 31: Middle East and Africa Pharmacovigilance and Drug Safety Software Industry Revenue Share (%), by End Users 2025 & 2033
- Figure 32: Middle East and Africa Pharmacovigilance and Drug Safety Software Industry Revenue (Million), by Country 2025 & 2033
- Figure 33: Middle East and Africa Pharmacovigilance and Drug Safety Software Industry Revenue Share (%), by Country 2025 & 2033
- Figure 34: South America Pharmacovigilance and Drug Safety Software Industry Revenue (Million), by Functionality 2025 & 2033
- Figure 35: South America Pharmacovigilance and Drug Safety Software Industry Revenue Share (%), by Functionality 2025 & 2033
- Figure 36: South America Pharmacovigilance and Drug Safety Software Industry Revenue (Million), by Mode of Delivery 2025 & 2033
- Figure 37: South America Pharmacovigilance and Drug Safety Software Industry Revenue Share (%), by Mode of Delivery 2025 & 2033
- Figure 38: South America Pharmacovigilance and Drug Safety Software Industry Revenue (Million), by End Users 2025 & 2033
- Figure 39: South America Pharmacovigilance and Drug Safety Software Industry Revenue Share (%), by End Users 2025 & 2033
- Figure 40: South America Pharmacovigilance and Drug Safety Software Industry Revenue (Million), by Country 2025 & 2033
- Figure 41: South America Pharmacovigilance and Drug Safety Software Industry Revenue Share (%), by Country 2025 & 2033
List of Tables
- Table 1: Global Pharmacovigilance and Drug Safety Software Industry Revenue Million Forecast, by Functionality 2020 & 2033
- Table 2: Global Pharmacovigilance and Drug Safety Software Industry Revenue Million Forecast, by Mode of Delivery 2020 & 2033
- Table 3: Global Pharmacovigilance and Drug Safety Software Industry Revenue Million Forecast, by End Users 2020 & 2033
- Table 4: Global Pharmacovigilance and Drug Safety Software Industry Revenue Million Forecast, by Region 2020 & 2033
- Table 5: Global Pharmacovigilance and Drug Safety Software Industry Revenue Million Forecast, by Functionality 2020 & 2033
- Table 6: Global Pharmacovigilance and Drug Safety Software Industry Revenue Million Forecast, by Mode of Delivery 2020 & 2033
- Table 7: Global Pharmacovigilance and Drug Safety Software Industry Revenue Million Forecast, by End Users 2020 & 2033
- Table 8: Global Pharmacovigilance and Drug Safety Software Industry Revenue Million Forecast, by Country 2020 & 2033
- Table 9: United States Pharmacovigilance and Drug Safety Software Industry Revenue (Million) Forecast, by Application 2020 & 2033
- Table 10: Canada Pharmacovigilance and Drug Safety Software Industry Revenue (Million) Forecast, by Application 2020 & 2033
- Table 11: Mexico Pharmacovigilance and Drug Safety Software Industry Revenue (Million) Forecast, by Application 2020 & 2033
- Table 12: Global Pharmacovigilance and Drug Safety Software Industry Revenue Million Forecast, by Functionality 2020 & 2033
- Table 13: Global Pharmacovigilance and Drug Safety Software Industry Revenue Million Forecast, by Mode of Delivery 2020 & 2033
- Table 14: Global Pharmacovigilance and Drug Safety Software Industry Revenue Million Forecast, by End Users 2020 & 2033
- Table 15: Global Pharmacovigilance and Drug Safety Software Industry Revenue Million Forecast, by Country 2020 & 2033
- Table 16: Germany Pharmacovigilance and Drug Safety Software Industry Revenue (Million) Forecast, by Application 2020 & 2033
- Table 17: United Kingdom Pharmacovigilance and Drug Safety Software Industry Revenue (Million) Forecast, by Application 2020 & 2033
- Table 18: France Pharmacovigilance and Drug Safety Software Industry Revenue (Million) Forecast, by Application 2020 & 2033
- Table 19: Italy Pharmacovigilance and Drug Safety Software Industry Revenue (Million) Forecast, by Application 2020 & 2033
- Table 20: Spain Pharmacovigilance and Drug Safety Software Industry Revenue (Million) Forecast, by Application 2020 & 2033
- Table 21: Rest of Europe Pharmacovigilance and Drug Safety Software Industry Revenue (Million) Forecast, by Application 2020 & 2033
- Table 22: Global Pharmacovigilance and Drug Safety Software Industry Revenue Million Forecast, by Functionality 2020 & 2033
- Table 23: Global Pharmacovigilance and Drug Safety Software Industry Revenue Million Forecast, by Mode of Delivery 2020 & 2033
- Table 24: Global Pharmacovigilance and Drug Safety Software Industry Revenue Million Forecast, by End Users 2020 & 2033
- Table 25: Global Pharmacovigilance and Drug Safety Software Industry Revenue Million Forecast, by Country 2020 & 2033
- Table 26: China Pharmacovigilance and Drug Safety Software Industry Revenue (Million) Forecast, by Application 2020 & 2033
- Table 27: Japan Pharmacovigilance and Drug Safety Software Industry Revenue (Million) Forecast, by Application 2020 & 2033
- Table 28: India Pharmacovigilance and Drug Safety Software Industry Revenue (Million) Forecast, by Application 2020 & 2033
- Table 29: Australia Pharmacovigilance and Drug Safety Software Industry Revenue (Million) Forecast, by Application 2020 & 2033
- Table 30: South Korea Pharmacovigilance and Drug Safety Software Industry Revenue (Million) Forecast, by Application 2020 & 2033
- Table 31: Rest of Asia Pacific Pharmacovigilance and Drug Safety Software Industry Revenue (Million) Forecast, by Application 2020 & 2033
- Table 32: Global Pharmacovigilance and Drug Safety Software Industry Revenue Million Forecast, by Functionality 2020 & 2033
- Table 33: Global Pharmacovigilance and Drug Safety Software Industry Revenue Million Forecast, by Mode of Delivery 2020 & 2033
- Table 34: Global Pharmacovigilance and Drug Safety Software Industry Revenue Million Forecast, by End Users 2020 & 2033
- Table 35: Global Pharmacovigilance and Drug Safety Software Industry Revenue Million Forecast, by Country 2020 & 2033
- Table 36: GCC Pharmacovigilance and Drug Safety Software Industry Revenue (Million) Forecast, by Application 2020 & 2033
- Table 37: South Africa Pharmacovigilance and Drug Safety Software Industry Revenue (Million) Forecast, by Application 2020 & 2033
- Table 38: Rest of Middle East and Africa Pharmacovigilance and Drug Safety Software Industry Revenue (Million) Forecast, by Application 2020 & 2033
- Table 39: Global Pharmacovigilance and Drug Safety Software Industry Revenue Million Forecast, by Functionality 2020 & 2033
- Table 40: Global Pharmacovigilance and Drug Safety Software Industry Revenue Million Forecast, by Mode of Delivery 2020 & 2033
- Table 41: Global Pharmacovigilance and Drug Safety Software Industry Revenue Million Forecast, by End Users 2020 & 2033
- Table 42: Global Pharmacovigilance and Drug Safety Software Industry Revenue Million Forecast, by Country 2020 & 2033
- Table 43: Brazil Pharmacovigilance and Drug Safety Software Industry Revenue (Million) Forecast, by Application 2020 & 2033
- Table 44: Argentina Pharmacovigilance and Drug Safety Software Industry Revenue (Million) Forecast, by Application 2020 & 2033
- Table 45: Rest of South America Pharmacovigilance and Drug Safety Software Industry Revenue (Million) Forecast, by Application 2020 & 2033
Frequently Asked Questions
1. What is the projected Compound Annual Growth Rate (CAGR) of the Pharmacovigilance and Drug Safety Software Industry?
The projected CAGR is approximately 5.73%.
2. Which companies are prominent players in the Pharmacovigilance and Drug Safety Software Industry?
Key companies in the market include ArisGlobal, Sarjen Systems Pvt Ltd, Sparta Systems Inc, Ennov Solutions Inc, Oracle Corporation, Anju Software Inc, Veeva Systems, Ab Cube, United BioSource Corporation, Extedo GmbH.
3. What are the main segments of the Pharmacovigilance and Drug Safety Software Industry?
The market segments include Functionality, Mode of Delivery, End Users.
4. Can you provide details about the market size?
The market size is estimated to be USD 210.14 Million as of 2022.
5. What are some drivers contributing to market growth?
Increasing Incidence of Adverse Drug Reactions (ADRs); Increasing Adoption of Pharmacovigilance Software by Outsourcing Companies.
6. What are the notable trends driving market growth?
Fully Integrated Software Expected to Witness Significant Growth Over the Forecast Period.
7. Are there any restraints impacting market growth?
Lack of Awareness about Pharmacovigilance.
8. Can you provide examples of recent developments in the market?
October 2022: PegBio selected LifeSphere MultiVigilance, a flagship product by ArisGlobal, to transition their pharmacovigilance from Contract Research Organization (CRO) services to in-house practices with this leading pharmacovigilance software.
9. What pricing options are available for accessing the report?
Pricing options include single-user, multi-user, and enterprise licenses priced at USD 4750, USD 5250, and USD 8750 respectively.
10. Is the market size provided in terms of value or volume?
The market size is provided in terms of value, measured in Million.
11. Are there any specific market keywords associated with the report?
Yes, the market keyword associated with the report is "Pharmacovigilance and Drug Safety Software Industry," which aids in identifying and referencing the specific market segment covered.
12. How do I determine which pricing option suits my needs best?
The pricing options vary based on user requirements and access needs. Individual users may opt for single-user licenses, while businesses requiring broader access may choose multi-user or enterprise licenses for cost-effective access to the report.
13. Are there any additional resources or data provided in the Pharmacovigilance and Drug Safety Software Industry report?
While the report offers comprehensive insights, it's advisable to review the specific contents or supplementary materials provided to ascertain if additional resources or data are available.
14. How can I stay updated on further developments or reports in the Pharmacovigilance and Drug Safety Software Industry?
To stay informed about further developments, trends, and reports in the Pharmacovigilance and Drug Safety Software Industry, consider subscribing to industry newsletters, following relevant companies and organizations, or regularly checking reputable industry news sources and publications.
Methodology
Step 1 - Identification of Relevant Samples Size from Population Database


Step 2 - Approaches for Defining Global Market Size (Value, Volume* & Price*)

Note*: In applicable scenarios
Step 3 - Data Sources
Primary Research
- Web Analytics
- Survey Reports
- Research Institute
- Latest Research Reports
- Opinion Leaders
Secondary Research
- Annual Reports
- White Paper
- Latest Press Release
- Industry Association
- Paid Database
- Investor Presentations

Step 4 - Data Triangulation
Involves using different sources of information in order to increase the validity of a study
These sources are likely to be stakeholders in a program - participants, other researchers, program staff, other community members, and so on.
Then we put all data in single framework & apply various statistical tools to find out the dynamic on the market.
During the analysis stage, feedback from the stakeholder groups would be compared to determine areas of agreement as well as areas of divergence